

Abstract
Background
The exact impact of ageing on skeletal muscle phenotype and mitochondrial and lipid content remains controversial, probably because physical activity, which greatly influences muscle physiology, is rarely accounted for. The present study was therefore designed to investigate the effects of ageing, physical activity, and pre‐frailty on skeletal muscle phenotype, and mitochondrial and intramyocellular lipid content in men.
Methods
Recreationally active young adult (20–30 yo; YA); active (ACT) and sedentary (SED) middle‐age (50–65 yo; MA‐ACT and MA‐SED); and older (65 + yo; 65 + ACT and 65 + SED) and pre‐frail older (65 + PF) men were recruited. Muscle biopsies from the vastus lateralis were collected to assess, on muscle cross sections, muscle phenotype (using myosin heavy chain isoforms immunolabelling), the fibre type‐specific content of mitochondria (by quantifying the succinate dehydrogenase stain intensity), and the fibre type‐specific lipid content (by quantifying the Oil Red O stain intensity).
Results
Only 65 + SED and 65 + PF displayed significantly lower overall and type IIa fibre sizes vs. YA. 65 + SED displayed a lower type IIa fibre proportion vs. YA. MA‐SED and 65 + SED displayed a higher hybrid type IIa/IIx fibre proportion vs. YA. Sedentary and pre‐frail, but not active, men displayed lower mitochondrial content irrespective of fibre type vs. YA. 65 + SED, but not 65 + ACT, displayed a higher lipid content in type I fibres vs. YA. Finally, mitochondrial content, but not lipid content, was positively correlated with indices of muscle function, functional capacity, and insulin sensitivity across all subjects.
Conclusions
Taken altogether, our results indicate that ageing in sedentary men is associated with (i) complex changes in muscle phenotype preferentially affecting type IIa fibres; (ii) a decline in mitochondrial content affecting all fibre types; and (iii) an increase in lipid content in type I fibres. They also indicate that physical activity partially protects from the effects of ageing on muscle phenotype, mitochondrial content, and lipid accumulation. No skeletal specific muscle phenotype of pre‐frailty was observed.
Keywords: Human muscle ageing, Atrophy, Sarcopenia, Mitochondria, Lipid content, Exercise
Introduction
The progressive age‐related decline in muscle mass, strength, and quality, a physiological process often termed sarcopenia, is one of the most characteristic changes occurring with ageing.1, 2 Because sarcopenia is the major factor leading to mobility impairment, falls, and physical frailty in older individuals, it can dramatically alter the quality of life of afflicted individuals.1, 3 With the rapid change in the demography of the ageing population, it will soon rank as one of the major financial burdens that our health care system will have to face. However, the aetiology of sarcopenia is complex and still poorly understood.4 Better understanding the biological process(es) responsible for sarcopenia is consequently one of the most important challenges that our society will have to address.
Several dogmas exist in the field of muscle ageing research. Indeed, it is commonly believed that (i) type II (fast‐twitch) fibres are preferentially affected during ageing, while type I (slow‐twitch, oxidative) fibres are relatively preserved; (ii) that mitochondrial content declines with ageing, therefore negatively impacting muscle oxidative capacity; and that (iii) reduced oxidative capacity leads to excessive myocellular accumulation of lipids which, in turn, could exert deleterious impacts on muscle ageing and insulin resistance. However, it is important to note that there is still debate in the literature on whether or not these characteristics are indeed hallmarks of muscle ageing.
Many controversies on this preferential type II loss and atrophy with ageing exist in the literature. Indeed, studies performed in rats have found a reduction in fast fibre proportion,5, 6 no change,7, 8 or an increase in fast fibre proportion.9, 10 Human studies showed a similar amount of variability with some reporting a decrease in fast fibre proportion,11, 12 others no change,13, 14, 15, 16 and one longitudinal study even reporting an increase in fast fibre proportion over a 12 year period.17 Controversies also subsist on the fibre type‐specificity of age‐related atrophy, with studies in both animal models and humans reporting a protection of type I fibre as compared with type II fibres,10, 12, 13, 18 while others have reported that type I and II fibres atrophy with age.15, 19, 20, 21, 22, 23, 24 Furthermore, whether ageing differentially affects type IIa (fast‐twitch, oxidative) and IIx (fast‐twitch, glycolytic) fibres remains poorly studied because in most studies, especially in humans, type IIa and IIx fibres are pooled into the same group. Therefore, our understanding of the effects of ageing on skeletal muscle phenotype in humans remains, at best, unclear.
Also widely accepted in the field of skeletal muscle ageing is the view that skeletal muscle mitochondrial content progressively declines with ageing, leading to a reduction in skeletal muscle oxidative capacity.25, 26, 27, 28 However, this view is challenged in the literature.15, 29, 30 This decline in mitochondrial content has also been linked to accumulation of lipid in muscle fibres27, 31 and the latter to insulin resistance.32 In addition, whether ageing impacts mitochondrial content and lipid content in a fibre type specific manner remains largely unexplored. Only one recent study compared the muscle fibre type specific mitochondrial and lipid content in young adult and old men, using Cytochrome C oxidase and Oil red O staining, respectively.33 No difference in mitochondrial content of type I and IIa fibres was observed between young and old men. In contrast, type IIa/IIx and IIx of old men displayed lower mitochondrial content.33 A trend for higher overall lipid content was observed in old men, reaching only statistical significance in type IIx fibres.33
To further add complexity, skeletal muscle phenotype,34, 35, 36 mitochondrial content,37, 38, 39 and lipid content37, 38 are all greatly affected by physical activity levels. Surprisingly, physical activity is rarely taken into account when investigating the effects of ageing on skeletal muscles, which most certainly could explain for part of the controversy in the field of muscle ageing.30 Therefore, there is a pressing need to reassess the impacts of ageing on skeletal muscle phenotype, mitochondrial content, and intramyocellular lipid content in men while considering physical activity levels. The main objective of the present study was therefore to investigate the effects of ageing and physical activity on skeletal muscle phenotype, mitochondrial content and intramyocellular lipid content in men. Pre‐frail old men, because they represent a sub‐population particularly at risk of falls and autonomy loss,40 were also included in our study. Finally, the relationships between skeletal muscle mitochondrial and lipid contents and clinically relevant markers of muscle function, functional capacity and insulin sensitivity were also investigated.
Methods
Participants
Fifty‐six men, aged from 20 to 94 years old (yo), were recruited and assigned to the three following groups: Young Adult (YA; 23.7 ± 0.8 yo; N = 11), Middle‐Age (MA; 50–65 yo, N = 14), and 65 yo and older (65+, N = 31). Participants in the MA were further divided in two sub‐groups: Active (MA‐ACT; 62.4 ± 0.8 yo; N = 7) and sedentary (MA‐SED; 61.7 ± 1.2 yo; N = 7), while participants in the 65+ group were divided in three sub‐groups: Active (65 + ACT; 73.4 ± 0.7 yo; N = 9), sedentary (65 + SED; 72.3 ± 0.9 yo; N = 14), and pre‐frail (65 + PF; 75.9 ± 3.1 yo; N = 7). Because of a technical problem, one 65+ participant could not be assigned to ACT or SED groups and was therefore removed from the database for group comparison. However, data from this participant were used for all correlation analyses. Young adult men were recruited at the Département des Sciences de l'activité Physique, Université du Québec à Montréal. Middle‐aged and older men were recruited from the community through newspapers and advertisements in fitness or sports clubs. Participants met the following criteria: no known motor, cardiac, or psychological pathology; nonsmoking; no to moderate alcohol consumption (≤2 drinks/day); and no metal implants. All procedures were approved by Comité Institutionnel d'Éthique de la Recherche avec des Êtres Humains de l'Université du Québec à Montréal (approval no. 709987). All participants were fully informed of the nature, goal, procedures, and risks of the study and gave their informed consent.
Physical activity levels were assessed by either (i) using self‐reported activity (collected with the Minnesota Leisure Time41 and the Physical activity Scale for the Elderly (PASE) questionnaires,42 as well as an interview conducted by a trained kinesiologist who asked how often per week and for how long the participants were exercising) or (ii) by estimating the daily average METs and the daily number of steps using an Armband Sensewear system (BodyMedia, Pittsburgh, PA). The Armband Sensewear uses a three‐axis accelerometer, a heat flux sensor, a galvanic skin response sensor, a skin temperature sensor, and a near‐body ambient temperature sensor to capture data. To be considered active, participants needed either (i) to report at least 150 min/wk of moderate‐ to vigorous‐intensity exercises as recommended by the 2011 American College of Sports Medicine Position Stand43 (except 1 MA‐ACT and 1 65 + ACT who both performed 120 min of vigorous exercise/week); (ii) needed to have an average daily Metabolic equivalent (METs) >1.9;44 or (iii) needed to have an average daily METs between 1.6 and 1.9 and perform more than 10 000 steps per day. To be considered PF, individuals needed to meet one to two of the three Fried criteria related to physical function (i.e. level of physical activity (assessed using the Minnesota Leisure Time Physical Activity questionnaire), walking speed, and handgrip strength; see45 for details). Finally, the YA group was mostly active, with five individuals performing less than and six performing more than 150 min/wk of moderate to vigorous‐intensity exercises, respectively. Figure S1 displays the range of weekly physical activity performed by our YA subjects. It should be noted that the fibre sizes and type proportion data from our YA participants, from two MA‐ACT and seven 65 + ACT, were already published in.15
Skeletal muscle biopsies
Skeletal muscle samples were obtained from the vastus lateralis muscle using Bergstrom needle biopsy15 performed under local anaesthesia. Solid muscle pieces were mounted on cork in tragacanth gum and frozen in liquid isopentane cooled in liquid N2. Histology blocks were stored at −80°C until analyses.
Skeletal muscle sample sectioning for histology
Eight‐micron thick serial cross sections were cut with a cryostat at −18°C and mounted on lysine coated slides (Superfrost) to determine fibre type, mitochondrial content, and lipid content as described in.46
In situ determination of fibre type
Muscle cross sections (8 µm thick) were cut and immunolabelled for myosin heavy chains (MHCs) I, IIa, and IIx using a previously described method.15, 46 Sections were first allowed to reach room temperature and rehydrated with phosphate‐buffered saline (PBS) (pH 7.2). These sections were then blocked using goat serum (10% in PBS) and incubated for 1 h at room temperature with the following primary antibody cocktail: a mouse IgG2b monoclonal anti‐MHC type I (BA‐F8, 1:25), mouse IgG1 monoclonal anti‐MHC type IIa (SC‐71, 1:200), mouse IgM monoclonal anti‐type IIx MHC (6H1, 1:25), and a rabbit IgG polyclonal anti‐laminin. Muscle cross sections were then washed 3 times in PBS before being incubated for 1 h at room temperature with the following secondary antibody cocktail: Alexa Fluor 350 IgG2b (y2b) goat anti‐mouse (A‐21140, 1:500; Invitrogen, Carlsbad, CA, USA), Alexa Fluor 594 IgG1 (y1) goat anti‐mouse (A‐21125, 1:100; Invitrogen), Alexa Fluor 488 IgM goat anti‐mouse (A‐21042, 1:500; Invitrogen), and Alexa Fluor 488 IgG goat anti‐rabbit (A‐11008, 1:500; Invitrogen). Muscle cross sections were then washed 3 times in PBS, and coverslips were applied to slides using Prolong Gold (P36930; Invitrogen) as mounting medium. All primary antibodies targeting MHCs were purchased from the Developmental Studies Hybridoma Bank (DSHB; University of Iowa, Iowa City, IA, USA). Slides were imaged with a Zeiss fluorescence microscope (Zeiss, Oberkochen, Germany). Frames for analysis were randomly sampled across each muscle section.
In situ determination of mitochondrial content using the succinate dehydrogenase stain
Sections were stained for succinate dehydrogenase (SDH, complex II of the respiratory chain) activity as follows:29, 46 Sections were first allowed to reach room temperature and were rehydrated with PBS (pH 7.2). Sections were then incubated in a solution containing nitroblue tetrazolium (1.5 mM), sodium succinate (130 mM), phenazine methosulphate (0.2 mM), and sodium azide (0.1 mM) for 45 min. Cross sections were then washed 3 times in PBS, dehydrated in 75% (30 s), 90% (30 s), and 100% (10 min) ethanol and cover‐slipped using an aqueous mounting medium (Vector Labs, VectaMount AQ Medium, H‐5501). All samples for each species were processed at the same time and using the same incubation solution, ensuring that all samples underwent the exact same conditions.
In situ determination of lipid content.
To determine the intramyocellular lipid content, the Oil Red O stain method (Oil Red O being a fat‐soluble and fluorescent dye) was used.46 Briefly, muscle cross sections were first allowed to reach room temperature and then fixed in 10% formalin (Sigma‐Aldrich, HT501128) for 5 min. Sections were then washed three times 1 min in distilled water before being placed in propylene glycol for 2 min. Sections were then incubated for 30 min in a solution containing 50 mg/mL of Oil Red O (Sigma—O0625, dissolved in propylene glycol [Sigma—P4347]). Sections were then differentiated in 85% propylene glycol (in distilled water) for 1 min and subsequently washed three times 1 min in distilled water. Sections were finally cover‐slipped using Prolong Gold (Invitrogen, P36930) as mounting medium.
Handgrip strength measurement
Maximum voluntary handgrip strength was measured using a hand dynamometer with an adjustable grip (Hand Dynamometer; Lafayette Instrument, Lafayette, IN). Participants were standing upright and were instructed to apply as much handgrip pressure as possible for at least 4 s, performing the test with the right and left hands in turn. Participants performed three trials for each hand. The maximal value was recorded.
Functional capacity assessment
To assess functional capacities, the following tests of the Short Physical Performance Battery47 were performed:
Walking speed
The time required for participants to walk at their regular comfortable self‐selected speed over a 4 m distance was recorded.
Stair test
The stair test consisted of alternatively placing the whole left and right feet as fast as possible onto a 20 cm high step for a 20 s period. The number of steps was recorded.
Timed Up and Go
The Timed Up and Go test consisted of standing up from a chair, walking 4 m, turning around (i.e. hairpin turn), going back to the chair, and sitting down as fast as possible. The time required to complete the test was recorded.
The sit to stand test
Participants had to rise from a chair (height = 45 cm, without armrests) 10 times as fast as possible with their arms folded on the chest. The time between the initial position (seated) and the final position (seated), after 10 movements, was recorded. Because this test is a reproducible measure of lower limb muscle power, it was used to estimate leg power using the equation described in.48
Anthropometric measurements and body composition
The participant's body weight was obtained using an electronic scale (GFK 660a, Balance Industrielles, Montreal, Canada), while the height was measured using a wall stadiometer (Seca, USA). Body mass index [BMI = body mass (kg) / height (m2)] was calculated.
Segmental lean masses and total fat mass were evaluated by Dual‐energy X‐ray absorptiometry (General Electric Lunar Corporation version 6.10.019, Madison, USA). Lower limbs lean mass and right thigh lean mass (estimated by manually defining the area between the pelvis to the knee joint) were calculated.
Blood sample collection and processing
For most participants, a 15 mL blood sample was collected following an overnight fast to assess serum fasting glucose and insulin concentrations. Serum fasting glucose was assessed using the glucose oxidase method.49 Serum fasting insulin was assessed using a human insulin radioimmunoassay kit (detection limit: 12 pmol/L; inter and intra‐assay coefficients of variation: 1.1% to 8.3%; Linco Research Inc., St. Charles, MO).
Homeostatic model assessment insulin resistance index (HOMA‐IR) was calculated using the formula: fasting serum insulin (pmol/L) × 0.167 × fasting serum glucose (mmol/L) / 22.5. Quantitative Insulin Sensitivity Check Index (QUICKI) 1 ⁄ [log fasting insulin (μU⁄mL) + log glucose (mg⁄dL)].
Statistical analyses
All graphs display individual values as well as box and whisker plots. Data in tables are presented as mean ± standard deviation. To assess whether or not data sets were normally distributed, the Shapiro–Wilk and Kolmogorov–Smirnov normality tests were performed. All statistical comparisons between groups were performed using either one‐way ANOVA followed by a Fisher Least Significant Difference test (when data in all groups were normally distributed) or Mann–Whitney U tests (when data in at least one group were not normally distributed). Corrections for multiple comparisons were performed using the Benjamini and Hochberg False discovery rate (with q < 0.2). Pearson correlations were performed to investigate relationships between the overall muscle mitochondrial and lipid content, parameters related to muscle function (thigh lean mass, overall fibre cross‐sectional area, lower limb fat mass, and leg power), functional capacity (chair test, timed up and go, and stair test) and insulin sensitivity (HOMA‐IR and QUICK‐I). P < 0.05 (and q < 0.2 for all between‐group comparisons) was considered significant. Statistical analyses were performed either in Prism 6 (GraphPad) or SPSS 22.0.
Results
Participant characteristics
Table 1 summarizes the main participant characteristics. No significant difference in BMI was observed between groups. YA had lower whole body fat percentage vs. MA‐SED and 65 + SED. MA‐SED displayed significantly higher percentage of fat mass vs. MA‐ACT, 65 + ACT and 65 + PF. No other significant difference in fat mass was observed between groups. 65 + PF displayed the lowest thigh lean mass. 65 + SED, 65 + ACT, and 65 + PF displayed lower thigh lean mass vs. YA. No other significant difference in thigh lean mass was observed between groups. YA had the highest handgrip strength, while 65 + PF had the lowest one. MA‐ACT had higher handgrip strength vs. 65 + SED, 65 + ACT, and 65 + PF. No other significant difference in handgrip strength was observed between groups. YA displayed the highest leg power. 65 + PF had significantly lower leg power vs. YA, MA‐SED, and 65 + ACT.
Table 1.
Participant characteristics
| YA (n = 11) | MA‐ACT (n = 7) | MA‐SED (n = 7) | 65 + Act (n = 9) | 65 + Sed (n = 14) | 65 + PF (n = 7) | ||
|---|---|---|---|---|---|---|---|
| Age (years) | 23.7 ± 2.7a | 60.0 ± 4.4b | 61.7 ± 3.3b | 73.2 ± 2.3c | 72.7 ± 3.4c | 75.9 ± 8.3c | |
| BMI (kg/m2) | 25.1 ± 2.5a | 26.7 ± 4.7a | 28.2 ± 2.7a | 25.4 ± 2.5a | 26.2 ± 2.0a | 25.7 ± 3.9a | |
| Fat mass (%) | 17.3 ± 6.7a | 22.9 ± 5.0ab | 31.1 ± 5.9c | 24.3 ± 6.2ab | 28.1 ± 5.0bc | 26.0 ± 6.8ab | |
| Thigh lean mass (kg) | 8.0 ± 1.3a | 6.9 ± 1.6abc | 6.9 ± 0.8ab | 6.4 ± 0.7b | 6.5 ± 1.0b | 5.5 ± 0.7c | |
| Handgrip strength (kg) | 56.0 ± 8.1a | 48.3 ± 8.2b | 46.4 ± 8.5bc | 40.8 ± 5.5c | 41.1 ± 6.9c | 31.6 ± 2.5d | |
| Leg power (W) | 216 ± 45a | 156 ± 44bc | 174 ± 25b | 163 ± 28b | 152 ± 22bc | 129 ± 19c | |
| Physical activity | Min / week | 259 ± 196 (n = 11)a | 273 ± 196 (n = 4)a | ND | 218 ± 88 (n = 7)a | ND | ND |
| METs / 24 h | ND | 1.73 ± 0.15 (n = 3)a | 1.27 ± 0.11 (n = 7)b | 1.95 ± 0.21 (n = 2) a | 1.35 ± 0.15 (n = 14)b | 1.37 ± 0.19 (n = 7)b | |
| Steps / day | ND | 12 982 ± 3805 (n = 3)a | 7057 ± 2074 (n = 7)b | 12 557 ± 3108 (n = 2)a | 6378 ± 1537 (n = 14)b | 7294 ± 2598 (n = 7)b | |
Groups that do not share the same letter are significantly different from one another. ND, not determined. METs, metabolic equivalent.
Effects of ageing, physical activity, and pre‐frailty on skeletal muscle phenotype
We first investigated the effects of ageing, physical activity, and pre‐frailty on skeletal muscle fibre sizes. To this end, vastus lateralis muscle cross sections were immunolabelled for the three MHC found in human skeletal muscles and laminin to identify fibre borders ( Figure S2). Only 65 + SED and 65 + PF displayed significantly lower overall size vs. YA. No difference in type I fibre size was observed (Figure 1B). 65 + SED and 65 + PF displayed significantly lower type IIa size vs. YA (Figure 1C). No difference was observed for type IIx and I/IIa fibre sizes amongst groups (Figure 1D, E). 65 + PF showed lower type IIa/IIx fibre size vs. YA (Figure 1F). When all subjects were pooled together and the relationship between the all fibre type sizes and age was investigated, only type IIa fibres negatively correlated with age (Figure 1G).
Figure 1.
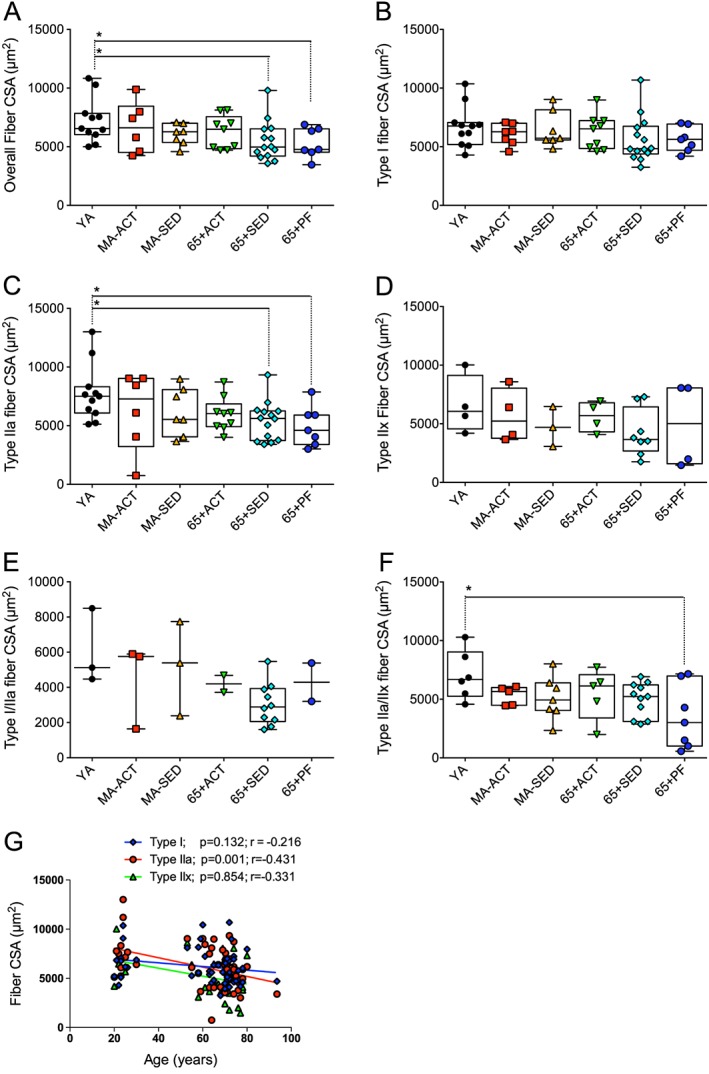
Effects of ageing, physical activity, and pre‐frailty on skeletal muscle fibre size. (A to F) Quantifications of the overall (A), type I (B), IIa (C), IIx (D), I/IIa (E), and IIa/IIx (F) fibre cross‐sectional area (CSA) of the vastus lateralis muscle of young adult (YA), active (Act), and sedentary (SED) middle‐aged (MA‐ACT and MA‐SED) and old (65 + yo; 65 + ACT and 65 + SED) and pre‐frail old (65 + PF) men. (G) Relationship between type I, IIa, and IIx fibre size area and the age of all of the participants. (A to F) present individual data as well as box and whisker plots. *p < 0.05 and q < 0.20.
We then investigated the effects of ageing, physical activity, and pre‐frailty on skeletal muscle fibre type composition. As can be seen in Figure 2, no difference in the type I, IIx, and I/IIa fibre proportions was observed between groups. 65 + SED displayed a lower type IIa fibre proportion vs. YA (Figure 2B). MA‐SED and 65 + SED displayed higher type IIa/IIx fibre proportions vs. YA (Figure 2E). When type I/IIa and IIa/IIx fibres were pooled together (all hybrid fibre types), MA‐SED and 65 + SED displayed a higher proportion of hybrid fibres vs. YA and 65 + ACT (Figure 2F).
Figure 2.
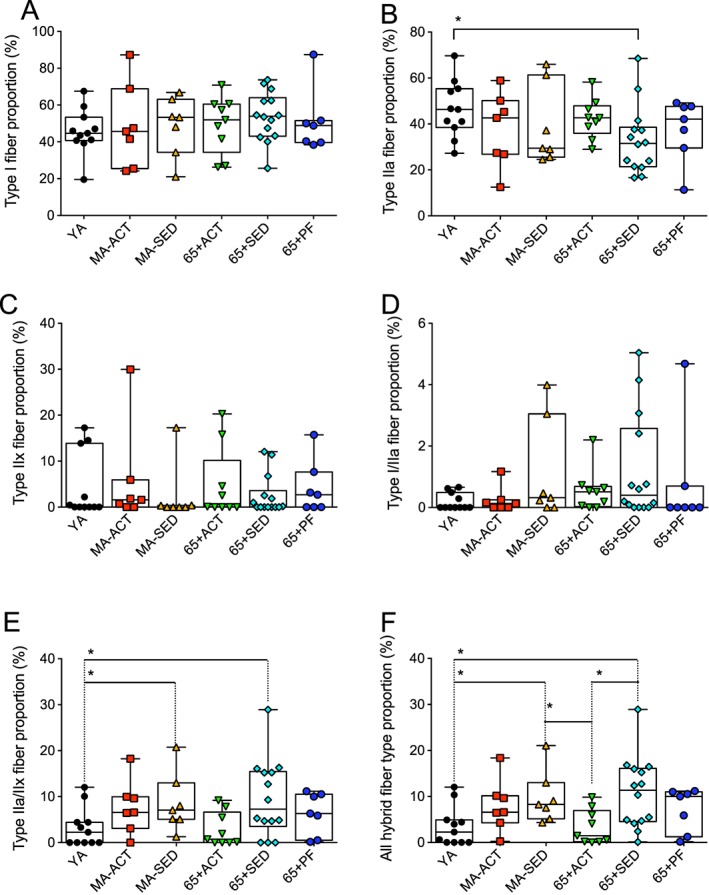
Effects of ageing, physical activity, and pre‐frailty on skeletal muscle fibre type proportion. (A to F) Quantifications of the proportion of type I (A), IIa (B), IIx (C), I/IIa (D), IIa/IIx (E), and I/IIa + IIa/IIx (all hybrid fibre types) fibre of the vastus lateralis muscle of young adult (YA), active (ACT), and sedentary (SED) middle‐aged (MA‐ACT and MA‐SED) and old (65 + yo; 65 + Act and 65 + SED) and pre‐frail old (65 + PF) men. (A to F) present individual data as well as box and whisker plots. *p < 0.05 and q < 0.20.
Effects of ageing, physical activity, and pre‐frailty on the overall and fibre type specific mitochondrial content
To assess the overall and fibre type specific mitochondrial content, vastus lateralis muscle serial cross sections to the triple MHC labelling were stained for succinate dehydrogenase (SDH/complex II of the mitochondrial electron transfer system, a reliable marker of mitochondrial content29, 46) ( Figure S2). In all groups, type I fibre had the highest mitochondrial content (highest SDH stain intensity), followed by type IIa fibres and type IIx fibres (Figure 3). MA‐SED, 65 + Sed, and 65 + PF displayed significantly lower mitochondrial content vs. YA and MA‐ACT (Figure 3A). 65 + Sed and 65 + PF also displayed significantly lower mitochondrial content vs. 65 + ACT. No difference in the overall mitochondrial content was observed between YA, MA‐ACT, and 65 + ACT (Figure 3A).
Figure 3.
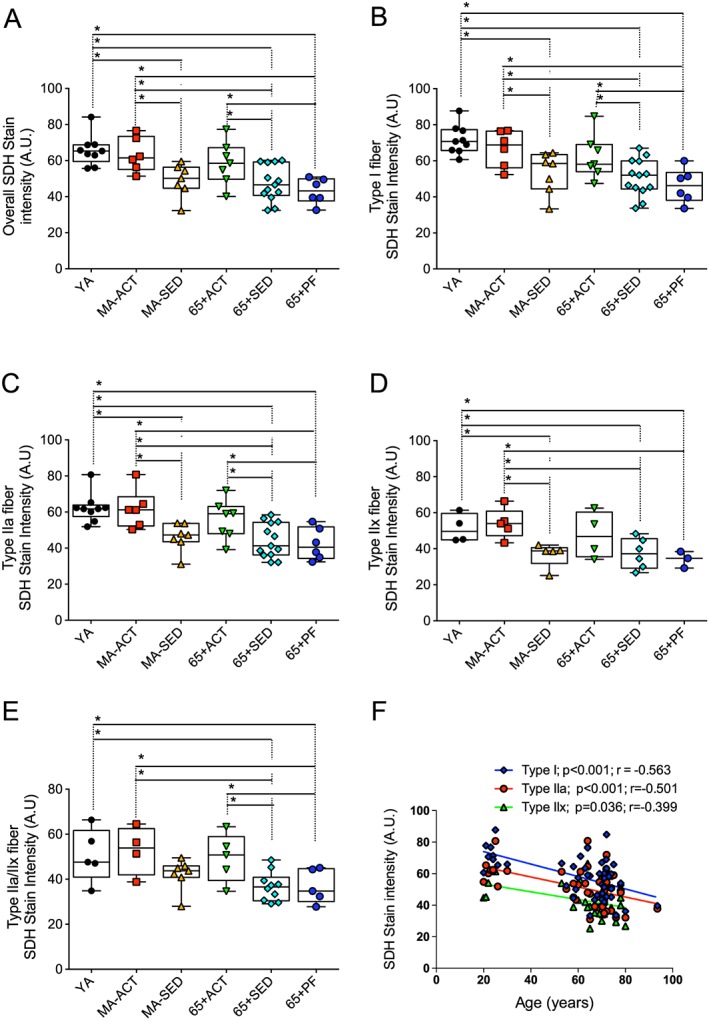
Effects of ageing, physical activity, and pre‐frailty on the overall and fibre type specific mitochondrial content. (A to E) Quantifications of the overall (A), type I (B), IIa (C), IIx (D), IIa/IIx (E), succinate dehydrogenase (SDH) stain intensity of the vastus lateralis muscle of young adult (YA), active (ACT), and sedentary (SED) middle‐aged (MA‐Act and MA‐SED) and old (65 + yo; 65 + ACT and 65 + SED) and pre‐frail old (65 + PF) men. (F) Relationship between the mitochondrial content of type I, IIa, and IIx fibres and the age of all of our participants. (A to D) present individual data as well as box and whisker plots. *p < 0.05 and q < 0.20.
Figure 3B summarizes the results for mitochondrial content in type I fibres. MA‐SED, 65 + SED, and 65 + PF displayed significantly lower mitochondrial content in type I fibres vs. YA and MA‐ACT (Figure 3B). 65 + SED and 65 + PF also displayed significantly lower mitochondrial content vs. 65 + ACT. No significant difference in the type I fibre mitochondrial content was observed between YA, MA‐ACT, and 65 + ACT (Figure 3B).
MA‐SED, 65 + SED, and 65 + PF displayed significantly lower type IIa mitochondrial content vs. YA and MA‐ACT (Figure 3C). 65 + SED and 65 + PF also displayed significantly lower type IIa mitochondrial content vs. 65 + ACT. No difference in the type IIa mitochondrial content was observed between YA, MA‐ACT, and 65 + ACT (Figure 3C).
No difference in the IIx fibre mitochondrial content was observed between YA, MA‐ACT, and 65 + ACT (Figure 3D). MA‐SED, 65 + SED, and 65 + PF displayed significantly lower type IIx mitochondrial content vs. YA and MA‐ACT (Figure 3D).
Because of the low proportion of type I/IIa hybrid fibre (Figure 2D) we could not analyze enough of these hybrid fibres to accurately quantify the SDH stain intensity for these hybrid fibres. 65 + SED and 65 + PF displayed significantly lower type IIa/IIx mitochondrial content vs. YA, MA‐ACT and 65 + ACT (Figure 3E).
The fibre type specific SDH stain intensity negatively correlated with age within each fibre type (Figure 3F).
Effects of ageing, physical activity, and pre‐frailty on the overall and fibre type specific intramyocellular lipid content
To assess the overall and fibre type specific intramyocellular lipid content, VL muscle serial cross sections were incubated with Oil Red O ( Figure S2). In all groups, type I fibre had the highest lipid content (highest Oil red O stain intensity), followed by type IIa and type IIx fibres (Figure 4).
Figure 4.
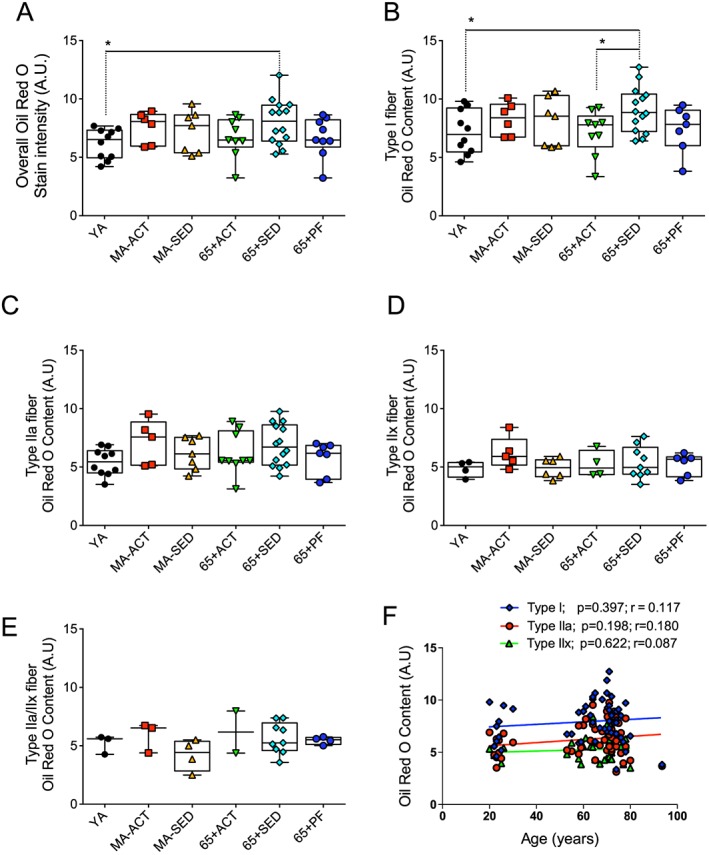
Effects of ageing, physical activity, and pre‐frailty on the overall and fibre type specific lipid content. (A to E) Quantifications of the overall (A), type I (B), IIa (C), IIx (D), IIa/IIx (E), Oil Red O stain intensity of the vastus lateralis muscle of young adult (YA), active (ACT), and sedentary (SED) middle‐aged (MA‐ACT and MA‐SED) and old (65 + yo; 65 + ACT and 65 + SED) and pre‐frail old (65 + PF) men. (F) Relationship between the lipid content of type I, IIa, and IIx fibres and the age of all of our participants. (A to D) present individual data as well as box and whisker plots. *p < 0.05 and q < 0.20.
As can be seen in Figure 4A, only 65+ SED displayed higher intramyocellular lipid content vs. YA. No other difference in overall intramyocellular lipid content was observed.
65 + SED showed a significantly higher type I fibre lipid content vs. YA and 65 + ACT (Figure 4B). No other difference in type I intramyocellular lipid content was observed (Figure 4B). No differences in the type IIa, IIx, and IIa/IIx fibre lipid content were observed (Figure 4C–E).
No significant correlation between age and the lipid content of type I, IIa, and IIx fibre was observed when data from all subjects were analysed together (Figure 4F).
Relationships between mitochondrial content and parameters related to muscle function, functional capacity, and insulin sensitivity
Skeletal muscle mitochondrial content was positively correlated with multiple parameters of muscle function and functional capacity (Figure 5). Muscle mitochondrial content was positively correlated with the lean mass of the thigh and the stair test results, whereas it was negatively correlated with leg fat mass and the results of the chair test, the sit to stand test, and the timed up and go test (Figure 5). We also found trends for positive correlation between skeletal muscle mitochondrial content and the overall fibre cross‐sectional area as well as leg power (Figure 5). No significant association between mitochondrial content and lipid content was observed. Because we quantified the HOMA‐IR (an index of insulin resistance) and QUICK‐I (an index of insulin sensitivity) for most subjects (with exception of YA and most of the 65 + ACT individuals), we were able to investigate the relationship between mitochondrial content and parameters of insulin sensitivity. Mitochondrial content was positively associated with the QUICK‐I index (Figure 5). A trend (p = 0.051) for a negative correlation between the overall mitochondrial content and the HOMA‐IR, a widely used index of insulin resistance, was also observed. Note that one outlier for HOMA‐IR was removed from the original data set and the graph (largely over 2 standard deviation away from the mean – the Pearson correlation coefficient with the outlier was −0.3131 and the p‐value was p = 0.081).
Figure 5.

Relationships between the overall mitochondrial content (SDH stain intensity) and indices of muscle function, functional capacities, and insulin sensitivity.
Relationships between intramyocellular lipid content and parameters related to muscle function, functional capacity, and insulin sensitivity
No significant correlation was observed between lipid content and parameters related to muscle function (thigh lean mass, overall fibre cross‐sectional area, lower limb fat mass and leg power), functional capacity (chair test, timed up and go and stair test), and insulin sensitivity (HOMA‐IR and QUICK‐I) ( Figure S3).
Discussion
Many controversies surround the impact of ageing on skeletal muscle phenotype and mitochondrial and intramyocellular lipid content. The fact that physical activity, well known to impact virtually all aspects of skeletal muscle physiology, is rarely taken into account most certainly contributes to the discrepancies in the field. In addition, whether ageing affects mitochondrial and intramyocellular lipid content in a fibre type‐specific manner remains largely unexplored. Therefore, the overall aim of the present study was to investigate the effects of ageing, physical activity, and pre‐frailty on skeletal muscle phenotype, and mitochondrial and intramyocellular lipid content in men.
Impact of ageing, physical activity, and pre‐frailty on skeletal muscle phenotype
In the present study, very few differences in fibre type proportions were observed amongst groups (Figure 2). While no difference was observed for the proportion of type I and IIx fibres, only sedentary men aged over 65 y displayed higher type IIa and IIa/IIx fibre proportions as compared with YA. Associated with the fact that MA‐SED individuals also had a higher type IIa/IIx proportion as compared with YA, and that neither MA‐SED nor 65 + SED showed a decrease in type IIx fibres, this result suggests that type IIa fibres might transition to IIx with ageing in sedentary individuals. The fact that these differences were not observed in 65 + ACT suggests that physical activity might protect type IIa fibres. The higher total hybrid fibre proportion observed in 65 + SED and MA‐SED vs. YA indicates that ageing in sedentary men is associated with muscle remodelling, probably caused by denervation re‐innervation cycles.4 These results are in line with previous work from Klitgaard et al.,50 who have shown an increase in the proportion of hybrid fibres in aged human skeletal muscle, and the work from Andersen who has reported that sedentary octogenarians display a very high abundance of hybrids fibres,24 an observation recently corroborated by Power et al. for type IIa/IIx hybrid fibres.51 In their manuscript, Power et al. also reported that this very high abundance of hybrids fibres was not observed in octogenarian master athletes. When put in perspective with our current findings, one can speculate that muscle remodelling starts early in the sixth decade, perhaps even earlier (as suggested by higher hybrid fibre proportion in our MA‐SED group), resulting in significant increases in hybrid fibre abundance in the eighth decade as evidenced in24 and51. Our results and those described in51 also suggest that physical activity partly protects from the age‐related muscle remodelling seen in sedentary individuals, a view consistent with the work from Trappe et al. who showed that a 12 week resistance training programme decreased the proportion of hybrid fibres seen in septuagenarians.52 Surprisingly, no significant difference in fibre‐type proportion was observed for 65 + PF individuals in the present study, suggesting that there is no specific impact of pre‐frailty on muscle fibre‐type proportion.
In the present study, significant myofibre atrophy was only observed in 65 + SED and 65 + PF individuals. Indeed, both 65 + SED and 65 + PF display a significant decrease in the overall and type IIa fibre cross‐sectional area vs. YA. 65 + PF also exhibited lower IIa/IIx fibre cross‐sectional area. These results, in association with the significant negative correlation between type IIa fibre size and age observed when all subjects were pooled together (Figure 1G), are again in line with the idea that type IIa fibres are particularly affected by ageing in sedentary individuals and that physical activity seems to confer some protection against the effects of ageing on type IIa fibres. Interestingly, it was recently shown in rat skeletal muscles that type I fibres exhibit marked atrophy with advanced age and might therefore be affected at a later stage than type II fibres are.20, 53 With this in mind, and the trend for lower type I fibre size in 65 + SED vs. YA we (5,618 ± 1,064 vs. 6,710 ± 1,747 µm2, respectively; p = 0.095, Figure 1B) could indicate that type I fibre atrophy might start in the late sixth decade or early seventh decade, a view consistent with the 25% atrophy of type I fibres seen in octogenarians.24
Impact of ageing on skeletal muscle mitochondrial content and its relationships with parameters related to muscle function, functional capacities, and insulin sensitivity
Many controversies surround the impact of skeletal muscle ageing on mitochondrial content, with some studies showing reduced mitochondrial content in aged skeletal muscle25, 26, 27, 28, 54 and others reporting no effect of ageing.15, 29, 30 Here, we provide strong evidence indicating that mitochondrial content only declines in sedentary individuals and is preserved in active individuals (Figure 3). Our results also highlight that mitochondrial content declines in all fibre types in older sedentary individuals. Our results therefore reinforce previous studies that have shown, using various markers, unchanged mitochondrial content in skeletal muscles of active older individuals.15, 55, 56 Finally, there was no evidence for aggravated loss of mitochondrial content in pre‐frail individuals.
While our data clearly indicate that physical activity can preserve mitochondrial content in aged skeletal muscle, it is important to note that strong evidence suggests that physical activity is not a cure‐all and does not protect from the impact of muscle ageing on all aspects of mitochondrial biology. For instance, we recently showed that even old active men displayed mild uncoupling of mitochondrial oxidative phosphorylation and increased mitochondrial‐mediated apoptosis,15 therefore strengthening the view that mitochondrial uncoupling57, 58, 59 and increased mitochondrial‐mediated apoptosis26, 60, 61 are intrinsic processes of the muscle ageing process and not a consequence of a prolonged sedentary lifestyle. Whether physical activity protects from the impacts of ageing on mitochondrial energetics,54, 62 dynamics, and morphology29, 63 remains to be clarified.
Importantly, our results show that mitochondrial content was positively associated with clinically relevant markers of skeletal muscle function, functional capacity, and insulin sensitivity. Our study extends previous work showing that mitochondrial respiratory capacity and efficiency energetics were associated with walking speed in older adults.64 Our data also strengthen recent evidence indicating a positive association between mitochondrial content and insulin sensitivity in older individuals.65 Taken altogether, these results clearly emphasize the importance of mitochondria for skeletal muscle health and reinforce the view that mitochondria should be considered as important therapeutic targets to prevent or attenuate age‐related deterioration of muscle function and metabolism.
Although muscle mitochondrial content was negatively associated with thigh fat mass, consistent with recent data,65 no correlation between mitochondrial content and intramyocellular lipid content was observed in the present study (Figure 5). These results therefore suggest a potential negative association between muscle mitochondrial content and extracellular fat accumulation (perhaps between fibre fascicules or between muscles). The relationship between mitochondrial content, intramyocellular, and extracellular lipid content unquestionably deserves further attention.
Impact of ageing on intramyocellular lipid content and its relationships with parameters related to muscle function, functional capacities, and insulin sensitivity
There is evidence supporting the fact that ageing is associated with an intramyocellular accumulation of lipids.27, 31, 33 Lipid accumulation in skeletal muscles has been linked with lower whole muscle and single fibre power,66, 67 lower isokinetic and specific torque,38 slower walking speed and chair stand time68 and higher risk of mobility limitation.69 In addition, intramyocellular accumulation of lipids has been suggested to contribute to the age‐related deterioration of skeletal muscle function70, 71 and has been linked to the development of insulin resistance.32
Given this literature, it is critical to clearly define the effects of ageing and physical activity on intramyocellular lipid content and its impact on muscle function and insulin sensitivity. Our results indicate that only sedentary old men, but not active old men, displayed higher intramyocellular lipid content compared with young individuals, particularly in type I fibres. These results therefore strengthen the available evidence pointing towards an increase in lipid content in skeletal muscle cells27, 31, 33 and strongly suggest that physical activity protects from the intramyocellular accumulation of lipids with ageing. Interestingly, no sign of elevated intramyocellular lipid content was seen in pre‐frail individuals suggesting that pre‐frailty is not associated with excessive lipid infiltration in skeletal muscles.
As mentioned, excessive fat accumulation in skeletal muscle cells has been linked to poor skeletal muscle function and the development of insulin resistance. We therefore hypothesized that intramyocellular lipid content would be negatively associated with indices of skeletal muscle function and insulin sensitivity. Surprisingly, no significant correlation was observed between intramyocellular lipid content and clinically relevant markers of muscle function/functional capacity and insulin sensitivity ( Figure S3). These results challenge the idea that intramyocellular lipid accumulation plays an important role in the age‐related decline of skeletal muscle function and insulin sensitivity. However, it is important to note that at the exception of three subjects with HOMA‐IR above 2.5 (i.e. cut‐off to be considered insulin resistant,72 two 65 + PF with HOMA‐IR of 5.84 and 2.55; and one 65 + SED with HOMA‐IR of 2.67), all other participants were insulin sensitive. The fact that the vast majority of our subjects were insulin sensitive perhaps explains the absence of a relationship between intramyocellular lipid content and markers of insulin sensitivity and muscle. Rather, these relationships might therefore prove valid in obese and metabolically deteriorated individuals as suggested by available evidence.33, 67 In addition, it is important to note that Oil Red O mainly stains lipid droplets. It is therefore possible that the concentrations of specific lipid derivatives, especially those of lipid species known to interfere with the insulin signalling pathways such as ceramides and diacylglycerol,73 might correlate with markers of skeletal muscle function, functional capacity, and insulin sensitivity. Further research is therefore needed to clarify the exact role played by lipid accumulation on the muscle ageing process.
Study limitations
In the present study, the overall and fibre type specific mitochondrial content were assessed in vastus lateralis muscle by staining muscle cross sections for succinate dehydrogenase (SDH / complex II of the mitochondrial electron transfer system). Although previous studies have shown that this semi‐quantitative approach provides a reliable assessment of mitochondrial content,29, 46 further studies should confirm our results using quantitative approaches, such as the determination of mitochondrial density on transmission electron micrographs (the gold standard for mitochondrial content assessment).
The accurate measurement of fibre cross‐sectional area requires muscle fibres to be fixated in resting length (L0) and cut at an exact 90° angle. Although all possible care was taken during the processing and analysis of skeletal muscle biopsies, none of these conditions can be perfectly achieved with human muscle biopsies. It is therefore possible that some variability in the cross‐sectional area we report in the present study may arise from these limitations.
The present study design required the recruitment of elderly volunteers willing to participate in a research study and undergo a skeletal muscle biopsy. It is therefore possible that our design might have induced a sample bias with the recruitment of fitter / and or more socially active elderly than the average population. Although such bias cannot be avoided, it is still important to keep it in mind when attempting to extrapolate our results to the general population.
Although no specific muscle phenotype of pre‐frailty could be evidenced in the present study, it is important to highlight that the sample size of our 65 + PF group was relatively small, which might have resulted in a non‐negligible number of false negatives in our statistical analyses. Further studies with larger sample sizes are therefore required to definitively conclude on the absence of specific muscle alterations in pre‐frail individuals.
Conclusions
Taken together, our results suggest that ageing in sedentary men is associated with (i) complex changes in muscle phenotype (fibre type and size) preferentially affecting type IIa fibres; (ii) a decline in mitochondrial content affecting all fibre types; and (iii) an increase in lipid content in type I fibres. These results also suggest that physical activity partially protects from the effects of ageing on muscle phenotype, mitochondrial content, and lipid accumulation. No skeletal muscle phenotype of pre‐frailty was seen in the present study. Finally, we showed that mitochondrial content, but not lipid content, was positively correlated with clinically relevant markers of muscle function, functional capacities, and insulin sensitivity. Our results therefore strongly support the idea that mitochondria may represent effective therapeutic targets to attenuate the ageing‐related deterioration of skeletal muscle.
Conflicts of interest
The authors have no conflict of interest to declare.
Supporting information
Figure S1. Range of weekly physical activity performed by the participants in the young adult group
Figure S2. Explanation of the experimental design used to assess skeletal muscle phenotype, mitochondrial content, and intramyocellular lipid content. Series of skeletal muscle cross sections were obtained. The first cross section was immunolabelled for myosin heavy chain (MHC) type I (in blue), type IIa (in red), IIx (in green), and laminin (in green surrounding each muscle fibre). This first stain was used to assess fibre size and type proportion. The second cross section was stained for succinate dehydrogenase activity, a reliable marker of mitochondrial content. Intramyocellular lipid content was assessed on the third cross section using an Oil Red O stain. Note that the same fibres are found within all three stains as indicated by the white arrows.
Figure S3: Relationships between the overall intramyocellular lipid (Oil Red O stain intensity) content and indices of related to muscle function, functional capacities, and insulin sensitivity.
Supporting info item
Supporting info item
Supporting info item
Acknowledgements
We thank all the subjects who participated in this study. We are also grateful to Ms Carole Roy for her technical support. The authors certify that they comply with the ethical guidelines for publishing in the Journal of Cachexia, Sarcopenia and Muscle: update 2015.74 Operating funds were provided for this project from the Canadian Institutes of Health Research (CIHR; MOP125986 and MOP119583 to R.T.H.), two pilot grants from the Quebec Network for Research on Aging (first pilot grant to M.A.‐L. and R.T.H., second pilot grant to M.A.‐L., R.T.H., M.B., P.G., S.C. J.A.M. and GG.), the FRQS (#26706 to MAL) and from the Natural Sciences and Engineering Research Council (NSERC) of Canada (RGPIN2014‐04668 to GG). R.T.H. and M.A.‐L were also supported by Leaders Opportunity Funds from the Canadian Foundation for Innovation. R.T.H. and M.A.‐L were also supported by Chercheurs Boursiers Senior Award and Chercheur Boursier Junior 1 award from the Fonds de Recherche du Québec–Santé respectively. FSJP was supported by a fellowship from NSERC and JPLG and SBA were supported by CIHR fellowships.
St‐Jean‐Pelletier, F. , Pion, C. H. , Leduc‐Gaudet, J.‐P. , Sgarioto, N. , Zovilé, I. , Barbat‐Artigas, S. , Reynaud, O. , Alkaterji, F. , Lemieux, F. C. , Grenon, A. , Gaudreau, P. , Hepple, R. T. , Chevalier, S. , Belanger, M. , Morais, J. A. , Aubertin‐Leheudre, M. , and Gouspillou, G. (2017) The impact of ageing, physical activity, and pre‐frailty on skeletal muscle phenotype, mitochondrial content, and intramyocellular lipids in men. Journal of Cachexia, Sarcopenia and Muscle, 8: 213–228. doi: 10.1002/jcsm.12139.
References
- 1. Janssen I, Heymsfield SB, Ross R. Low relative skeletal muscle mass (sarcopenia) in older persons is associated with functional impairment and physical disability. J Am Geriatr Soc 2002;50:889–896. [DOI] [PubMed] [Google Scholar]
- 2. Rosenberg IH. Sarcopenia: origins and clinical relevance. J Nutr 1997;127:990S–991S. [DOI] [PubMed] [Google Scholar]
- 3. Barbat‐Artigas S, Rolland Y, Cesari M, Abellan van Kan G, Vellas B, Aubertin‐Leheudre M. Clinical relevance of different muscle strength indexes and functional impairment in women aged 75 years and older. J Gerontol A Biol Sci Med Sci 2013;68:811–819. [DOI] [PubMed] [Google Scholar]
- 4. Gouspillou G, Picard M, Godin R, Burelle Y, Hepple RT. Role of peroxisome proliferator‐activated receptor gamma coactivator 1‐alpha (PGC‐1alpha) in denervation‐induced atrophy in aged muscle: facts and hypotheses. Longev & healthspan 2013;2:13. [DOI] [PMC free article] [PubMed] [Google Scholar]
- 5. Eddinger TJ, Moss RL, Cassens RG. Fiber number and type composition in extensor digitorum longus, soleus, and diaphragm muscles with aging in Fisher 344 rats. J Histochem and Cytochem official J Histochem Society 1985;33:1033–1041. [DOI] [PubMed] [Google Scholar]
- 6. Klitgaard H, Brunet A, Maton B, Lamaziere C, Lesty C, Monod H. Morphological and biochemical changes in old rat muscles: effect of increased use. J Appl Physiol 1985. 1989;67:1409–1417. [DOI] [PubMed] [Google Scholar]
- 7. Ansved T, Larsson L. Effects of ageing on enzyme—histochemical, morphometrical and contractile properties of the soleus muscle in the rat. J Neurol Sci 1989;93:105–124. [DOI] [PubMed] [Google Scholar]
- 8. Florini JR, Ewton DZ. Skeletal muscle fiber types and myosin ATPase activity do not change with age or growth hormone administration. J Gerontol 1989;44:B110–B117. [DOI] [PubMed] [Google Scholar]
- 9. Brown M, Hasser EM. Complexity of age‐related change in skeletal muscle. J Gerontol A Biol Sci Med Sci 1996;51:B117–B123. [DOI] [PubMed] [Google Scholar]
- 10. Caccia MR, Harris JB, Johnson MA. Morphology and physiology of skeletal muscle in aging rodents. Muscle Nerve 1979;2:202–212. [DOI] [PubMed] [Google Scholar]
- 11. Larsson L, Grimby G, Karlsson J. Muscle strength and speed of movement in relation to age and muscle morphology. J appl physiol Respir Environ Exerc Physiol 1979;46:451–456. [DOI] [PubMed] [Google Scholar]
- 12. Larsson L, Sjodin B, Karlsson J. Histochemical and biochemical changes in human skeletal muscle with age in sedentary males, age 22–65 years. Acta Physiol Scand 1978;103:31–39. [DOI] [PubMed] [Google Scholar]
- 13. Lexell J, Taylor CC, Sjostrom M. What is the cause of the ageing atrophy? Total number, size and proportion of different fiber types studied in whole vastus lateralis muscle from 15‐ to 83‐year‐old men. J Neurol Sci 1988;84:275–294. [DOI] [PubMed] [Google Scholar]
- 14. Aniansson A, Grimby G, Hedberg M. Compensatory muscle fiber hypertrophy in elderly men. J Appl Physiol 1985. 1992;73:812–816. [DOI] [PubMed] [Google Scholar]
- 15. Gouspillou G, Sgarioto N, Kapchinsky S, Purves‐Smith F, Norris B, Pion CH, et al Increased sensitivity to mitochondrial permeability transition and myonuclear translocation of endonuclease G in atrophied muscle of physically active older humans. FASEB J official publication of the Fed of Am Soc for Exp Biol 2014;28:1621–1633. [DOI] [PubMed] [Google Scholar]
- 16. Coggan AR, Spina RJ, King DS, Rogers MA, Brown M, Nemeth PM, et al Histochemical and enzymatic comparison of the gastrocnemius muscle of young and elderly men and women. J Gerontol 1992;47:B71–B76. [DOI] [PubMed] [Google Scholar]
- 17. Frontera WR, Hughes VA, Fielding RA, Fiatarone MA, Evans WJ, Roubenoff R. Aging of skeletal muscle: a 12‐yr longitudinal study. J Appl Physiol 1985. 2000;88:1321–1326. [DOI] [PubMed] [Google Scholar]
- 18. Nilwik R, Snijders T, Leenders M, Groen BB, van Kranenburg J, Verdijk LB, et al The decline in skeletal muscle mass with aging is mainly attributed to a reduction in type II muscle fiber size. Exp Gerontol 2013;48:492–498. [DOI] [PubMed] [Google Scholar]
- 19. Purves‐Smith FM, Solbak NM, Rowan SL, Hepple RT. Severe atrophy of slow myofibers in aging muscle is concealed by myosin heavy chain co‐expression. Exp Gerontol 2012;47:913–918. [DOI] [PubMed] [Google Scholar]
- 20. Purves‐Smith FM, Sgarioto N, Hepple RT. Fiber typing in aging muscle. Exerc Sport Sci Rev 2014;42:45–52. [DOI] [PubMed] [Google Scholar]
- 21. Carter EE, Thomas MM, Murynka T, Rowan SL, Wright KJ, Huba E, et al Slow twitch soleus muscle is not protected from sarcopenia in senescent rats. Exp Gerontol 2010;45:662–670. [DOI] [PubMed] [Google Scholar]
- 22. Thompson LV, Brown M. Age‐related changes in contractile properties of single skeletal fibers from the soleus muscle. J Appl Physiol 1985. 1999;86:881–886. [DOI] [PubMed] [Google Scholar]
- 23. D'Antona G, Pellegrino MA, Adami R, Rossi R, Carlizzi CN, Canepari M, et al The effect of ageing and immobilization on structure and function of human skeletal muscle fibres. J Physiol 2003;552:499–511. [DOI] [PMC free article] [PubMed] [Google Scholar]
- 24. Andersen JL. Muscle fibre type adaptation in the elderly human muscle. Scand J Med Sci Sports 2003;13:40–47. [DOI] [PubMed] [Google Scholar]
- 25. Conley KE, Jubrias SA, Esselman PC. Oxidative capacity and ageing in human muscle. J Physiol 2000;526:203–210. [DOI] [PMC free article] [PubMed] [Google Scholar]
- 26. Chabi B, Ljubicic V, Menzies KJ, Huang JH, Saleem A, Hood DA. Mitochondrial function and apoptotic susceptibility in aging skeletal muscle. Aging Cell 2008;7:2–12. [DOI] [PubMed] [Google Scholar]
- 27. Crane JD, Devries MC, Safdar A, Hamadeh MJ, Tarnopolsky MA. The effect of aging on human skeletal muscle mitochondrial and intramyocellular lipid ultrastructure. J Gerontol A Biol Sci Med Sci 2010;65:119–128. [DOI] [PubMed] [Google Scholar]
- 28. Lanza IR, Nair KS. Muscle mitochondrial changes with aging and exercise. Am J Clin Nutr 2009;89:467S–471S. [DOI] [PMC free article] [PubMed] [Google Scholar]
- 29. Leduc‐Gaudet JP, Picard M, Pelletier FS, Sgarioto N, Auger MJ, Vallee J, et al Mitochondrial morphology is altered in atrophied skeletal muscle of aged mice. Oncotarget 2015;6:17923–17937. [DOI] [PMC free article] [PubMed] [Google Scholar]
- 30. Russ DW, Kent‐Braun JA. Is skeletal muscle oxidative capacity decreased in old age? Sports Med 2004;34:221–229. [DOI] [PubMed] [Google Scholar]
- 31. Zhao L, Zou X, Feng Z, Luo C, Liu J, Li H, et al Evidence for association of mitochondrial metabolism alteration with lipid accumulation in aging rats. Exp Gerontol 2014;56:3–12. [DOI] [PubMed] [Google Scholar]
- 32. Goodpaster BH. Mitochondrial deficiency is associated with insulin resistance. Diabetes 2013;62:1032–1035. [DOI] [PMC free article] [PubMed] [Google Scholar]
- 33. Gueugneau M, Coudy‐Gandilhon C, Theron L, Meunier B, Barboiron C, Combaret L, et al Skeletal muscle lipid content and oxidative activity in relation to muscle fiber type in aging and metabolic syndrome. J Gerontol A Biol Sci Med Sci 2015;70:566–576. [DOI] [PubMed] [Google Scholar]
- 34. Simoneau JA, Lortie G, Boulay MR, Marcotte M, Thibault MC, Bouchard C. Human skeletal muscle fiber type alteration with high‐intensity intermittent training. Eur J Appl Physiol Occup Physiol 1985;54:250–253. [DOI] [PubMed] [Google Scholar]
- 35. Andersen P, Henriksson J. Capillary supply of the quadriceps femoris muscle of man: adaptive response to exercise. J Physiol 1977;270:677–690. [DOI] [PMC free article] [PubMed] [Google Scholar]
- 36. Kadi F, Thornell LE. Training affects myosin heavy chain phenotype in the trapezius muscle of women. Histochem Cell Biol 1999;112:73–78. [DOI] [PubMed] [Google Scholar]
- 37. Dube JJ, Amati F, Stefanovic‐Racic M, Toledo FG, Sauers SE, Goodpaster BH. Exercise‐induced alterations in intramyocellular lipids and insulin resistance: the athlete's paradox revisited. Am J Physiol Endocrinol Metab 2008;294:E882–E888. [DOI] [PMC free article] [PubMed] [Google Scholar]
- 38. Goodpaster BH, He J, Watkins S, Kelley DE. Skeletal muscle lipid content and insulin resistance: evidence for a paradox in endurance‐trained athletes. J Clin Endocrinol Metab 2001;86:5755–5761. [DOI] [PubMed] [Google Scholar]
- 39. Holloszy JO. Biochemical adaptations in muscle. Effects of exercise on mitochondrial oxygen uptake and respiratory enzyme activity in skeletal muscle. J Biol Chem 1967;242:2278–2282. [PubMed] [Google Scholar]
- 40. Kojima G. Frailty as a predictor of future falls among community‐dwelling older people: a systematic review and meta‐analysis. J Am Med Dir Assoc 2015;16:1027–1033. [DOI] [PubMed] [Google Scholar]
- 41. Taylor HL, Jacobs DR Jr, Schucker B, Knudsen J, Leon AS, Debacker G. A questionnaire for the assessment of leisure time physical activities. J Chronic Dis 1978;31:741–755. [DOI] [PubMed] [Google Scholar]
- 42. Washburn RA, McAuley E, Katula J, Mihalko SL, Boileau RA. The physical activity scale for the elderly (PASE): evidence for validity. J Clin Epidemiol 1999;52:643–651. [DOI] [PubMed] [Google Scholar]
- 43. Garber CE, Blissmer B, Deschenes MR, Franklin BA, Lamonte MJ, Lee IM, et al American College of Sports Medicine position stand. Quantity and quality of exercise for developing and maintaining cardiorespiratory, musculoskeletal, and neuromotor fitness in apparently healthy adults: guidance for prescribing exercise. Med Sci Sports Exerc 2011;43:1334–1359. [DOI] [PubMed] [Google Scholar]
- 44. Di Pietro L, Dziura J, Blair SN. Estimated change in physical activity level (PAL) and prediction of 5‐year weight change in men: the Aerobics Center Longitudinal Study. Int J Obes Relat Metab Disord 2004;28:1541–1547. [DOI] [PubMed] [Google Scholar]
- 45. Fried LP, Tangen CM, Walston J, Newman AB, Hirsch C, Gottdiener J, et al Frailty in older adults: evidence for a phenotype. J Gerontol A Biol Sci Med Sci 2001;56:M146–M156. [DOI] [PubMed] [Google Scholar]
- 46. Gouspillou G, Sgarioto N, Norris B, Barbat‐Artigas S, Aubertin‐Leheudre M, Morais JA, et al The relationship between muscle fiber type‐specific PGC‐1alpha content and mitochondrial content varies between rodent models and humans. PLoS One 2014;9:e103044. [DOI] [PMC free article] [PubMed] [Google Scholar]
- 47. Guralnik JM, Simonsick EM, Ferrucci L, Glynn RJ, Berkman LF, Blazer DG, et al A short physical performance battery assessing lower extremity function: association with self‐reported disability and prediction of mortality and nursing home admission. J Gerontol 1994;49:M85–M94. [DOI] [PubMed] [Google Scholar]
- 48. Takai Y, Ohta M, Akagi R, Kanehisa H, Kawakami Y, Fukunaga T. Sit‐to‐stand test to evaluate knee extensor muscle size and strength in the elderly: a novel approach. J Physiol Anthropol 2009;28:123–128. [DOI] [PubMed] [Google Scholar]
- 49. Rosevear JW, Pfaff KJ, Service FJ, Molnar GD, Ackerman E. Glucose oxidase method for continuous automated blood glucose determination. Clin Chem 1969;15:680–698. [PubMed] [Google Scholar]
- 50. Klitgaard H, Zhou M, Schiaffino S, Betto R, Salviati G, Saltin B. Ageing alters the myosin heavy chain composition of single fibres from human skeletal muscle. Acta Physiol Scand 1990;140:55–62. [DOI] [PubMed] [Google Scholar]
- 51. Power GA, Minozzo FC, Spendiff S, Filion ME, Konokhova Y, Purves‐Smith M, et al Reduction in single muscle fiber rate of force development with aging is not attenuated in world class older masters athletes. Am J Physiol Cell Physiol 2015. ajpcell 00289 2015. [DOI] [PubMed] [Google Scholar]
- 52. Trappe S, Williamson D, Godard M, Porter D, Rowden G, Costill D. Effect of resistance training on single muscle fiber contractile function in older men. J Appl Physiol 1985. 2000;89:143–152. [DOI] [PubMed] [Google Scholar]
- 53. Rowan SL, Purves‐Smith FM, Solbak NM, Hepple RT. Accumulation of severely atrophic myofibers marks the acceleration of sarcopenia in slow and fast twitch muscles. Exp Gerontol 2011;46:660–669. [DOI] [PubMed] [Google Scholar]
- 54. Gouspillou G, Bourdel‐Marchasson I, Rouland R, Calmettes G, Biran M, Deschodt‐Arsac V, et al Mitochondrial energetics is impaired in vivo in aged skeletal muscle. Aging Cell 2014;13:39–48. [DOI] [PMC free article] [PubMed] [Google Scholar]
- 55. Safdar A, Hamadeh MJ, Kaczor JJ, Raha S, Debeer J, Tarnopolsky MA. Aberrant mitochondrial homeostasis in the skeletal muscle of sedentary older adults. PLoS One 2010;5e10778. [DOI] [PMC free article] [PubMed] [Google Scholar]
- 56. Konopka AR, Suer MK, Wolff CA, Harber MP. Markers of human skeletal muscle mitochondrial biogenesis and quality control: effects of age and aerobic exercise training. J Gerontol A Biol Sci Med Sci 2014;69:371–378. [DOI] [PMC free article] [PubMed] [Google Scholar]
- 57. Porter C, Hurren NM, Cotter MV, Bhattarai N, Reidy PT, Dillon EL, et al Mitochondrial respiratory capacity and coupling control decline with age in human skeletal muscle. Am J Physiol Endocrinol Metab 2015;309:E224–E232. [DOI] [PMC free article] [PubMed] [Google Scholar]
- 58. Amara CE, Shankland EG, Jubrias SA, Marcinek DJ, Kushmerick MJ, Conley KE. Mild mitochondrial uncoupling impacts cellular aging in human muscles in vivo. Proc Natl Acad Sci U S A 2007;104:1057–1062. [DOI] [PMC free article] [PubMed] [Google Scholar]
- 59. Marcinek DJ, Schenkman KA, Ciesielski WA, Lee D, Conley KE. Reduced mitochondrial coupling in vivo alters cellular energetics in aged mouse skeletal muscle. J Physiol 2005;569:467–473. [DOI] [PMC free article] [PubMed] [Google Scholar]
- 60. Leeuwenburgh C, Gurley CM, Strotman BA, Dupont‐Versteegden EE. Age‐related differences in apoptosis with disuse atrophy in soleus muscle. Am J Physiol Regul Integr Comp Physiol 2005;288:R1288–R1296. [DOI] [PubMed] [Google Scholar]
- 61. Marzetti E, Wohlgemuth SE, Lees HA, Chung HY, Giovannini S, Leeuwenburgh C. Age‐related activation of mitochondrial caspase‐independent apoptotic signaling in rat gastrocnemius muscle. Mech Ageing Dev 2008;129:542–549. [DOI] [PMC free article] [PubMed] [Google Scholar]
- 62. Gouspillou G, Bourdel‐Marchasson I, Rouland R, Calmettes G, Franconi JM, Deschodt‐Arsac V, et al Alteration of mitochondrial oxidative phosphorylation in aged skeletal muscle involves modification of adenine nucleotide translocator. Biochim Biophys Acta 2010;1797:143–151. [DOI] [PubMed] [Google Scholar]
- 63. Costanzo M, Cisterna B, Malatesta M. Effect of physical exercise on the ultrastructural features of skeletal muscle mitochondria in old mice. Microsc 2013;10:37–43. [Google Scholar]
- 64. Coen PM, Jubrias SA, Distefano G, Amati F, Mackey DC, Glynn NW, et al Skeletal muscle mitochondrial energetics are associated with maximal aerobic capacity and walking speed in older adults. J Gerontol A Biol Sci Med Sci 2013;68:447–455. [DOI] [PMC free article] [PubMed] [Google Scholar]
- 65. Bharadwaj MS, Tyrrell DJ, Leng I, Demons JL, Lyles MF, Carr JJ, et al Relationships between mitochondrial content and bioenergetics with obesity, body composition and fat distribution in healthy older adults. BMC Obes 2015;2:40. [DOI] [PMC free article] [PubMed] [Google Scholar]
- 66. Sipila S, Koskinen SO, Taaffe DR, Takala TE, Cheng S, Rantanen T, et al Determinants of lower‐body muscle power in early postmenopausal women. J Am Geriatr Soc 2004;52:939–944. [DOI] [PubMed] [Google Scholar]
- 67. Choi SJ, Files DC, Zhang T, Wang ZM, Messi ML, Gregory H, et al Intramyocellular lipid and impaired myofiber contraction in normal weight and obese older adults. J Gerontol A Biol Sci Med Sci 2016;71:557–564. [DOI] [PMC free article] [PubMed] [Google Scholar]
- 68. Visser M, Kritchevsky SB, Goodpaster BH, Newman AB, Nevitt M, Stamm E, et al Leg muscle mass and composition in relation to lower extremity performance in men and women aged 70 to 79: the health, aging and body composition study. J Am Geriatr Soc 2002;50:897–904. [DOI] [PubMed] [Google Scholar]
- 69. Beavers KM, Beavers DP, Houston DK, Harris TB, Hue TF, Koster A, et al Associations between body composition and gait‐speed decline: results from the Health, Aging, and Body Composition study. Am J Clin Nutr 2013;97:552–560. [DOI] [PMC free article] [PubMed] [Google Scholar]
- 70. Conte M, Vasuri F, Trisolino G, Bellavista E, Santoro A, Degiovanni A, et al Increased Plin2 expression in human skeletal muscle is associated with sarcopenia and muscle weakness. PLoS One 2013;8e73709. [DOI] [PMC free article] [PubMed] [Google Scholar]
- 71. Tardif N, Salles J, Guillet C, Tordjman J, Reggio S, Landrier JF, et al Muscle ectopic fat deposition contributes to anabolic resistance in obese sarcopenic old rats through eIF2alpha activation. Aging Cell 2014;13:1001–1011. [DOI] [PMC free article] [PubMed] [Google Scholar]
- 72. Matthews DR, Hosker JP, Rudenski AS, Naylor BA, Treacher DF, Turner RC. Homeostasis model assessment: insulin resistance and beta‐cell function from fasting plasma glucose and insulin concentrations in man. Diabetologia 1985;28:412–419. [DOI] [PubMed] [Google Scholar]
- 73. Amati F, Dube JJ, Alvarez‐Carnero E, Edreira MM, Chomentowski P, Coen PM, et al Skeletal muscle triglycerides, diacylglycerols, and ceramides in insulin resistance: another paradox in endurance‐trained athletes? Diabetes 2011;60:2588–2597. [DOI] [PMC free article] [PubMed] [Google Scholar]
- 74. von Haehling S, Morley JE, Coats AJS, Anker SD. Ethical guidelines for publishing in the Journal of Cachexia, Sarcopenia and Muscle: update 2015. J Cachexia Sarcopenia Muscle 2015;6:315–316. [DOI] [PMC free article] [PubMed] [Google Scholar]
Associated Data
This section collects any data citations, data availability statements, or supplementary materials included in this article.
Supplementary Materials
Figure S1. Range of weekly physical activity performed by the participants in the young adult group
Figure S2. Explanation of the experimental design used to assess skeletal muscle phenotype, mitochondrial content, and intramyocellular lipid content. Series of skeletal muscle cross sections were obtained. The first cross section was immunolabelled for myosin heavy chain (MHC) type I (in blue), type IIa (in red), IIx (in green), and laminin (in green surrounding each muscle fibre). This first stain was used to assess fibre size and type proportion. The second cross section was stained for succinate dehydrogenase activity, a reliable marker of mitochondrial content. Intramyocellular lipid content was assessed on the third cross section using an Oil Red O stain. Note that the same fibres are found within all three stains as indicated by the white arrows.
Figure S3: Relationships between the overall intramyocellular lipid (Oil Red O stain intensity) content and indices of related to muscle function, functional capacities, and insulin sensitivity.
Supporting info item
Supporting info item
Supporting info item