

ABSTRACT
Pseudomonas putida CSV86 degrades lignin-derived metabolic intermediates, viz., veratryl alcohol, ferulic acid, vanillin, and vanillic acid, as the sole sources of carbon and energy. Strain CSV86 also degraded lignin sulfonate. Cell respiration, enzyme activity, biotransformation, and high-pressure liquid chromatography (HPLC) analyses suggest that veratryl alcohol and ferulic acid are metabolized to vanillic acid by two distinct carbon source-dependent inducible pathways. Vanillic acid was further metabolized to protocatechuic acid and entered the central carbon pathway via the β-ketoadipate route after ortho ring cleavage. Genes encoding putative enzymes involved in the degradation were found to be present at fer, ver, and van loci. The transcriptional analysis suggests a carbon source-dependent cotranscription of these loci, substantiating the metabolic studies. Biochemical and quantitative real-time (qRT)-PCR studies revealed the presence of two distinct O-demethylases, viz., VerAB and VanAB, involved in the oxidative demethylation of veratric acid and vanillic acid, respectively. This report describes the various steps involved in metabolizing lignin-derived aromatic compounds at the biochemical level and identifies the genes involved in degrading veratric acid and the arrangement of phenylpropanoid metabolic genes as three distinct inducible transcription units/operons. This study provides insight into the bacterial degradation of lignin-derived aromatics and the potential of P. putida CSV86 as a suitable candidate for producing valuable products.
IMPORTANCE Pseudomonas putida CSV86 metabolizes lignin and its metabolic intermediates as a carbon source. Strain CSV86 displays a unique property of preferential utilization of aromatics, including for phenylpropanoids over glucose. This report unravels veratryl alcohol metabolism and genes encoding veratric acid O-demethylase, hitherto unknown in pseudomonads, thereby providing new insight into the metabolic pathway and gene pool for lignin degradation in bacteria. The biochemical and genetic characterization of phenylpropanoid metabolism makes it a prospective system for its application in producing valuable products, such as vanillin and vanillic acid, from lignocellulose. This study supports the immense potential of P. putida CSV86 as a suitable candidate for bioremediation and biorefinery.
KEYWORDS: Pseudomonas, veratryl alcohol degradation, phenylpropanoid metabolism, enzyme induction, O-demethylase, transcription analysis
INTRODUCTION
The ubiquitous presence of aromatic compounds, such as petroleum derivatives and pesticides, etc., their dominance in the ecosystem, and their adverse effects on biota necessitate their extermination from the environment. Besides various anthropogenic activities, plants also contribute complex aromatic polymers, such as lignocellulose, which accounts for the most abundant form of organic matter in the environment. Its breakdown is an essential part of the Earth's carbon cycle. Lignin is closely associated with cellulose in the plant cell wall, playing a vital role in the vascular system and offering protection against pathogens (1). Lignin is composed of guaiacyl, syringyl, and p-hydroxyphenyl units linked via β-aryl ether linkage, e.g., β-O-4. Lignocellulose is a potential source for the production of high-value aromatic compounds, such as vanillin and biofuel (2–4). However, lignin is recalcitrant by nature (due to hydrophobicity and extensive cross-linking) and resists breakdown. Plants and animals both show limited capacities to metabolize aromatic compounds (5). On the other hand, bacteria and fungi dominate the degradation of an array of aromatics in the environment. Most of the active lignin-degrading microbes identified to date are fungi belonging to white-rot and brown-rot families that decompose wood. Ligninolytic enzymes, such as lignin peroxidase, manganese peroxidases, versatile peroxidases, and laccases produced by fungi, have been implicated in the breakdown of lignin (6–8). In comparison, lignin degradation in bacteria was poorly understood; however, recent reports on lignin degradation by bacteria have begun to change this (4, 9–14). The bacterial system is studied predominantly for its role in mineralizing lignin-derived aromatics, such as vanillin, ferulic acid, β-coniferyl ether, and coniferyl aldehyde, etc., from the environment (8, 15–20). In bacteria, the catabolic pathway has been elucidated in detail for lignin-derived aromatic compounds, such as ferulic acid and vanillin (21–26). By contrast, very few organisms have been reported for the catabolism of veratryl alcohol or veratraldehyde (27, 28). In Streptomyces and Nocardia sp., the identification of isovanillic and vanillic acid in the spent medium from cultures grown with veratric acid (an intermediate in the degradation of veratryl alcohol) led to the proposal that veratric acid undergoes oxidative demethylation (29–31). In Comamonas testosteroni, it is proposed that two O-demethylases share a common reductase in veratric acid metabolism (23). However, the details of the catabolic steps and genes encoding veratric acid degradation enzymes have not been studied at the biochemical, substrate-specific induction, and relative gene expression levels.
Pseudomonas putida CSV86 (referred to as CSV86), a soil isolate, shows exemplary aromatic degradation (32–34). The strain displays a unique property of utilizing aromatics over glucose and cometabolizes aromatics and organic acids (33, 34). The draft genome sequence revealed the presence of genes involved in degrading phenylpropanoids (35). CSV86 showed an ability to grow on veratraldehyde, ferulic acid, vanillin, and vanillic acid, which were preferentially utilized over glucose (36). In this study, we used metabolic and molecular approaches to elucidate the catabolic pathways for veratryl alcohol and ferulic acid in detail. Both pathways converge at vanillic acid and funnel down to the central carbon pathway via protocatechuic acid. These pathways were found to be inducible, and the genes involved are organized as discrete transcriptional units. Further, we demonstrate the substrate-specific O-demethylases involved in degrading veratric acid and vanillic acid at biochemical and molecular levels. This study provides a detailed metabolic analysis of the carbon source-dependent induction of veratryl alcohol, veratric acid, and ferulic acid pathways, their operonic arrangement, and a transcriptional analysis, thus providing new insight into the metabolism of phenylpropanoid in bacteria.
RESULTS
Growth profile of P. putida CSV86 on lignin and phenylpropanoid compounds.
P. putida CSV86 showed good growth on veratryl alcohol, veratraldehyde, veratric acid, ferulic acid, vanillin, and vanillic acid (0.1%) as the sole sources of carbon and energy with the specific growth rates of 0.27, 0.4, 0.24, 0.54, 0.33, and 0.31 h−1, respectively (Fig. 1). Cells showed higher growth rates on ferulic acid and vanillic acid compared with the rates on other compounds. The delayed growth might be attributed to the inhibitory/toxic effect of aromatic alcohol or aldehyde groups. The strain also grew on lignin sulfonate (0.05, 0.1, and 0.2%), but at a lower rate (optical density at 540 nm [OD540], 0.04 to 0.05 at 0 h and 0.3 at 5 days at 30°C in 0.2% lignin) than on lignin-derived intermediates (see Fig. S1 in the supplemental material).
FIG 1.
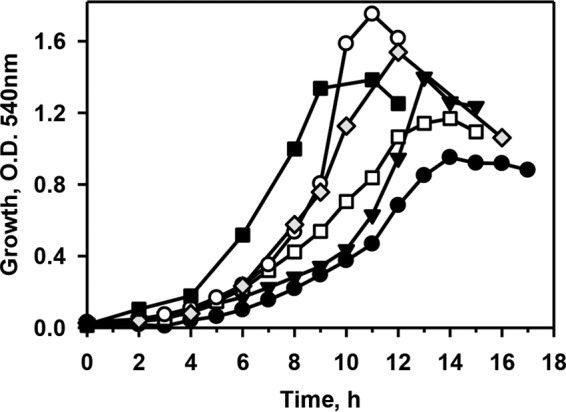
Growth profile of Pseudomonas putida CSV86 on phenylpropanoid compounds as the sole carbon source (0.1%). Symbols: ●, veratryl alcohol; ▼, veratraldehyde; □, veratric acid; ○, ferulic acid; ◆, vanillin; ■, vanillic acid. Cultures grown on respective aromatic compounds were used as an inoculum. Experiments were performed at least three times independently. The trends observed were similar. Growth profiles from one experiment are depicted here.
Whole-cell oxygen uptake studies.
To identify the key intermediates of veratryl alcohol and ferulic acid degradation, the cell respiration rates were measured on various probable metabolic intermediates and are depicted in Table 1. Cells grown on veratryl alcohol and veratraldehyde showed high respiration rates on veratryl alcohol, veratraldehyde, veratric acid, vanillic acid, vanillin, and protocatechuic acid; however, they failed to respire on ferulic acid. Veratric acid-grown cells showed high respiration rates on veratric acid, vanillic acid, isovanillic acid, and protocatechuic acid, but failed to respire on veratryl alcohol and ferulic acid. Ferulic acid- and vanillin-grown cells showed high respiration rates on ferulic acid, vanillin, vanillic acid, and protocatechuic acid, but poor/no respiration on veratryl alcohol, veratraldehyde, and veratric acid. These results indicate a carbon source-dependent respiration on probable intermediates. Vanillic acid-grown cells respired on vanillic acid and protocatechuic acid only. Cells grown on isovanillic acid respired on veratric acid, isovanillic acid, and protocatechuic acid. Except for catechol, glucose-grown cells failed to respire on any of these compounds. Irrespective of the carbon source used for the growth, cells showed similar respiration rates on catechol. Altogether, these results indicate that veratraldehyde, veratric acid, vanillic acid, and protocatechuic acid are probable metabolic intermediates in veratryl alcohol degradation, whereas vanillin, vanillic acid, and protocatechuic acid are probable intermediates in ferulic acid metabolism.
TABLE 1.
Whole-cell oxygen uptake by Pseudomonas putida CSV86
| Substrate | Whole-cell oxygen uptake rate (nmol O2 consumed min−1 · mg−1) of CSV86 cells grown on: |
|||||||
|---|---|---|---|---|---|---|---|---|
| Veratryl alcohol | Veratraldehyde | Veratric acid | Ferulic acid | Vanillin | Vanillic acid | Isovanillic acid | Glucose | |
| Veratryl alcohol | 2.1 ± 0.5 | 2.6 ± 1 0.2 | tra | tr | tr | tr | tr | NDb |
| Veratraldehyde | 7.1 ± 2 | 17.2 ± 5 | 4.3 ± 2 | 2 ± 1 | 2.5 ± 2 | 1.4 ± 0.6 | —c | ND |
| Veratric acid | 3.4 ± 1 | 5 ± 3 | 7.1 ± 2 | tr | tr | tr | 2.5 ± 0.9 | ND |
| Ferulic acid | tr | tr | tr | 8.1 ± 2 | 5.6 ± 1.7 | tr | tr | ND |
| Vanillin | 5 ± 2 | 8.5 ± 1 | 2 ± 0.3 | 16.6 ± 5 | 18.5 ± 2 | 1.7 ± 0.3 | — | ND |
| Vanillic acid | 4 ± 1.5 | 7.5 ± 2.4 | 9 ± 3 | 3.7 ± 1.3 | 3 ± 0.5 | 3.2 ± 0.4 | 1.5 ± 0.2 | ND |
| Isovanillic acid | — | — | 8.6 ± 5.7 | — | — | tr | 12.9 ± 0.2 | — |
| Protocatechuic acid | 13 ± 3 | 15 ± 3 | 16 ± 6 | 13 ± 2.3 | 14 ± 8 | 12 ± 5 | 12.8 ± 5.6 | ND |
| Catechol | 6.3 ± 0.1 | 5 ± 2.5 | 3 ± 0.1 | 3.7 ± 0.2 | 5 ± 0.6 | 6 ± 1 | — | 4.5 ± 0.04 |
tr, the observed oxygen uptake rate is less than 0.5 nmol of oxygen consumed min−1 · mg−1.
ND, not detected.
—, not performed.
Carbon source-dependent induction of enzymes and identification of reaction products.
The specific activities of various enzymes are summarized in Table 2. Cell extracts (CFE) prepared from veratryl alcohol-grown cells showed significant activities of veratryl alcohol dehydrogenase (ValcDH), veratraldehyde dehydrogenase (ValdDH), and protocatechuate 3,4-dioxygenase (PDO), while CFE from veratraldehyde-grown cells showed activities of ValdDH and PDO. Under ferulic acid and vanillin conditions, significant activities of feruloyl-coenzyme A synthetase (FCS), vanillin dehydrogenase (VDH), and PDO were observed. ValcDH, ValdDH, and VDH showed maximum activities with NAD+ compared with those with NADP+ as a cofactor. Veratric acid- and vanillic acid-grown cells showed activities of PDO. In glucose-grown cells, poor activities of these enzymes were observed. The enzyme activity data (Table 2) corroborate well with the results from the whole-cell respiration study (Table 1) and suggest a carbon source-dependent induction of enzymes.
TABLE 2.
Specific activities of enzymes from the cell extracts of Pseudomonas putida CSV86
| Enzymea | Cofactor | Specific activity (nmol · min−1 · mg−1) from extracts of CSV68 cells grown on: |
||||||
|---|---|---|---|---|---|---|---|---|
| Veratryl alcohol | Veratraldehyde | Veratric acid | Ferulic acid | Vanillin | Vanillic acid | Glucose | ||
| FCS | —b | — | — | 28.6 ± 6.6 | 29.5 ± 10.6 | NDc | 1.1 ± 0.8 | |
| ValcDH | NAD+ | 42.5 ± 7.3 | 6.2 ± 2.5 | 4.4 ± 2.7 | ND | 2.9 ± 1.6 | 1 ± 0.3 | 4.6 ± 1.1 |
| NADP+ | 5.2 ± 0.6 | 1.1 ± 0.2 | 8.5 ± 0.7 | ND | 12.6 ± 8.3 | ND | 1.1 ± 1.1 | |
| ValdDH | NAD+ | 20.2 ± 10 | 12.6 ± 5.7 | 5.5 ± 2.2 | 4 ± 1.2 | 4.8 ± 1 | 3.8 ± 1.4 | 3.8 ± 1.3 |
| NADP+ | 5.2 ± 0.6 | 9.5 ± 4 | 2 ± 1 | 4 ± 2 | 4.7 ± 1 | — | 1 ± 1.1 | |
| VDH | NAD+ | 56 ± 17 | 23 ± 8 | 5.2 ± 1.2 | 359 ± 34 | 217 ± 58 | 3.2 ± 0.3 | 3.2 ± 0.3 |
| NADP+ | 4.1 ± 1.7 | 15 ± 5 | — | 4.3 ± 2.4 | 9.3 ± 5 | 8.5 ± 2.1 | 8.5 ± 2.1 | |
| PDO | 345 ± 0.5 | 480 ± 55 | 417 ± 43 | 483 ± 51 | 443 ± 56 | 366 ± 95 | 17.5 ± 2.1 | |
FCS, feruloyl-coenzyme A synthetase; ValcDH, veratryl alcohol dehydrogenase; ValdDH, veratraldehyde dehydrogenase; VDH, vanillin dehydrogenase; PDO, protocatechuate 3,4-dioxygenase.
—, not performed.
ND, not detected.
Time-dependent spectral analysis for FCS and ValcDH reactions showed increases in the absorbances at 346 and 310 nm, which corresponds to λmax values of feruloyl-coenzyme A (CoA) and veratraldehyde, respectively (see Fig. S2A and B). Similarly, the spectral scans for ValdDH and VDH showed decreases in the absorbances at 310 and 340 nm, indicating the consumption of veratraldehyde and vanillin as the substrate, respectively (see Fig. S2C and D). Thin-layer chromatography (TLC) of bulk enzyme reactions of FCS with CFE prepared from ferulic acid-grown cells showed a spot with an Rf value of 0.65 (solvent system B), which corresponds to vanillic acid, indicating the conversion of ferulic acid to vanillic acid in the presence of ATP and CoA. With vanillin as the substrate, a spot (Rf, 0.46, solvent system A) corresponding to vanillic acid was observed, suggesting the conversion of vanillin to vanillic acid in the presence of NAD+. The CFE prepared from veratraldehyde-grown cells with veratraldehyde as the substrate showed a spot (Rf, 0.58) that corresponds to authentic veratric acid (see Fig. S3). The bulk enzyme reaction products identified by TLC correlate well with the time-dependent spectral scan data.
The activities of veratric acid O-demethylase (VrODM) and vanillic acid O-demethylase (VnODM) were monitored by high-pressure liquid chromatography (HPLC). The CFE prepared from veratric acid-grown cells showed VrODM and VnODM activities of 3.6 and 1.9 nmol · min−1 · mg−1, respectively, with NADPH. However, vanillic acid-grown cells showed 70% reduced activity of VrODM (1.2 nmol · min−1 · mg−1) and comparable activity of VnODM (1.7 nmol · min−1 · mg−1). Under anaerobic conditions, HPLC analysis showed a failure of the formation or disappearance of vanillic acid by VrODM or VnODM, respectively, suggesting the involvement of molecular oxygen.
Identification of specific dehydrogenases induced under different growth conditions by zymogram analysis.
CFE prepared from cells grown on veratryl alcohol and veratraldehyde showed a ValcDH activity band (Rf, 0.49) with veratryl alcohol as a substrate; however, no activity bands were observed from glucose-, benzyl alcohol-, and vanillin-grown cells. With benzyl alcohol as the substrate, a zymogram showed an activity band at an Rf of 0.49 (see Fig. S4). Similarly, with veratraldehyde as a substrate, a zymogram showed a ValdDH activity band at an Rf of 0.38 from veratryl alcohol- and veratraldehyde-grown cells. With substrates such as vanillin and benzaldehyde, a zymogram showed an activity band at an Rf of 0.38 (Fig. S4). However, benzyl alcohol-grown cells showed an activity band at an Rf of 0.26 with veratraldehyde as a substrate, indicating a different enzyme than ValdDH (Rf, 0.38). With vanillin as the substrate, ferulic acid- and vanillin-grown cells showed a VDH activity band at an Rf of 0.33, while benzyl alcohol-grown (Rf, 0.26) and veratraldehyde-grown (Rf, 0.38) cells showed activity bands at different positions. These results indicate a carbon source-dependent induction of different aromatic alcohol and aldehyde dehydrogenases in CSV86 (Fig. S4).
Bioinformatic and phylogenetic analyses of phenylpropanoid metabolic genes.
The various genes involved in metabolizing phenylpropanoids from CSV86 are summarized in Table S2. A genomic analysis showed the presence of two distinct clusters encoding O-demethylase: verAB in ver and vanAB in van loci. O-Demethylase is a two-component enzyme consisting of oxygenase and reductase subunits. The oxygenase components (VanA and VerA) shared 33% amino acid sequence identity, while the reductase components (VanB and VerB) shared 49% identity. The phylogenetic analysis showed a clustering of VanA from CSV86 with functionally characterized oxygenase subunits of vanillic acid O-demethylases from Pseudomonas sp. strain HR199, P. putida KT2440, C. testosteroni, and Rhodococcus jostii RHA (see Fig. S5A). VerA from CSV86 clustered with IvaA of C. testosteroni and VanA of P. aeruginosa PA103, Pseudomonas sp. GM21, and P. resinovorans NBRC 106553 (Fig. S5A). IvaA of C. testosteroni is reported to be oxygenase component-specific for veratric acid (20). The reductase component (VanB) from CSV86 clustered with the reductase of Pseudomonas sp. strain HR199; however, VerB clustered separately (Fig. S5B). Analyses suggest that VanAB and VerAB are probable VnODM and VrODM, respectively. A phylogenetic analysis for VDH from CSV86 showed close relations with VDH from Pseudomonas sp. strain HR199, P. putida KT2440, and P. fluorescens AN103 (Fig. S5C).
Transcriptional analysis of phenylpropanoid metabolic genes.
Ferulic acid, veratric acid, and vanillic acid degradation genes from CSV86 were found on distinct fer, ver, and van loci with their probable regulators (Fig. 2A; see also Table S2). The fer locus harbors 5′-ech-vdh-fcs-kct-acdh-3′, the ver locus contains 5′-verB-verA-tdh-vanK-oprD-3′, and the van locus has 5′-vanA-vanB-3′ genes with their respective putative promoters. Further analysis of these loci by reverse transcription-PCR (RT-PCR) (Fig. 2B) showed amplification of overlapping regions of ech-vdh (∼650 bp), vdh-fcs (∼800 bp), fcs-kct (∼900 bp), and kct-acdh (∼900 bp) for the fer locus; verB-verA (∼700 bp), verA-tdh (∼1,100 bp), and vanK-oprD (∼860 bp) for the ver locus; and vanA-vanB (∼790 bp) for the van locus. These results suggest that genes at these loci are cotranscribed. tdh-vanK was not amplified from the ver locus. Ferulic acid- and vanillin-grown cells showed higher levels of transcripts of each of these genes located on fer and van loci compared with those on the ver locus (Fig. 2B). Veratric acid-grown cells showed higher levels of transcripts for ver and van loci; however, there was no amplification of the fer locus (Fig. 2B). fer, ver, and van loci did not amplify from cDNA prepared from glucose-grown cells (Fig. 2B), suggesting these transcription units are induced in a carbon source-dependent manner.
FIG 2.

Schematic representation of phenylpropanoid degradation genes and cotranscriptional analysis from Pseudomonas putida CSV86. (A) Arrangement of phenylpropanoid catabolic genes at fer (ferulic acid catabolism, contig 115), ver (veratric acid catabolism, contig 119), and van (vanillic acid catabolism, contig 220) loci. Putative functions of these genes are given in Table S2 in the supplemental material. The numbers indicate the gene length (bp), numbers in parentheses indicate the intergenic distance (bp), while negative signs indicate that the genes are overlapping (bp). Putative promoters identified using BPROM are indicated by −10 and −35 boxes. (B) Cotranscriptional analysis (RT-PCR) of fer, ver, and van loci. PCR amplifications of cDNA prepared from CSV86 cells grown on ferulic acid, vanillin, veratric acid, and glucose were performed using primers (see Table S1) and are designated by arrows. Numbers indicate the expected length of PCR products (bp). In the negative control (denoted as -ve), the PCR was performed with cDNA synthesized without reverse transcriptase. The expression profile of a housekeeping gene, rpoD (155 bp), was taken as an internal reference. Lane M indicates molecular mass markers (kb).
The carbon source-dependent induction of specific O-demethylase was analyzed by quantitative RT-PCR (qRT-PCR), and the results are depicted in Fig. 3. In comparison with glucose-grown cells, veratric acid- and isovanillic acid-grown cells showed increases in the transcripts of verA, while vanillic acid-grown cells showed low transcript levels. The observed vanA transcript levels were comparable between veratric acid- and vanillic acid-grown cells, but were low in isovanillic acid-grown cells. These results suggest that verAB and vanAB code for putative VrODM and VnODM, respectively, and are inducible in nature. VrODM encoded by verAB might be responsible for demethylating veratric acid and isovanillic acid to vanillic acid and protocatechuic acid, respectively.
FIG 3.
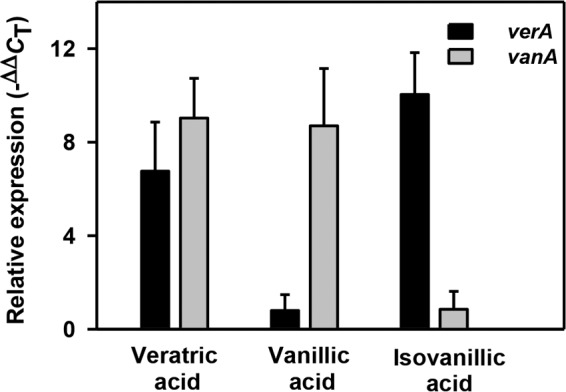
Expression analyses of verA and vanA encoding putative O-demethylase oxygenase subunits from Pseudomonas putida CSV86 cells grown on different carbon sources. Relative expression was calculated (see Materials and Methods for details) by taking the expression of a housekeeping gene, rpoD, as an internal reference.
DISCUSSION
Pseudomonas putida CSV86 utilizes lignin and lignin-derived metabolites (phenylpropanoids), such as veratryl alcohol, veratraldehyde, veratric acid, ferulic acid, vanillin, and vanillic acid, as the sole sources of carbon and energy. On the basis of results from carbon source-dependent cell respiration and enzyme activity studies, the detailed metabolic pathways for veratryl alcohol and ferulic acid in CSV86 are proposed in Fig. 4. Both pathways converge at vanillic acid, which is further central carbon metabolized via protocatechuic acid. The pathway for ferulic acid metabolism from various bacteria has been reported (22, 25, 37, 38); however, this report delineates the degradation pathway for veratryl alcohol in bacteria.
FIG 4.

Proposed pathway for the degradation of veratryl alcohol and ferulic acid in Pseudomonas putida CSV86. Solid arrows indicate the enzyme activities measured, while dotted arrows indicate the activities not measured. The proposed gene(s) encoding respective enzymes are given in the parentheses.
In CSV86, veratryl alcohol is metabolized to veratric acid via veratraldehyde by ValcDH and ValdDH. Aromatic alcohol and aldehyde dehydrogenases are reported to have broad substrate specificities (39, 40). There are multiple genes present in the draft genome of CSV86 annotated as aromatic alcohol and aldehyde dehydrogenases. The genes specifically encoding ValcDH and ValdDH were not identified due to the lack of biochemical and molecular information. In-gel activity studies suggest the induction of broad substrate-specific ValcDH (accepts veratryl alcohol or benzyl alcohol as a substrate) and ValdDH (accepts veratraldehyde, vanillin, or benzaldehyde as a substrate) in veratryl alcohol/veratraldehyde-grown cells. Genes encoding benzyl alcohol and benzaldehyde dehydrogenases (BADH and BZDH, respectively) are in close proximity to the ver locus. ValdDH appears to be different from BZDH, as it showed distinct carbon source-dependent activity bands. However, the specific genes encoding these enzymes can be identified by cloning, heterologous expression, and kinetic and molecular characterizations. The observed specific activities for ValcDH and ValdDH were comparable to those from the only available report from Penicillium simplicissimum (28). Veratric acid generated in CSV86 is further metabolized to protocatechuic acid via vanillic acid by VrODM and VnODM. Various bacteria, viz., Streptomyces sp., Nocardia sp. (30, 31), and C. testosteroni strain BR6020 (23), were reported to metabolize veratric acid to vanillic acid and isovanillic acid. In C. testosteroni, veratric acid is metabolized by a combination of inducible monooxygenase component VanA (demethylates veratric acid to isovanillic acid and vanillic acid to protocatechuic acid) or IvaA (demethylates isovanillic acid to protocatechuic acid and veratric acid to vanillic acid) and a common reductase (IvaB) component. In CSV86, vanillic acid-grown cells showed poor respiration on veratric acid and isovanillic acid and 70% reduced VrODM activity. This indicates the probable existence of two distinct inducible demethylases, VrODM and VnODM for veratric acid/isovanillic acid and vanillic acid metabolism, respectively. Genes encoding these demethylases were located on two loci (verAB and vanAB; Fig. 2), and their arrangement was found to be different in CSV86 compared with in the functionally characterized C. testosteroni strain BR6020 (in the later strain, vanA, ivaA, and ivaB were present in tandem; however, their cotranscription was not reported [23]). In CSV86, ver and van loci showed carbon source-dependent cotranscription with high levels of ver locus transcripts from veratric acid and isovanillic acid, while the transcript levels for the van locus were similar from veratric acid and vanillic acid. Further, a phylogenetic analysis of O-demethylase, comprising oxygenase (VerA and VanA) and reductase (VerB and VanB) components from CSV86, showed clustering of VanAB with the well-characterized vanillate demethylase (23, 37, 41, 42). Interestingly, oxygenase component VerA from CSV86 clustered with IvaA of C. testosteroni, for which veratric acid is reported as its true substrate (23). The reductase components of both O-demethylases are encoded by two different genes (vanB and verB) in CSV86; however, in C. testosteroni it is encoded by a single gene (ivaB) shared by both O-demethylases. These observations indicate that veratric acid and isovanillic acid are demethylated by VrODM, while vanillic acid is demethylated by VnODM, and they are encoded by ver and van loci, respectively, in CSV86. It would be really interesting to study O-demethylase activity when the reductase components are interchanged between VrODM and VnODM.
Metabolic studies suggest that in CSV86, ferulic acid is metabolized to protocatechuic acid via feruloyl-CoA, vanillin, and vanillic acid (Fig. 4), which is similar to the pathway reported from other Pseudomonas spp. (22, 25, 37, 38). In silico analysis and cotranscriptional studies in CSV86 confirm an operonic arrangement of ferulic acid metabolic genes at fer and van loci. The gene arrangement observed at these loci in CSV86 was similar to those reported from P. putida WCS358 (43), Amycolatopsis sp. HR167 (44), and P. fluorescens BF13 (45). In CSV86, the fer locus was transcriptionally induced by ferulic acid and by vanillin, which is in agreement with results from metabolic studies. Interestingly, these results are in contrast with those from an earlier report with P. fluorescens BF13, where vanillin failed to induce ferulic acid degradation genes (45), suggesting that the regulation of this operon is different in CSV86.
In summary, P. putida CSV86 degrades veratryl alcohol and ferulic acid via a vanillic acid and protocatechuic acid ortho ring-cleavage pathway. Biochemical and transcriptional studies indicate the involvement of two distinct O-demethylases for veratric acid and vanillic acid metabolism. Metabolic, bioinformatic, and molecular analyses suggest a segmentation of veratryl alcohol and ferulic acid degradation pathways. Putative genes involved in the degradation are arranged as distinct operons and are induced in a carbon source-dependent manner, thus displaying a genetic parsimony. Besides aromatics, CSV86 utilizes phenylpropanoid compounds preferentially over glucose (36). This novel and intriguing property of P. putida CSV86 makes it an attractive model organism for biodegradation, as well as bioconversion, of lignin-derived metabolites into economically important products leaving sugars for biofuel production.
MATERIALS AND METHODS
Microorganism and growth conditions.
P. putida CSV86 was grown on minimal salt medium (MSM; 150 ml [32]) at 30°C on a rotary shaker (200 rpm) in 500-ml-capacity baffled Erlenmeyer flasks supplemented with either glucose (0.25%) or phenylpropanoid/aromatic compound (0.1%) as a sole carbon source. The growth was monitored spectrophotometrically at 540 nm (Lambda 35; PerkinElmer, USA), and specific growth rates were calculated at exponential phase as described previously (46). The growth on lignin sulfonate (0.05, 0.1, and 0.2%) was monitored by measuring the optical density at 540 nm using MSM containing respective concentrations of lignin as references.
Whole-cell oxygen uptake.
CSV86 cells grown until late log phase on the appropriate carbon sources were used to monitor cell respiration rates on various phenylpropanoid compounds using an Oxygraph (Hansatech, UK) at 30°C as described previously (33). The reaction mixtures (2 ml) contained cells (4 mg, wet weight), substrate (100 μM), and potassium phosphate buffer (KPO4; 50 mM, pH 7.5). The rates were corrected for endogenous respiration (cell respiration without substrate) and expressed as nmol of O2 consumed min−1 · mg−1 of cells (wet weight).
Cell extract preparation.
CSV86 cells grown on appropriate carbon sources until late log phase were used to prepare cell extracts (CFE). Cells were harvested, resuspended in KPO4 buffer (50 mM, pH 7.5), and broken using sonication followed by centrifugation at 35,000 × g as described previously (36). The supernatant obtained was termed CFE and used as the source of enzymes for monitoring the activity.
Enzyme assays.
All enzyme activities were monitored spectrophotometrically (Lambda 35; PerkinElmer, USA). The activities of ValcDH and ValdDH were monitored by measuring the changes in the absorbances (increase for ValcDH and decrease for ValdDH) of veratraldehyde at 310 nm (ε310 = 9,300 M−1 · cm−1 [47]). The reaction mixtures (1 ml) contained veratryl alcohol or veratraldehyde (100 μM), KPO4 buffer (50 mM, pH 7.5), NAD+ (0.5 mM), and an appropriate amount of enzyme. VDH was monitored by measuring the rate of disappearance of vanillin at 340 nm (ε340 = 7,200 M−1 · cm−1 [22]). The reaction mixtures (1 ml) contained vanillin (100 μM), KPO4 buffer (50 mM, pH 7.5), NAD+ (0.5 mM), and an appropriate amount of enzyme. FCS was monitored by measuring the rate of appearance of feruloyl-CoA at 346 nm (ε346 = 19,000 M−1 · cm−1 [22]). The reaction mixtures (1 ml) contained ferulic acid (100 μM), KPO4 buffer (50 mM, pH 7.5), ATP (0.5 mM), MgCl2 (2.5 mM), coenzyme A (0.2 mM), and an appropriate amount of enzyme. PDO was monitored by measuring the rate of disappearance of protocatechuic acid at 290 nm (ε290 = 3,870 M−1 · cm−1 [48, 49]). The reaction mixtures (1 ml) contained protocatechuic acid (100 μM), KPO4 buffer (50 mM, pH 7.5), and an appropriate amount of enzyme.
Time-dependent spectral scans for ValcDH, ValdDH, VDH, FCS, and PDO were performed to identify the substrate utilization and/or product formation. Reaction mixtures were subjected to scans from 250 to 600 nm at an interval of 1 min for a period of 10 min.
Protein estimation was carried out by the Bradford method using bovine serum albumin (BSA) as the standard (50). The specific activities are expressed as nmol · min−1 · mg−1 of protein.
Thin-layer chromatography.
To identify the reaction products, bulk enzymatic reactions (scaled up to final volume of 10 ml) were carried out (under conditions as described above) at 30°C for 3 h with intermittent additions (every 30 min) of substrate and cofactor. The enzyme reactions were terminated by acidifying to pH 2 with 2N HCl, followed by extractions with equal volumes of ethyl acetate. The organic phase was dried over anhydrous sodium sulfate, concentrated, and resolved on TLC (0.5-mm-thick silica gel plates, 20 cm by 20 cm) using solvent systems of hexane:chloroform:acetic acid at 8:2:2 (vol/vol) or 7:3:2 (vol/vol). The resolved compounds were visualized using a UV transilluminator (254 nm; UVitech Ltd., England) and identified by comparing relative mobility (Rf) as well as UV fluorescence properties with the authentic compounds.
HPLC analysis of O-demethylase reactions.
VrODM and VnODM were monitored by measuring the rates of formation and disappearance of vanillic acid, respectively, using HPLC. The reaction mixtures (2 ml) contained veratric acid or vanillic acid (400 μM), KPO4 buffer (50 mM, pH 7.5), NAD(P)H (2 mM), and an appropriate amount of enzyme. The reaction mixtures were incubated at 30°C, and samples (0.5 ml) were drawn at different times (0, 20, 40, and 60 min). The reactions were terminated by acidification using 2 N HCl followed by centrifugation at 30,000 × g for 30 min. The supernatant was analyzed by HPLC (Agilent 1200; column Eclipse plus-C18 [4.6 mm by 150 mm]; diode array detector, 254 nm) using water:methanol:acetic acid at 66:33:1 (vol/vol) as the mobile phase (flow rate of 0.8 ml/min). The authentic compounds were treated similarly and were resolved. The observed retention times for authentic veratric acid and vanillic acid are 14.1 and 7.5 min, respectively. Reaction products were identified by comparing retention times with those of authentic compounds and quantified using respective concentration versus peak area plots.
To demonstrate the involvement of molecular oxygen, the O-demethylase reactions were performed under an anaerobic condition using Thunberg tubes as described previously (51). In brief, the reaction components were degassed to create an anoxygenic condition, and the reactions were initiated by tipping NADPH from the side arms of the tubes and incubated for 1 h. The reaction products were extracted and analyzed by HPLC as described above.
Zymogram analysis.
In-gel activity staining (zymogram) was performed to distinguish various aromatic alcohol and aldehyde dehydrogenases induced in CSV86 when cells were grown on phenylpropanoids or glucose. In brief, 100 μg of total protein (CFE) was resolved on native PAGE (7.5% [52]) at a constant current of 4 mA at 4°C. After electrophoresis, the gel was washed and equilibrated for 30 min with ice-cold KPO4 buffer (50 mM, pH 7.5) and incubated in 10 ml of activity staining solution (containing substrate [100 μM], NAD+ [0.5 mM], nitroblue tetrazolium [2.5 mg], phenazine methosulfate [2.5 mg], and KPO4 buffer [50 mM, pH 7.5]) at room temperature for 30 min or until bands were distinctly visible. The staining reaction was terminated by washing the gel extensively with distilled water. The Rf values of the activity bands were calculated using a ChemiDoc XRS+ gel documentation unit (Bio-Rad, USA).
RNA isolation, transcription, and RT-PCR analysis.
CSV86 cells grown on different carbon sources (OD540, 1.0) were processed for total RNA isolation using an RNeasy protect bacteria minikit as per the manufacturer's instructions (Qiagen, Germany). Cells were lysed by enzymatic and proteinase K digestions followed by purification of total RNA using an RNeasy minikit as per the manufacturer's instructions (Qiagen, Germany). RNA preparations were treated with DNase I (Ambion Turbo; Thermo Fisher, USA) to eliminate genomic DNA contamination and quantified using a microplate reader (Multiskan Go; Thermo Fisher, USA). cDNA synthesis was carried out using DNA-free RNA (1 μg) as a template, random hexamers, and SuperScript III reverse transcriptase as described (Invitrogen, USA). cDNA was used as a template in endpoint PCR (35 cycles, annealing temperature of 55°C) for cotranscription studies using gene-specific primers (see Table S1 in the supplemental material). As a negative control, a cDNA synthesis reaction was performed with RNase-treated sample without reverse transcriptase to ensure the absence of any genomic DNA contamination. Amplified (PCR) DNA fragments were resolved on an agarose gel (0.8%), were extracted using QIAquick gel extraction kit (Qiagen, Germany), and were sequenced (Bencos, India).
qRT-PCR was performed using StepOnePlus real-time PCR (Applied Biosystems, USA). The reaction mixtures (20 μl) contained Platinum SYBR green quantitative PCR (qPCR) SuperMix-UDG with ROX (10 μl; Invitrogen), cDNA template (0.01×), and primers (500 nM each; see Table S1). The thermo-cycler was programmed for 10 min at 95°C followed by 40 cycles, each cycle consisting of 15 s at 95°C and 1 min at 65°C. Relative expression levels of target gene transcripts were calculated (53) from the cycle threshold (CT) by calculating 2-ΔΔCT and taking the expression of a housekeeping gene, rpoD, as an internal reference; ΔCT = CT(target gene) − CT(rpoD). The ΔCT of samples from cells grown on veratric acid or vanillic acid (aromatics) were then compared with those from cells grown on glucose using the equation ΔΔCT = ΔCT(aromatics) − ΔCT(glucose).
Statistical analyses.
For all experiments, the means and standard deviations were calculated using values obtained from triplicates of at least three independent experiments.
Bioinformatic analysis.
A sequence-based analysis (BLASTp) was performed to identify genes involved in the phenylpropanoid metabolism using the draft genome sequence of P. putida CSV86 (accession no. AMWJ00000000.1; 35, 54). The promoter regions were identified in silico using a bacterial promoter prediction tool, BPROM (Softberry, Inc., Mount Kisco, NY, USA). The phylogenetic tree was constructed by ClustalW and Molecular Evolutionary Genetics Analysis version 6.0 (MEGA6), and the calculation was performed using the neighbor-joining method (55).
Supplementary Material
ACKNOWLEDGMENTS
K.M. was supported by a Senior Research Fellowship from the University Grants Commission of India.
Footnotes
Supplemental material for this article may be found at https://doi.org/10.1128/AEM.03326-16.
REFERENCES
- 1.Vanholme R, Demedts B, Morreel K, Ralph J, Boerjan W. 2010. Lignin biosynthesis and structure. Plant Physiol 153:895–905. doi: 10.1104/pp.110.155119. [DOI] [PMC free article] [PubMed] [Google Scholar]
- 2.Melero JA, Iglesias J, Garcia A. 2012. Biomass as renewable feedstock in standard refinery units. Feasibility, opportunities and challenges. Energy Environ Sci 5:7393–7420. doi: 10.1039/C2EE21231E. [DOI] [Google Scholar]
- 3.Tuck CO, Perez E, Horvath IT, Sheldon RA, Poliakoff M. 2012. Valorization of biomass: deriving more value from waste. Science 337:695–699. doi: 10.1126/science.1218930. [DOI] [PubMed] [Google Scholar]
- 4.Bugg TD, Rahmanpour R. 2015. Enzymatic conversion of lignin into renewable chemicals. Curr Opin Chem Biol 29:10–17. doi: 10.1016/j.cbpa.2015.06.009. [DOI] [PubMed] [Google Scholar]
- 5.Fuchs G, Boll M, Heider J. 2011. Microbial degradation of aromatic compounds - from one strategy to four. Nat Rev Microbiol 9:803–816. doi: 10.1038/nrmicro2652. [DOI] [PubMed] [Google Scholar]
- 6.Hatakka A. 1994. Lignin-modifying enzymes from selected white-rot fungi: production and role from in lignin degradation. FEMS Microbiol Rev 13:125–135. doi: 10.1111/j.1574-6976.1994.tb00039.x. [DOI] [Google Scholar]
- 7.ten Have R, Teunissen PJ. 2001. Oxidative mechanisms involved in lignin degradation by white-rot fungi. Chem Rev 101:3397–3413. doi: 10.1021/cr000115l. [DOI] [PubMed] [Google Scholar]
- 8.Bugg TD, Ahmad M, Hardiman EM, Rahmanpour R. 2011. Pathways for degradation of lignin in bacteria and fungi. Nat Prod Rep 28:1883–1896. doi: 10.1039/c1np00042j. [DOI] [PubMed] [Google Scholar]
- 9.Bugg TD, Ahmad M, Hardiman EM, Singh R. 2011. The emerging role for bacteria in lignin degradation and bio-product formation. Curr Opin Biotechnol 22:394–400. doi: 10.1016/j.copbio.2010.10.009. [DOI] [PubMed] [Google Scholar]
- 10.Ahmad M, Roberts JN, Hardiman EM, Singh R, Eltis LD, Bugg TD. 2011. Identification of DypB from Rhodococcus jostii RHA1 as a lignin peroxidase. Biochemistry 50:5096–5107. doi: 10.1021/bi101892z. [DOI] [PubMed] [Google Scholar]
- 11.Picart P, Sevenich M, Dominguez de Maria P, Schallmey A. 2015. Exploring glutathione lyases as biocatalysts: paving the way for enzymatic lignin depolymerization and future stereo selective applications. Green Chem 17:4931–4940. doi: 10.1039/C5GC01078K. [DOI] [Google Scholar]
- 12.Salvachua D, Karp EM, Nimlos CT, Vardon DR, Beckham GT. 2015. Towards lignin consolidated bioprocessing: simultaneous lignin depolymerization and product generation by bacteria. Green Chem 17:4951–4967. doi: 10.1039/C5GC01165E. [DOI] [Google Scholar]
- 13.Linger JG, Vardon DR, Guarnieri MT, Karp EM, Hunsinger GB, Franden MA, Johnson CW, Chupka G, Strathmann TJ, Pienkos PT, Beckham GT. 2014. Lignin valorization through integrated biological funneling and chemical catalysis. Proc Natl Acad Sci U S A 111:12013–12018. doi: 10.1073/pnas.1410657111. [DOI] [PMC free article] [PubMed] [Google Scholar]
- 14.Varman AM, He L, Follenfant R, Wu W, Wemmer S, Wrobel SA, Tang YJ, Singh S. 2016. Decoding how a soil bacterium extracts building blocks and metabolic energy from ligninolysis provides road map for lignin valorization. Proc Natl Acad Sci U S A 113:E5802–E5811. doi: 10.1073/pnas.1606043113. [DOI] [PMC free article] [PubMed] [Google Scholar]
- 15.de Gonzalo G, Colpa DI, Habib MH, Fraaije MW. 2016. Bacterial enzymes involved in lignin degradation. J Biotechnol 236:110–119. doi: 10.1016/j.jbiotec.2016.08.011. [DOI] [PubMed] [Google Scholar]
- 16.Vicuna R, Gonzalez B, Ruttimann C, Sapag A, Seelenfreund D. 1988. Biochemical and genetic studies of bacteria metabolizing lignin-related compounds. Arch Biol Med Exp (Santiago) 21:247–255. [PubMed] [Google Scholar]
- 17.Zimmermann W. 1990. Degradation of lignin by bacteria. J Biotechnol 13:119–130. doi: 10.1016/0168-1656(90)90098-V. [DOI] [Google Scholar]
- 18.Masai E, Katayama Y, Fukuda M. 2007. Genetic and biochemical investigations on bacterial catabolic pathways for lignin-derived aromatic compounds. Biosci Biotechnol Biochem 71:1–15. doi: 10.1271/bbb.60437. [DOI] [PubMed] [Google Scholar]
- 19.Li C, Zhao X, Wang A, Huber GW, Zhang T. 2015. Catalytic transformation of lignin for the production of chemicals and fuels. Chem Rev 115:11559–11624. doi: 10.1021/acs.chemrev.5b00155. [DOI] [PubMed] [Google Scholar]
- 20.Ishikawa H, Schubert WJ, Nord FF. 1963. Investigations on lignins and lignification. 27. The enzymic degradation of softwood lignin by white-rot fungi. Arch Biochem Biophys 100:131–139. [DOI] [PubMed] [Google Scholar]
- 21.Rosazza JP, Huang Z, Dostal L, Volm T, Rousseau B. 1995. Review: biocatalytic transformations of ferulic acid: an abundant aromatic natural product. J Ind Microbiol 15:457–471. doi: 10.1007/BF01570016. [DOI] [PubMed] [Google Scholar]
- 22.Narbad A, Gasson MJ. 1998. Metabolism of ferulic acid via vanillin using a novel CoA-dependent pathway in a newly-isolated strain of Pseudomonas fluorescens. Microbiology 144:1397–1405. doi: 10.1099/00221287-144-5-1397. [DOI] [PubMed] [Google Scholar]
- 23.Providenti MA, O'Brien JM, Ruff J, Cook AM, Lambert IB. 2006. Metabolism of isovanillate, vanillate, and veratrate by Comamonas testosteroni strain BR6020. J Bacteriol 188:3862–3869. doi: 10.1128/JB.01675-05. [DOI] [PMC free article] [PubMed] [Google Scholar]
- 24.Chen HP, Chow M, Liu CC, Lau A, Liu J, Eltis LD. 2012. Vanillin catabolism in Rhodococcus jostii RHA1. Appl Environ Microbiol 78:586–588. doi: 10.1128/AEM.06876-11. [DOI] [PMC free article] [PubMed] [Google Scholar]
- 25.Overhage J, Priefert H, Steinbüchel A. 1999. Biochemical and genetic analyses of ferulic acid catabolism in Pseudomonas sp. strain HR199. Appl Environ Microbiol 65:4837–4847. [DOI] [PMC free article] [PubMed] [Google Scholar]
- 26.Simon O, Klaiber I, Huber A, Pfannstiel J. 2014. Comprehensive proteome analysis of the response of Pseudomonas putida KT2440 to the flavor compound vanillin. J Proteomics 109:212–227. doi: 10.1016/j.jprot.2014.07.006. [DOI] [PubMed] [Google Scholar]
- 27.Mohan K, Khanna S. 1993. Degradation of veratraldehyde by Alcaligenes paradoxus. FEMS Microbiol Lett 108:361–366. doi: 10.1111/j.1574-6968.1993.tb06128.x. [DOI] [Google Scholar]
- 28.de Jong E, Beuling EE, van der Zwan RP, de Bont JA. 1990. Degradation of veratryl alcohol by Penicillium simplicissimum. Appl Microbiol Biotechnol 34:420–425. doi: 10.1007/BF00170072. [DOI] [Google Scholar]
- 29.Crawford RL, McCoy E, Harkin JM, Kirk TK, Obst JR. 1973. Degradation of methoxylated benzoic acids by a Nocardia from a lignin-rich environment: significance to lignin degradation and effect of chloro substituents. Appl Microbiol 26:176–184. [DOI] [PMC free article] [PubMed] [Google Scholar]
- 30.Malarczyk E. 1984. Substrate-induction of veratric acid O-demethylase in Nocardia sp. Acta Biochim Pol 31:383–395. [PubMed] [Google Scholar]
- 31.Nishimura M, Ooi O, Davies J. 2006. Isolation and characterization of Streptomyces sp. NL15-2K capable of degrading lignin-related aromatic compounds. J Biosci Bioeng 102:124–127. doi: 10.1263/jbb.102.124. [DOI] [PubMed] [Google Scholar]
- 32.Mahajan MC, Phale PS, Vaidyanathan CS. 1994. Evidence for the involvement of multiple pathways in the biodegradation of 1- and 2-methylnaphthalene by Pseudomonas putida CSV86. Arch Microbiol 161:425–433. doi: 10.1007/BF00288954. [DOI] [PubMed] [Google Scholar]
- 33.Basu A, Apte SK, Phale PS. 2006. Preferential utilization of aromatic compounds over glucose by Pseudomonas putida CSV86. Appl Environ Microbiol 72:2226–2230. doi: 10.1128/AEM.72.3.2226-2230.2006. [DOI] [PMC free article] [PubMed] [Google Scholar]
- 34.Shrivastava R, Purohit H, Phale PS. 2011. Metabolism and preferential utilization of phenylacetic acid and 4-hydroxyphenylacetic acid in Pseudomonas putida CSV86. J Bioremed Biodegrad 2:120. doi: 10.4172/2155-6199.1000120. [DOI] [Google Scholar]
- 35.Paliwal V, Raju SC, Modak A, Phale PS, Purohit HJ. 2014. Pseudomonas putida CSV86: a candidate genome for genetic bioaugmentation. PLoS One 9:e84000. doi: 10.1371/journal.pone.0084000. [DOI] [PMC free article] [PubMed] [Google Scholar]
- 36.Karishma M, Trivedi VD, Choudhary A, Mhatre A, Kambli P, Desai J, Phale PS. 2015. Analysis of preference for carbon source utilization among three strains of aromatic compounds degrading Pseudomonas. FEMS Microbiol Lett 362:fnv139. doi: 10.1093/femsle/fnv139. [DOI] [PubMed] [Google Scholar]
- 37.Priefert H, Rabenhorst J, Steinbuchel A. 1997. Molecular characterization of genes of Pseudomonas sp. strain HR199 involved in bioconversion of vanillin to protocatechuate. J Bacteriol 179:2595–2607. doi: 10.1128/jb.179.8.2595-2607.1997. [DOI] [PMC free article] [PubMed] [Google Scholar]
- 38.Gasson MJ, Kitamura Y, McLauchlan WR, Narbad A, Parr AJ, Parsons EL, Payne J, Rhodes MJ, Walton NJ. 1998. Metabolism of ferulic acid to vanillin. A bacterial gene of the enoyl-SCoA hydratase/isomerase superfamily encodes an enzyme for the hydration and cleavage of a hydroxycinnamic acid SCoA thioester. J Biol Chem 273:4163–4170. [DOI] [PubMed] [Google Scholar]
- 39.Reid MF, Fewson CA. 1994. Molecular characterization of microbial alcohol dehydrogenases. Crit Rev Microbiol 20:13–56. doi: 10.3109/10408419409113545. [DOI] [PubMed] [Google Scholar]
- 40.Shrivastava R, Basu A, Phale PS. 2011. Purification and characterization of benzyl alcohol- and benzaldehyde-dehydrogenase from Pseudomonas putida CSV86. Arch Microbiol 193:553–563. doi: 10.1007/s00203-011-0697-6. [DOI] [PubMed] [Google Scholar]
- 41.Civolani C, Barghini P, Roncetti AR, Ruzzi M, Schiesser A. 2000. Bioconversion of ferulic acid into vanillic acid by means of a vanillate-negative mutant of Pseudomonas fluorescens strain BF13. Appl Environ Microbiol 66:2311–2317. doi: 10.1128/AEM.66.6.2311-2317.2000. [DOI] [PMC free article] [PubMed] [Google Scholar]
- 42.Segura A, Bunz PV, D'Argenio DA, Ornston LN. 1999. Genetic analysis of a chromosomal region containing vanA and vanB, genes required for conversion of either ferulate or vanillate to protocatechuate in Acinetobacter. J Bacteriol 181:3494–3504. [DOI] [PMC free article] [PubMed] [Google Scholar]
- 43.Venturi V, Zennaro F, Degrassi G, Okeke BC, Bruschi CV. 1998. Genetics of ferulic acid bioconversion to protocatechuic acid in plant-growth-promoting Pseudomonas putida WCS358. Microbiology 144:965–973. doi: 10.1099/00221287-144-4-965. [DOI] [PubMed] [Google Scholar]
- 44.Achterholt S, Priefert H, Steinbuchel A. 2000. Identification of Amycolatopsis sp. strain HR167 genes, involved in the bioconversion of ferulic acid to vanillin. Appl Microbiol Biotechnol 54:799–807. doi: 10.1007/s002530000431. [DOI] [PubMed] [Google Scholar]
- 45.Calisti C, Ficca AG, Barghini P, Ruzzi M. 2008. Regulation of ferulic catabolic genes in Pseudomonas fluorescens BF13: involvement of a MarR family regulator. Appl Microbiol Biotechnol 80:475–483. doi: 10.1007/s00253-008-1557-4. [DOI] [PubMed] [Google Scholar]
- 46.Hall BG, Acar H, Nandipati A, Barlow M. 2014. Growth rates made easy. Mol Biol Evol 31:232–238. doi: 10.1093/molbev/mst187. [DOI] [PubMed] [Google Scholar]
- 47.Gomez-Toribio V, Garcia-Martin AB, Martinez MJ, Martinez AT, Guillen F. 2009. Induction of extracellular hydroxyl radical production by white-rot fungi through quinone redox cycling. Appl Environ Microbiol 75:3944–3953. doi: 10.1128/AEM.02137-08. [DOI] [PMC free article] [PubMed] [Google Scholar]
- 48.Stanier RY, Ingraham JL. 1954. Protocatechuic acid oxidase. J Biol Chem 210:799–808. [PubMed] [Google Scholar]
- 49.Fujisawa H, Hayaishi O. 1968. Protocatechuate 3,4-dioxygenase. I. Crystallization and characterization. J Biol Chem 243:2673–2681. [PubMed] [Google Scholar]
- 50.Bradford MM. 1976. A rapid and sensitive method for the quantitation of microgram quantities of protein utilizing the principle of protein-dye binding. Anal Biochem 72:248–254. doi: 10.1016/0003-2697(76)90527-3. [DOI] [PubMed] [Google Scholar]
- 51.Swetha VP, Phale PS. 2005. Metabolism of carbaryl via 1,2-dihydroxynaphthalene by soil isolates Pseudomonas sp. strains C4, C5, and C6. Appl Environ Microbiol 71:5951–5956. doi: 10.1128/AEM.71.10.5951-5956.2005. [DOI] [PMC free article] [PubMed] [Google Scholar]
- 52.Laemmli UK. 1970. Cleavage of structural proteins during the assembly of the head of bacteriophage T4. Nature 227:680–685. doi: 10.1038/227680a0. [DOI] [PubMed] [Google Scholar]
- 53.Livak KJ, Schmittgen TD. 2001. Analysis of relative gene expression data using real-time quantitative PCR and the 2−ΔΔCT method. Methods 25:402–408. doi: 10.1006/meth.2001.1262. [DOI] [PubMed] [Google Scholar]
- 54.Phale PS, Paliwal V, Raju SC, Modak A, Purohit HJ. 2013. Genome sequence of naphthalene-degrading soil bacterium Pseudomonas putida CSV86. Genome Announc 1:e00234-12. doi: 10.1128/genomeA.00234-12. [DOI] [PMC free article] [PubMed] [Google Scholar]
- 55.Tamura K, Stecher G, Peterson D, Filipski A, Kumar S. 2013. MEGA6: Molecular Evolutionary Genetics Analysis version 6.0. Mol Biol Evol 30:2725–2729. doi: 10.1093/molbev/mst197. [DOI] [PMC free article] [PubMed] [Google Scholar]
Associated Data
This section collects any data citations, data availability statements, or supplementary materials included in this article.