

Abstract
The KRAS GTPase plays a critical role in the control of cellular growth. The activity of KRAS is regulated by guanine nucleotide exchange factors (GEFs), GTPase-activating proteins (GAPs), and also post-translational modification. Lysine 104 in KRAS can be modified by ubiquitylation and acetylation, but the role of this residue in intrinsic KRAS function has not been well characterized. We find that lysine 104 is important for GEF recognition, because mutations at this position impaired GEF-mediated nucleotide exchange. Because the KRAS K104Q mutant has recently been employed as an acetylation mimetic, we conducted a series of studies to evaluate its in vitro and cell-based properties. Herein, we found that KRAS K104Q exhibited defects in both GEF-mediated exchange and GAP-mediated GTP hydrolysis, consistent with NMR-detected structural perturbations in localized regions of KRAS important for recognition of these regulatory proteins. Despite the partial defect in both GEF and GAP regulation, KRAS K104Q did not alter steady-state GTP-bound levels or the ability of the oncogenic KRAS G12V mutant to cause morphologic transformation of NIH 3T3 mouse fibroblasts and of WT KRAS to rescue the growth defect of mouse embryonic fibroblasts deficient in all Ras genes. We conclude that the KRAS K104Q mutant retains both WT and mutant KRAS function, probably due to offsetting defects in recognition of factors that up-regulate (GEF) and down-regulate (GAP) RAS activity.
Keywords: GTPase-activating protein (GAP), guanine nucleotide exchange factor (GEF), nuclear magnetic resonance (NMR), Ras protein, signaling, post-translational modification, protein acetylation, tumorigenesis
Introduction
RAS proteins function as molecular switches that cycle between active GTP- and inactive GDP-bound states to regulate signal transduction pathways that modulate cellular growth control. In the unstimulated cell, RAS proteins are populated in their inactive GDP-bound state. However, in response to growth-stimulatory signals, guanine nucleotide exchange factors (GEFs)2 co-localize and up-regulate RAS by facilitating exchange of GDP for GTP. Inactivation of RAS is achieved through GTPase-activating proteins (GAPs) that bind to GTP-bound RAS and promote GTP hydrolysis (1, 2). Several point mutations in RAS have been identified that dysregulate RAS nucleotide exchange or hydrolysis, often leading to hyperactivation and promoting tumorigenesis. The most common RAS mutations identified in cancer occur at residues 12, 13, and 61 and render RAS GAP defective, thereby populating RAS in its active GTP-bound state (3). Constitutive hyperactivation of RAS promotes chronic stimulation of effector-mediated downstream pathways, causing deregulated growth and tumorigenic growth transformation.
RAS contains two dynamic regions termed switch I (SWI; residues 30–37) and switch II (SWII; residues 60–76 with 66–74 corresponding to helix 2 (H2)) that populate distinct conformations when the protein is bound to GDP versus GTP. Effectors and GAP proteins recognize specific conformations of the switch regions and bind with preferential affinity to the active GTP- bound state. Activated GTP-bound RAS can interact with multiple effectors (e.g. RAF kinase, RAL exchange factors, phosphoinositol 3-kinase (PI3K), the RAC-selective GEF TIAM1, phospholipase C, NORE1) to promote downstream signaling pathways that control cell growth, differentiation, and apoptosis (4).
RAS proteins show high sequence conservation within their core guanine nucleotide binding domain (G domain) yet possess a hypervariable C terminus. The hypervariable region undergoes a variety of post-translational modifications (PTMs) that facilitate membrane association and drive differences in localization and activity (5). Additionally, several lysines within the core G domain of RAS undergo post-translational modifications, including acetylation, ubiquitylation, and methylation (5), but the role of these distinct modifications in regulating RAS function is still unclear. For example, KRAS monoubiquitylation at lysine 147 up-regulates RAS activity, signaling, and tumorigenesis (6). Additionally, lysine 104 has been shown to be a minor site of ubiquitylation, and we have previously shown that ubiquitylation of KRAS at this position does not alter the intrinsic biochemical properties or regulation by GEFs and GAPs (7). In contrast, lysine 104 acetylation was reported to down-regulate KRAS G12V-driven effector signaling and growth transformation in NIH 3T3 cells (8, 9). Whereas knockdown of two deacetylases, HDAC6 and SIRT2, reduced the viability of NIH 3T3 cells expressing the oncogenic KRAS G12V mutant (9), recent findings indicate that Ac-Lys104 is not a direct substrate for HDAC6 and SIRT2 under the conditions tested (10). A KRAS K104Q variant was used as an acetylation mimetic to evaluate how acetylation alters KRAS signaling. Molecular dynamics (MD) simulations indicated that the KRAS K104Q mutation completely disrupts the structural integrity of H2 (8), consistent with in vitro observations that SOS1-stimulated nucleotide exchange was impaired by 75%. However, the ability of KRAS K104Q to undergo GAP-stimulated GTP hydrolysis was not assessed (8). In NIH 3T3 cells, the K104Q mutation impaired KRAS G12V-driven effector signaling and growth transformation (8).
To better understand how perturbations at position 104 of KRAS alter intrinsic biochemical properties, structure, and regulatory and effector interactions, we characterized mutations at this position, including a K104Q mutant that has previously been employed as an acetylation mimetic (8). We find that the K104Q mutation perturbed both GEF- and GAP-stimulated guanine nucleotide exchange and GTP hydrolysis, respectively, yet did not alter either CRAF RAS binding domain (RBD) or PI3Kγ binding. However, in contrast to previous MD predictions, our NMR analyses indicated that KRAS K104Q does not fully disrupt SWII but rather causes a partial disruption of H2. Given these observations, we measured the thermal stability (melting temperature (Tm)) of WT, K104Q and Ac-Lys104 KRAS using circular dichroism (CD). We found that both K104Q and Ac-Lys104 show a modest decrease in Tm of 1.5 and 3.7 °C, respectively, relative to WT KRAS. Moreover, we found that K104Q did not significantly impair WT KRAS function, as measured by the ability to restore growth to Rasless mouse embryo fibroblasts (MEFs). In slight contrast to a previous study, we also found that K104Q did not significantly alter mutant KRAS G12V effector signaling and induction of morphologic transformation. Taken together, our data indicate that the KRAS K104Q impairs the structural integrity of H2 and RAS regulation by GEFs and GAPs in vitro but does not significantly alter the steady-state level of GTP-bound protein in NIH 3T3 cells. Consistent with our findings that KRAS K104Q retains effector engagement in vitro and GTP levels in cells, the K104Q substitution did not significantly alter either WT KRAS or G12V biological activity. We postulate that the consequences of the K104Q substitution on GAP and GEF regulation probably offset each other to maintain the active GTP-bound state and effector signaling in cells.
Results
KRAS Lys104 Mutations Disrupt SOScat-mediated Nucleotide Exchange and p120 GAPcat-mediated Hydrolysis
RAS proteins cycle between inactive GDP- and active GTP-bound states to coordinate downstream signaling and cellular growth. Lysine 104 in KRAS undergoes multiple PTMs, yet the role of this residue in intrinsic RAS function has not been well characterized. In the X-ray structure of KRAS bound to GDP (PDB code 4LPK), the side chain of lysine 104 interacts with the backbone carbonyl group of Arg73 and Gly75 contained within SWII. Disruption of these interactions has been proposed to perturb the structural integrity of SWII and alter interactions with regulatory proteins and effectors that interact with SWII (11, 12). Moreover, Arg102 and Val103, surrounding Lys104 in H3, interact directly with the SOS catalytic domain (PDB code 1NVW) (13). Hence, mutations or PTMs that perturb these interactions may prevent proper SOS-mediated up-regulation of RAS. Consistent with these observations, it has been shown previously that KRAS K104Q disrupts SOScat-mediated nucleotide exchange (8). KRAS K104Q has been dubbed an acetylation mimetic, yet how this mutation affects the structure of RAS, GAP-mediated GTP hydrolysis, and effector recognition has not been determined. To further investigate the role of non-conservative and conservative mutations at this key position, we mutated residue Lys104 to glutamine, arginine, and alanine and monitored the rate of MANT-GDP nucleotide dissociation in the absence and presence of SOScat. As shown in Fig. 1A, all three mutations impaired SOS-mediated nucleotide exchange. In particular, a reduction in the rate of GDP dissociation by 78% for K104Q, 75% for K104R, and 50% for K104A was observed in comparison with WT KRAS (12.5 ± 0.2 × 10⁻⁴ s−1) (Fig. 1A and Table 1). All three mutations, even the K104R variant that retains the side chain positive charge, impaired SOS-mediated exchange. Although KRAS K104R has previously been reported to retain GEF activity (8), we find that this conservative substitution (K104R) impaired SOS regulation of RAS nucleotide exchange. These findings indicate that Lys104 plays an essential role in SOScat-mediated nucleotide exchange of KRAS. Because the K104Q variant was predicted to impair the structural integrity of SWII (8), which is also important for GAP-mediated down-regulation of RAS activity, we measured both the intrinsic and GAP-mediated rate of GTP hydrolysis (Table 1). Although the intrinsic rate of GTP hydrolysis for KRAS K104Q is similar to that of WT KRAS, we found a significant reduction (53%) in the p120 GAPcat-stimulated rate of GTP hydrolysis (Fig. 1B). Taken together, these data suggest that the K104Q mutation, which has been used as a RAS acetylation mimic, impairs regulation of GDP/GTP cycling by both GEFs and GAPs.
FIGURE 1.

The KRAS K104Q mutation impairs regulation by GEFs and GAPs yet retains effector binding interactions with RAF and PI3K RAS binding domains. A, E. coli-expressed and purified WT and mutant (K104Q, K104R, and K104A) were loaded with MANT-GDP, and the rate of GDP dissociation was determined by monitoring the decrease in MANT-GDP fluorescence emission over time in the absence and presence of an SOS (Ras/SOScat = 1:1). Data were fit to an exponential dissociation curve. Rates are reported as the mean ± S.E. (error bars) (n = 2). B, p120 GAPcat-mediated GTP hydrolysis, as determined using single-turnover GTP hydrolysis for KRAS WT and K104Q in the absence or presence of p120 GAP (GAPcat/Ras = 1:200). Hydrolysis was initiated by the addition of Mg2+ and monitored by the change in fluorescence of the protein, Flippi, upon binding free phosphate. Data were converted to phosphate concentration using a standard curve. Results are the mean ± S.E. (n = 2). C, the binding affinity of KRAS WT and K104Q to CRAF RBD, BRAF RBD, and PI3Kγ K802T was determined by loading KRAS proteins with MANT-GMPPCP and measuring nucleotide release rates as a function of effector protein concentration. To determine the affinity (KD) for the KRAS-effector complex, the data were fitted to a standard curve. Relative binding affinity to KRAS WT is shown with original values included in Table 1. Results are reported as the mean ± S.E. (n = 2). All of the original values are listed in Table 1.
TABLE 1.
Biochemical properties of WT and KRas 104 mutants
| Property | WT | K104Q | K104R | K104A |
|---|---|---|---|---|
| Nucleotide exchange rate (10−4 s−1) | ||||
| Intrinsic | 2.0 ± 0.1 | 1.2 ± 0.1 | 1.4 ± 0.1 | 1.2 ± 0.1 |
| SOScat | 12.5 ± 0.2 | 2.8 ± 0.1 | 3.2 ± 0.1 | 6.3 ± 0.1 |
| GTP hydrolysis rate (10−3 s−1) | ||||
| Intrinsic | 0.1 ± 0.1 | 0.1 ± 0.1 | ||
| p120 GAPcat | 7.6 ± 0.5 | 3.6 ± 0.2 | ||
| Effector affinity (KD) (μm) | ||||
| BRAF RBD | 0.2 ± 0.1 | 0.1 ± 0.02 | ||
| CRAF RBD | 0.2 ± 0.1 | 0.2 ± 0.1 | ||
| PI3Kγ (p110 subunit, K802T) | 16.2 ± 6.1 | 17.2 ± 1.2 | ||
Upon GEF-mediated GDP exchange for GTP, RAS-GTP undergoes a conformational change in both the SWI and SWII regions. This in turn promotes binding to downstream effectors (14). Although SWI is a primary binding site for a subset of RBDs (i.e. RAF and RALGEFs), some effectors (i.e. PI3K, PLCϵ, and NORE1) bind to RAS using both SWI and SWII regions (14). To assess whether the K104Q mutation alters KRAS effector interactions, we determined the binding affinity of KRAS K104Q to the RAS RBDs of CRAF and BRAF as well as PI3Kγ, by monitoring the dissociation rate of MANT-GMPPCP as function of RAS effector concentration (Table 1). Results from these analyses indicate that KRAS K104Q retains binding to RAF RBDs and PI3Kγ relative to WT RAS (Fig. 1C).
The KRAS K104Q and Ac-Lys104 Decrease Thermal Stability
To evaluate the effects of side chain modification at Lys104 on thermal stability, we measured the Tm for His6-WT KRAS, K104Q, and Ac-Lys104 by CD, by monitoring the thermal transition as a function of temperature, as shown in Fig. 2A. We found that K104Q and Ac-Lys104 KRAS showed similar cooperative unfolding transitions but possessed a lower Tm (K104Q (64.2 ± 0.1 °C), Ac-Lys104 (62.0 ± 0.5 °C)) in comparison with WT KRAS (65.8 ± 0.4 °C). The small Tm changes shown in Fig. 2B indicate that acetylation or mutation of the Lys104 side chain alters protein stability.
FIGURE 2.
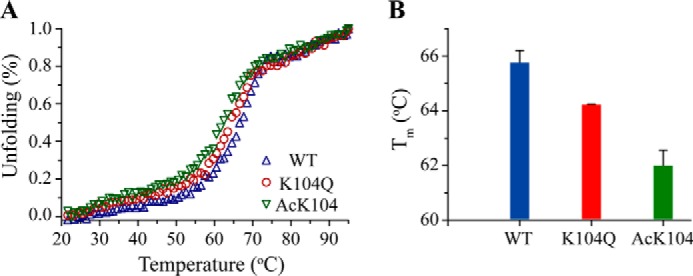
Ac-Lys104 and K104Q KRAS show decreased thermal stability relative to WT KRAS. A, the CD signal at 222 nm was monitored as a function of temperature (20–95 °C) for His6-WT KRAS, K104Q, and Ac-Lys104 (20 μm) bound to GDP. B, the midpoint of the thermal transition (Tm) was determined by fitting the temperature dependence in A. Results are reported as the mean ± S.E. (error bars) (n = 3).
The KRAS K104Q Mutation Perturbs the Conformation of Helix 2 and Helix 3
Given the decrease in protein stability observed for KRAS K104Q, we conducted NMR studies to investigate whether the mutation alters KRAS structure. The RAS switch regions undergo distinct conformations when bound to either GDP or GTP. These conformational changes are key to recognition of GAPs and effector proteins as well as GTP-dependent SOS allosteric regulation (15). Based on the crystal structure of KRAS bound to GDP (PDB code 4LPK), the Lys104 amino side chain interacts with the backbone carbonyls of Arg-73 and Gly-75 located at the end of SWII (see Fig. 5A). These interactions were previously predicted to play a key role in the structural integrity of SWII, because MD simulations suggested that both the KRAS K104Q mutation and Lys104 acetylation cause complete disruption of H2 within SWII (8). However, given our findings that KRAS K104Q retains the ability to hydrolyze GTP (Fig. 1B), it is unlikely that helix 2 undergoes a full helix-coil transition upon mutation or acetylation. To better address this apparent discrepancy, we employed NMR spectroscopy to characterize structural and dynamic changes in KRAS upon mutation of lysine 104 to a glutamine.
FIGURE 5.

The side chain of Lys104 in helix 3 interacts with helix 2 in switch II. A, expanded region illustrating interactions between H3 and H2, derived from the X-ray structure of KRAS-GDP (PDB 4LPK, resolution 1.5 Å). Hydrogen atoms were added to structure using XLeap (Amber). The Lys104 amino side chain is in close proximity to backbone carbonyl oxygens of Arg73 (H2) and Gly75 in switch II. B, structural perturbations revealed by NMR are mapped on the 3D structure (PDB code 4LPK). Switch I and switch II are colored with pink and purple, respectively. Lys104 is represented by spheres. The perturbed regions, as determined by NMR-derived CSP and chemical indexing, are highlighted in red for the latter part of the H2 and the α2-β4 loop (residues 71–76) and yellow for residues 102–103 in H3.
We first assigned the backbone resonances of WT and KRAS K104Q bound to Mg2+ and GDP by acquiring a series of triple resonance NMR experiments on 13C,15N-enriched KRAS 1–169 (16). We were able to assign 159 and 161 of 167 non-proline backbone NH, Cα, and Cβ resonances for WT and KRAS K104Q, respectively. A 2D 1H-15N heteronuclear single quantum coherence (HSQC) spectral overlay of K104Q and WT KRAS bound to GDP is shown in Fig. 3. 1H-15N HSQC spectra allow for the detection of protons directly bonded to a 15N, including both backbone and side chain NH resonances. Because an NH resonance can be detected for every residue with the exception of proline, the spectrum contains a “fingerprint” of the protein backbone. Inspection of chemical shift differences between KRAS WT and K104Q bound to GDP show that ∼30% of the backbone NH peaks undergo changes in peak position. Using chemical shift perturbation (CSP) analyses (Fig. 4A), we found that the largest CSPs (>0.2 ppm) corresponded to residues proximal to the site of the mutation (positions 102–110) and within SWII. Smaller (<0.2 ppm) CSPs were observed for residues within the first β-sheet. In contrast, residues in SWI do not show significant CSPs. These findings are consistent with perturbation of contacts between Lys104, Arg73, and Gly75 at the end of SWII due to mutation of Lys104 to glutamine.
FIGURE 3.
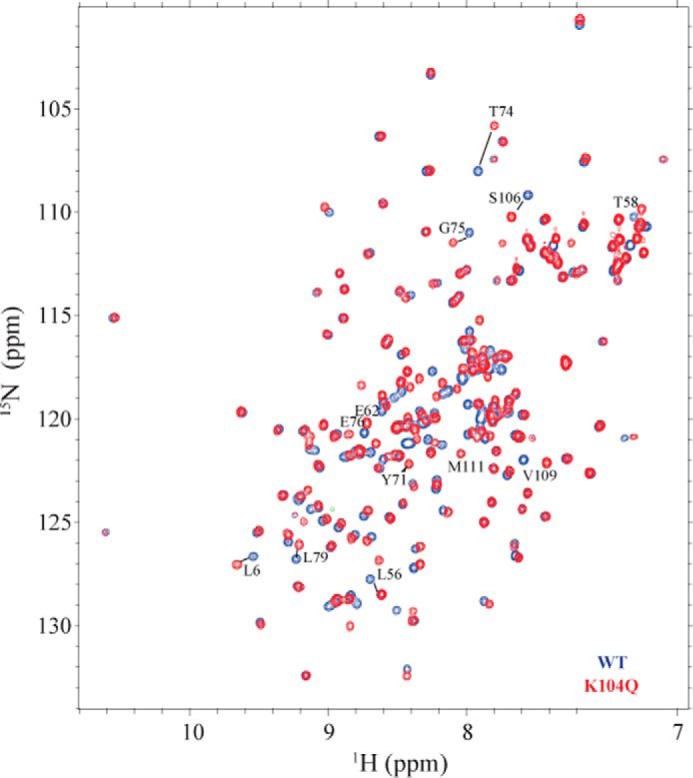
2D 1H-15N HSQC NMR spectral overlay of 15N-enriched KRAS K104Q (red) and WT (blue). Residues that show significant chemical shift perturbations (CSP > 0.15) are marked. Spectra were recorded on a Bruker Avance III 700 at 25 °C using 0.7 mm KRAS WT and KRAS K104Q bound to GDP.
FIGURE 4.
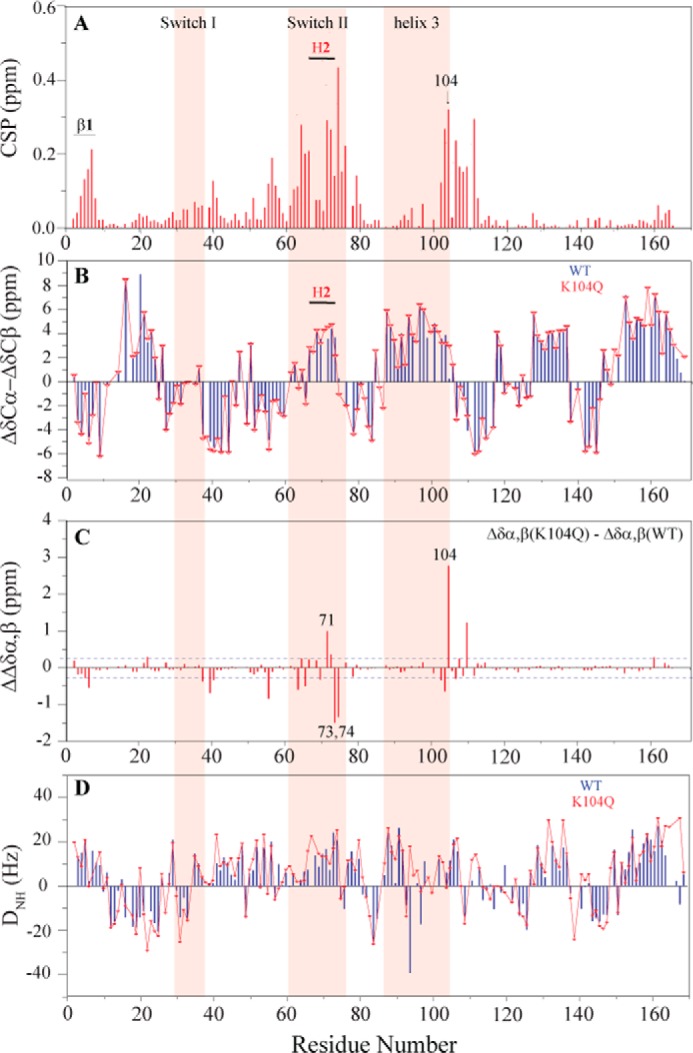
K104Q causes structural and dynamic perturbations primarily in helix 2 and helix 3. A, NMR analyses of peak shifts reveal that the K104Q mutation causes large CSPs in switch II and residues 102–110 in helix 3 but minor changes in β1 and switch I. CSP was calculated based on weighted average chemical shift (square root of ((Δσ 1H)2 + (Δσ 15N)2/25)) of WT and K104Q KRAS NH peaks in 1H-15N 2D HSQC NMR spectra. B, differences in secondary structure were determined from Cα and Cβ chemical shift indexing. C, the difference in chemical shift indexing between K104Q and WT KRAS indicates that the KRAS K104Q mutation perturbs the local conformation surrounding 104 in H3 and the later part of the α2 helix (residues 71–74) in switch II. D, NH RDCs were obtained from alignment in Pf1 bacteriophage with deuterium splitting of ∼15 Hz. Switch I, switch II, and H3 are highlighted in pink (ribbon). NMR spectra were recorded at 25 °C on KRAS WT and K104Q (0.7 mm) bound to GDP using a Bruker Avance III 700 NMR spectrometer.
Because a comparison of Cα and Cβ chemical shifts can be used to evaluate differences in secondary structure (17), we employed chemical shift indexing (CSI) to compare secondary structural differences between K104Q and WT KRAS (Fig. 4B). We found that overall, the secondary structure of WT KRAS is similar to K104Q with the exception of H2 and H3. In contrast to MD predictions that KRAS K104Q completely disrupts the structural integrity of the SWII region, CSI analyses (Fig. 4C) indicate loss of secondary structure for residues 70–74 at the C-terminal end of H2 and loss of helical content for residues 102–103 in helix 3 (H3) near the mutation site (Fig. 4B), which is consistent with the Tm decrease observed for K104Q. These secondary structural changes correlate with the large CSP observed for these residues (Fig. 4A). The perturbed regions revealed by NMR are highlighted in the 3D structure (Fig. 5B). Small distortions in secondary structure were also observed for the first half of SWII, β1, and the loop between SWI and SWII. However, SWI is unperturbed, consistent with our findings that binding of K104Q to effector RBDs is retained (Fig. 1C).
We also collected backbone NH residual dipolar coupling (RDC) data to generate long range distance constraints and evaluate changes in tertiary structure. As shown in Fig. 4D, comparison of the RDC profile for WT and KRAS K104Q indicates that the K104Q mutation does not significantly alter the overall tertiary structure of KRAS.
The KRAS K104Q Shows Backbone Dynamics Similar to Those of WT KRAS
The switch regions of RAS have been shown to sample multiple conformations in both the GDP- and GTP-bound states, as revealed by NMR (18–20). Conformational dynamic properties of these key regions are important for recognition of regulatory and effector proteins. Given the disruption in secondary structure within SWII, we evaluated whether the K104Q mutation alters backbone dynamic properties of KRAS, in the absence of regulatory proteins or effectors. We collected spin relaxation parameters R1 (Fig. 6A), R2 (Fig. 6B), and 15N-(1H) NOE (Fig. 6C) and fit them to spectral density functions for obtaining order parameters (21). The order parameter S2 provides a measure of restriction of motion over the picosecond to nanosecond range; whereas S2 = 1 suggests that the NH vector is rigidly fixed in the molecular frame, S2 = 0 is indicative of high mobility. Consistent with an increase in backbone motion due to structural perturbations at residues proximal to the site of mutation and the C-terminal end of H2, reduced S2 values were observed in the loop (positions 104–107) between H3 and β5 (Fig. 6D) as well as for residues 72–73 in SWII. A smaller decrease in S2 is observed for residues in SWI. We also observed that the K104Q mutation slightly enhances fast time scale backbone motions for the loop preceding H2 and residues 94–96 in H3. Taken together, these observations are consistent with our findings that H2 and H3 undergo small scale structural distortions and that the altered GEF and GAP activities observed for KRAS K104Q are probably due to changes in protein structure rather than the altered switch dynamics.
FIGURE 6.

Backbone 15N relaxation parameters for K104Q KRAS (red) and WT KRAS (blue). Shown from top to bottom, plotted against residue number, are longitudinal relaxation R1 (A), transverse relaxation R2 (B), (1H)-15N steady state heteronuclear NOE (Isaturated/Iunsaturated) (C), and order parameter S2 (D). Switch I, switch II, and H3 are highlighted in pink (ribbon) with secondary structure content represented at the top. Residue 104 at the end of H3 is labeled in red. All measurements were performed on KRAS WT and K104Q bound to GDP. NMR data were collected at 25 °C on 0.2 mm KRAS WT and K104Q samples using a Bruker Avance III 700 NMR spectrometer.
KRAS K104Q Does Not Affect Growth in MEFs
Because the KRAS K104Q mutation is impaired in GEF/GAP-mediated nucleotide cycling yet retains the ability to bind the RAF RBDs and PI3Kγ, we conducted studies in cell culture to determine the role of the K104Q mutation in KRAS-driven cellular growth. For these studies, we employed the use of Rasless MEFs, which lack endogenous Hras and Nras, and a conditional Kras allele that can be ablated by activation of a knocked-in 4-hydroxytamoxifen-inducible CreERT2 recombinase (22). 4-Hydroxytamoxifen treatment was done to induce Cre-mediated disruption of the Kras allele with blotting analyses to verify loss of endogenous Kras protein expression (Fig. 7A). These viable but non-proliferating cells were then used to assess the ability of either WT KRAS or KRAS K104Q to rescue loss of endogenous Kras and restore proliferation. We found that both K104Q and WT KRAS were equally capable of promoting MEF proliferation, as assessed by 3-(4,5-dimethylthiazol-2-yl)-2,5-diphenyltetrazolium bromide (MTT) growth assays (Fig. 7, B and C). These results suggest that KRAS acetylation may not impair the ability of KRAS to drive growth in a KRAS-dependent system. Based on our findings that K104Q is impaired in both GEF and GAP regulation, the disruption in GEF-mediated up-regulation by the K104Q mutation may be partially offset by a defect in GAP-mediated down-regulation of KRAS. Our findings that KRAS K104Q supports the growth of Rasless MEFs indicate that this mutant can still efficiently activate the RAF-MEK-ERK pathway, because this pathway is critical for the growth of Rasless MEFs (22).
FIGURE 7.

Exogenous KRAS K104Q expression supports the growth of Rasless MEFs. A, the anchorage-dependent growth rate was determined for MEFs deficient for all Ras isoforms with ectopically expressed KRAS WT or K104Q. B, cells were plated, and growth was monitored at days 1, 4, and 7 using the MTT viability assay. Data shown are representative of two independent experiments. Data are the mean ± S.D. (error bars) (n = 48). Student's t test determined that the difference was not significant (NS). C, quantitation of the average ± S.D. of three independent experiments for day 7. Data shown are the average of three independent experiments.
The KRAS K104Q Variant Retains RAS Activity, Downstream Signaling to Critical KRAS Effectors, and KRAS-driven Transformation in NIH 3T3 Cells
We next assessed the consequences of the K104Q substitution for the cellular activity of WT and G12V KRAS when transiently expressed in NIH 3T3 mouse fibroblasts. First, we performed a RAF-RBD pull-down analysis to assess the relative steady-state levels of activated GTP-bound KRAS protein. The K104Q substitution did not significantly alter the low level of GTP-bound protein for WT KRAS or the elevated level for KRAS G12V (Fig. 8). Similarly, KRAS G12V- and KRAS G12V/K104Q-expressing cells exhibited comparable levels of effector signaling, with equivalent levels of phosphorylated and activated ERK and AKT (Fig. 9) and morphologic transformation (Fig. 10). We conclude that mutation of Lys104 to glutamine (a putative acetylation mimetic) did not significantly alter KRAS function.
FIGURE 8.
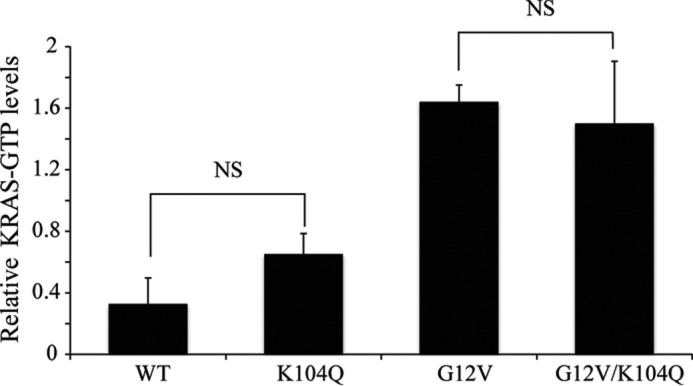
The K104Q mutation does not alter the levels of GTP-bound KRAS. CRAF RBD pull-down analyses were done using cell lysates from NIH 3T3 cells transiently expressing (72 h post-infection) the indicated HA epitope-tagged KRAS WT or mutant proteins. GST-CRAF RBD was used to monitor the level of GTP-bound KRAS protein, with total expression determined by anti-HA blot of total cellular lysates. Data shown are representative of three independent experiments. Quantitation of three experiments done in A (n = 3), with KRAS-GTP levels normalized to total HA-tagged KRAS levels. Error bars, S.E. Student's t test determined that the difference was not significant (NS).
FIGURE 9.
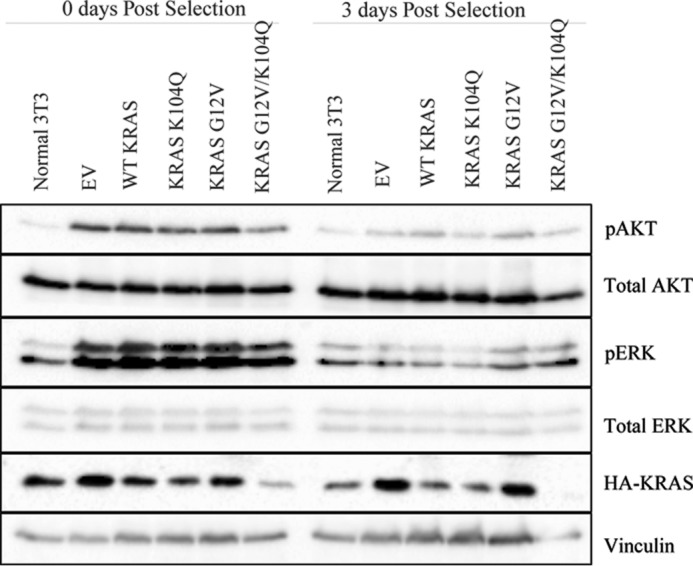
The K104Q mutation does not alter KRAS effector signaling in NIH 3T3 cells. Shown is Western blotting analysis of total cell lysates from mass populations of NIH 3T3 cells transiently infected (72 h) with retrovirus expression vectors encoding the indicated KRAS proteins. Blotting analyses with antibodies for total or phosphorylated and activated AKT and ERK (pAKT and pERK, respectively) were done. Data shown are representative of three independent experiments.
FIGURE 10.

The K104Q mutation does not alter wild type or activated KRAS morphologic transforming activity. Shown is a photomicrograph of mass populations of NIH 3T3 cells transiently (24 h) infected with pBabe-puro retrovirus expression vectors encoding the indicated KRAS proteins.
Discussion
Whereas GEF and GAP proteins play a critical role in regulating the activation state of RAS proteins, post-translational modifications within the G domain of RAS add another level of complexity. Lysine 104 in KRAS undergoes multiple PTMs, including acetylation (8) and ubiquitylation (23). Because oncogenic mutations at this position have not been identified in H-, N-, or KRAS, the role of this key residue has not been well characterized. Here, we show that both conservative and non-conservative mutations at KRAS lysine 104 (Gln, Arg, and Ala) impair SOScat-mediated nucleotide exchange. The K104Q mutant also impairs p120 RASGAPcat-mediated GTP hydrolysis. Consistent with these observations and our findings that KRAS K104Q shows a small decrease in thermal stability (1.5 °C), NMR structural analysis indicates that the K104Q mutation perturbs protein conformation proximal to the site of mutation in H3 as well as the end of H2 in SWII. Both of these regions are part of the RAS/SOScat binding interface (13). Residues 61–64 and 67 in SWII also form binding interactions with RAS GAPcat (24).
Residues within H2 and H3 of RAS form multiple interactions with SOS1cat in crystal structures of RAS proteins bound to SOS1 (PDB codes 1BKD, 1NVW, and 1XD2) (13, 25, 26). In particular, Arg102 in H3, next to the mutation site, forms contacts with Phe1010 and Asp1007 in SOScat. Valine 103 in H3 interacts with Ser881 in SOScat. Moreover, residues Gln70, Tyr71, and Arg73 at the end of H2 in RAS form multiple binding interactions with SOScat (27). Specifically, Tyr71 forms a hydrogen bond with Tyr912 of SOScat. Additionally, the side chain of Arg73 forms a hydrogen bond with the carboxyl oxygen of Asn879, and its aliphatic side chain forms additional interactions with the aromatic ring of Tyr884 in SOScat. Thus, structural distortions due to either mutation or PTM in H2 could potentially impair binding interactions to SOScat. Given the structural distortions observed for residues in SWII and H3, it is not surprising that binding to and subsequent nucleotide exchange ability of SOScat is impaired by the K104Q mutation (13, 27). In addition to SOS, residues in SWII, including Glu63 and Tyr64, make multiple contacts with RAS GAP proteins (PDB code 1WQ1) (24). Structural distortions at the end of SWII may cause more subtle changes in these key residues, resulting in the partial disruption of GAP-mediated GTP hydrolysis, observed for KRAS K104Q.
Consistent with our findings that the structure of the KRAS SWI region is not perturbed by the K104Q mutation, the KRAS K104Q mutant shows similar binding to isolated RAS effector RBDs, such as CRAF and BRAF, which bind exclusively through SWI (PDB code 4GON). A distinct effector, PI3Kγ, interacts with RAS primarily at SWI but also forms additional contacts with Tyr64 and Arg73 in SWII (PDB code 1HE8). Despite the structural perturbations induced by the KRAS K104Q mutation in the SWII region, KRAS K104Q retains binding to PI3Kγ. Whereas RAS interacts with a number of downstream effectors to regulate cellular growth, our analyses in Rasless MEFs indicate that the K104Q substitution does not prevent KRAS WT from driving proliferation in this biological context. Furthermore, our analyses in NIH 3T3 cells indicate that K104Q did not significantly alter the steady-state GTP-bound state or effector signaling and activation of ERK or AKT. These studies also indicate that KRAS G12V/K104Q is equally capable of driving morphologic transformation in NIH 3T3 cells. Hence, if K104Q functions as an acetylation mimetic, our studies indicate that this PTM may not significantly impair mutant RAS oncogenic function in these cells. Our findings differ from those described previously (8), where K104Q did reduce KRAS G12V stimulation of NIH 3T3 cell proliferation. Because these analyses evaluated morphologic and not growth transformation, our results cannot be directly compared with those of the previous study. One possible explanation for our different conclusions is that there exist multiple strains of NIH 3T3 cells and there are strain-specific differences in the mechanisms by which RAS drives growth transformation (28).
In summary, we found that the K104Q mutation in KRAS impaired GEF and GAP regulation but retained interactions with RAF and PI3Kγ RBDs. Our observations that signaling and cellular growth properties of K104Q are similar to those of WT KRAS suggest that the partial defect in GEF is at least partially offset by a defect in GAP regulation to retain RAS signaling. It is unclear whether the K104Q mutation or acetylation at this position perturbs interactions with all RAS GEFs. Whereas the CDC25 domains associated with RASGRP and RASGRF proteins show high homology (29, 30), allosteric regulation of these GEFs is quite distinct from that of SOS1. Moreover, crystal structures of these GEFs in complex with RAS are lacking.
Given the difficulties in preparation of various protein PTMs, mutations are often used as reagents to either mimic the desired modification or prevent the PTM. Although K104Q has been employed as an acetylation mimetic, this has yet to be truly validated. In fact, Lys104 acetylation has recently been reported to retain SOS activity (10). Computational analysis of the Ku protein revealed that acetylation of the Ku may not alter DNA interaction, yet a K-to-Q mutation decreased the binding compared with the WT protein (31). Indeed, the side chain of glutamine is quite distinct from an acetylated lysine in both size and composition, and it is unlikely that the K104Q mutant will be recognized by acetylation readers or deacetylases, such as SIRT2 and HDAC6, in a similar manner to native acetylated RAS (9). Although emerging data indicate that Lys-to-Gln mutations may not fully mimic acetylation, our studies do indicate that Lys104, a hot spot for RAS PTMs, plays a key role in maintaining the structural integrity of H3 and H2. Given the proposed role of H3 in RAS-mediated dimerization at the membrane, it is possible that KRAS acetylation may alter RAS dimerization (32). It will be important to evaluate each PTM (acetylation, ubiquitylation) separately to determine how the PTM may directly alter RAS activity as well as protein-protein interactions.
Experimental Procedures
Protein Expression and Purification
The human KRAS4B (C118S) cDNA sequence encoding the G domain (residues 1–169) was subcloned into a pET21 vector that adds an N-terminal 6-histidine tag and a TEV protease cleavage site for expression of recombinant protein in Escherichia coli BL21(DE3) cells (Novagen). Standard site-directed mutagenesis techniques were used to generate KRAS cDNA sequences encoding K104Q, K104A, and K104R missense mutants. The mutations were subsequently verified by DNA sequencing. E. coli BL21 (DE3) cells were grown at 37 °C in Luria-Bertani (LB) medium supplemented with ampicillin and chloramphenicol until A600 of ∼0.5. The temperature was then lowered to 18 °C, and KRAS expression was induced with 0.5 mm isopropyl-β-d-1-thiogalactopyranoside (IPTG) after 30 min. The cells were grown for an additional 15 h at 18 °C. The cells were then harvested and pelleted at 4000 rpm, resuspended in a lysis buffer (20 mm HEPES, 500 mm NaCl, 1 mm MgCl2, 20 mm imidazole, 5% glycerol (pH 7.75), and protease inhibitor phenylmethanesulfonyl fluoride (ACROS Organics)), and sonicated. The cell lysate was centrifuged at 15,000 rpm, and the supernatant was isolated. KRAS proteins were purified using nickel-nitrilotriacetic acid-agarose affinity chromatography (Qiagen), and the histidine tag was cleaved during overnight dialysis using TEV protease. If needed, KRAS proteins were further purified by size exclusion chromatography using a Sephadex G-75 column. Protein purity of >95% was obtained and verified by SDS-PAGE analysis.
The catalytic domains of human SOS1 (SOScat, residues 566–1049) (26) and p120-RASGAP (GAPcat, residues 764–981) were expressed in a pQlinkH vector (Addgene) and purified as described previously (33). cDNA sequences encoding the isolated RBDs of human BRAF (amino acids 149–232) and CRAF (amino acids 51–132) were subcloned in a pET28a bacterial expression vector encoding an N-terminal 6-histidine tag and TEV cleavage sites and subsequently expressed in BL21 (DE3) cells. The RBDs were purified using nickel-nitrilotriacetic acid affinity chromatography. The N-terminal tags were cleaved overnight with TEV protease. The tagless BRAF RBD was further purified using size exclusion chromatography (Sephadex G-75) and verified to be >95% pure by SDS-PAGE analysis. Purified PI3Kγ protein (amino acids 144–1102) containing a K802T substitution was kindly provided by Genentech.
Expression and Purification of His6-WT KRAS, K104Q, and Ac-Lys104 Proteins
His6-WT KRAS (residues 1–169, containing a 12-amino acid N-terminal non-cleavable His6 tag) and K104Q were expressed in LB medium as His6-tagged fusion proteins (pRSF-Duet, Merck Biosciences) in E. coli BL21 (DE3) cells as described (10). The E. coli culture was grown to an A600 of 0.6 (37 °C; 160 rpm), and protein expression was subsequently induced by the addition of 300 μm IPTG and further incubated overnight for 16 h (18 °C, 160 rpm). KRAS containing an amber stop codon at Lys104, was co-expressed with a pRSF-Duet-1 vector containing the synthetically evolved Methanosarcina barkeri MS tRNACUA (MbtRNACUA)/acetyl-lysyl-tRNA-synthetase (pAcKRS3) pair in Terrific broth medium. The E. coli BL21 (DE3) KRAS Ac-Lys104 culture was grown to an A600 of 0.6 at 37 °C at 160 rpm and then supplemented with 10 mm N-(ϵ)-acetyl-lysine (Chem-Impex International Inc.) and 20 mm nicotinamide to inhibit the E. coli deacetylase CobB. The temperature was then reduced to 18 °C. After 30 min, protein expression was induced by the addition of 300 μm IPTG. The cells were then grown for 16 h at 20 °C.
After expression, the cells were harvested (4000 × g, 20 min) and resuspended in a buffer containing 50 mm Tris/HCl, pH 7.4, 100 mm NaCl, 5 mm MgCl2, 2 mm β-mercaptoethanol, and 200 μm Pefabloc protease inhibitor mixture for His6-WT KRAS and K104Q. For His6-KRAS Ac-Lys104, a buffer containing 50 mm K2HPO4/KH2PO4, pH 6.4, was used. The cells were lysed by sonication, and the soluble fraction (20,000 × g, 45 min) was applied to an equilibrated Ni2+-nitrilotriacetic acid affinity chromatography column. The column was washed with a buffer containing 10 mm imidazole and 1 m NaCl, pH 6.4. The His6-KRAS proteins were eluted with an imidazole gradient of ∼10 column volumes covering 10–500 mm imidazole. The protein was concentrated by ultrafiltration and applied to a HiLoad 16/600 Superdex 75 pg size exclusion chromatography column (GE Healthcare).
RAS Nucleotide Dissociation and Hydrolysis Assays
The rate of nucleotide dissociation was measured by a fluorescence-based assay using MANT-GDP (BioLog, San Diego, CA) as reported previously (34, 35). Briefly, MANT-GDP-bound RAS was added to 1 ml of assay buffer (20 mm HEPES, 50 mm NaCl, 5 mm MgCl2, and 100 μm diethylenetriaminepentaacetic acid (DTPA), pH 7.4) to a final concentration of 1 μm, and nucleotide exchange was initiated by the addition of 1 mm GDP. MANT-GDP dissociation was measured as a change in fluorescence intensity over time (excitation, 365 nm; emission, 435 nm) (LS50B PerkinElmer Life Sciences luminescence spectrometer). Fluorescence data were fit in GraphPad Prism (GraphPad Software, La Jolla, CA) to a one-phase exponential decay curve. For GEF-mediated dissociation, 1 μm RAS and 1 μm SOScat were used. Results are plotted as the mean ± S.E. (n = 3).
Single-turnover GTP hydrolysis assays were performed as described previously (36) using the phosphate-binding protein Flippi 5U (Addgene) to detect inorganic phosphate released upon GTP hydrolysis (37). Flippi 5U was purified as described previously (37). All buffers were made phosphate-free by dialysis with 1 unit of nucleoside phosphorylase (Sigma) and 2 mm inosine (Sigma). For GAP-mediated hydrolysis, 10 μm RAS was used with 0.05 μm p120-RASGAPcat (1:200). The ratio of fluorescence emission was measured at 485 and 530 nm with an excitation of 420 nm on a SpectraMax M5 microplate reader (Molecular Devices). Hydrolysis curves were fit in GraphPad Prism to a one-phase exponential association curve. Results are plotted as the mean ± S.E. (n = 2).
Effector Binding Assay
KRAS was preloaded with MANT-GMPPCP using methods described previously (38). For quantitative binding to CRAF and BRAF RBDs and PI3Kγ (amino acids 144–1102, containing a K802T substitution), MANT-GMPPCP-bound KRAS was incubated with the desired effector at a range of concentrations, in a buffer containing 50 mm HEPES, 50 mm NaCl, and 5 mm MgCl2 at pH 7.4. Nucleotide dissociation was initiated by the addition of a 1000-fold molar excess of unlabeled nucleotide, and the rate of dissociation was determined by monitoring the change in fluorescence of the MANT-GMPPCP-loaded protein (excitation and emission wavelengths of 335 and 485 nm, respectively) using a SpectraMax M2 plate reader (34). Each nucleotide dissociation curve was fit to a one-phase single exponential to determine kobs. The dissociation rates were plotted against the effector concentrations and fit as described previously (39) to determine the equilibrium dissociation constant (KD).
Tm Measurements Using CD
CD data were collected on a Jasco J-815 CD spectrometer. Far-UV CD scans were collected using a 1-mm cuvette at a concentration of 20 μm KRAS protein in a buffer containing 10 mm KH2PO43−/K2HPO43−, 500 μm MgSO4, pH 7.2, at 20 °C. Thermal melts were obtained over a temperature range of 20–95 °C using a temperature increment of 2 °C/min. The CD signal was measured at 222 nm. Tm values were calculated by fitting the thermal denaturation data using non-linear fitting. Results are plotted as the mean ± S.D. (n = 3).
NMR Analyses
For NMR measurements, 13C,15N-enriched KRAS proteins were exchanged into NMR buffer (20 mm Tris-maleate (pH 6.5), 40 mm NaCl, 5 mm MgCl2, and 20 μm GDP, 5% D2O). NMR spectra were acquired at 25 °C on a Bruker Avance III 700 NMR spectrometer. 2D 1H-15N HSQC experiments were recorded for both WT and K104Q KRAS bound to GDP, with 1024 and 256 complex points in the direct and indirect dimensions, respectively, 32 scans/increment, and a recovery delay of 1.0 s. Spectral widths used were 9803.992 Hz (1H) and 2553.626 (15N) Hz. Average 1H-15N chemical shift perturbations were calculated according to the square root of ((Δσ 1H)2 + (Δσ 15N)2/25), where Δσ 1H and Δσ 15N are the observed changes in 1H and 15N chemical shifts.
Backbone resonance assignments of WT KRAS were obtained by analysis of 3D HNCA, HNCACB, CBCA(CO)NH, HNCO, and HN(CO)CA spectra recorded on 13C,15N-labeled WT KRAS bound to GDP. The assignment of Cα, Cβ, CO, N, and HN chemical shifts was obtained by an iterative procedure using the program MARS (40) and manual inspection. Backbone assignment of 13C,15N-enriched K104Q KRAS (0.8 mm) was obtained by collecting 3D HNCA and HNCACB data and using WT KRAS assignments. For CSI, ΔCα and ΔCβ values were calculated by subtracting experimental chemical shifts of Cα and Cβ from random coil values obtained from the ncIDP server (41). The value of ΔCα-ΔCβ was calculated to cancel the systematic offset contained in ΔCα and ΔCβ and then used to predict RAS secondary structure. For 15N-based backbone relaxation experiments, 15N longitudinal (R1) and transverse relaxation (R2) rates and 1H-15N steady-state NOE were measured on 200 μm 15N WT and K104Q KRAS-GDP samples in NMR buffer at 700 MHz. Relaxation delays were as follows: R1 measurements, 0.01, 0.1, 0.2, 0.3, 0.4, 0.6, 0.8, 1.0, 1.2, and 1.4 s; R2 experiments, 15.01, 45.03, 165.11, 30.02, 135.09, 60.04, 105.07, 75.05, and 90.06 ms. The 15N-(1H) NOE and reference spectra were recorded in an interleaved manner with a 5.5-s 1H saturation time and the equivalent recovery time for the reference experiment. Order parameters (S2) were calculated by fitting relaxation parameters R1, R2, and 15N-(1H) NOE using the programs FAST ModelFree (42) and ModelFree (43). Backbone NH RDCs were measured using Pf1 bacteriophage (20 mg/ml) (ASLA Biotech) with deuterium splitting of 15 Hz. The 1JNH constant was measured using an interleaved HSQC-TROSY. Spectra were processed and analyzed using NMRPipe (NIDDK, National Institutes of Health) and Sparky (University of California, San Francisco).
Cell Lines
NIH 3T3 mouse fibroblasts were obtained originally from Dr. Geoffrey Cooper (Boston University) and were maintained in Dulbecco's modified Eagle's medium (DMEM) supplemented with 10% calf serum (Colorado Calf Serum). Mouse embryonic fibroblasts devoid of endogenous Ras alleles (Rasless MEFs) were obtained from Dr. Mariano Barbacid (CNIO Madrid) and were maintained in DMEM supplemented with 10% calf serum (22).
Rasless MEF Growth
Primary mouse embryonic fibroblast (MEFs; DU315) devoid of all endogenous RAS protein expression (Hras−/−; Nras−/−; Kraslox/lox; RERTert/ert) were generated and characterized previously (22) and were obtained from Dr. Mariano Barbacid (CNIO, Madrid, Spain). In brief, DU315 cells were treated with 600 nm 4-hydroxytamoxifen to activate translocation of the estrogen receptor-fused Cre to the nucleus for removal of the endogenous (floxed) Kras. Cells were arrested in the G1 phase after 9–11 days. Blot analyses were done to verify loss of endogenous KRAS protein expression. Cell proliferation resumed after the delivery of a KRAS transgene to the cells using lentiviral transduction. Transduced cells were selected using blasticidin and expanded to generate cell line pools dependent on expression of the exogenous transgene for continuous proliferation.
Anchorage-dependent Growth Assays
To monitor proliferation rates, cells were plated onto a 96-well plate at a density of 2000 cells/well. After 24, 96, and 168 h, cell proliferation was monitored using the MTT colorimetric viability assay, and absorbance was measured at 550 nm to quantify cell number.
NIH 3T3 Infection
NIH 3T3 cells were infected with the pBabe-puro retrovirus expression vectors containing cDNA sequences encoding human KRAS4B (WT, K104Q, 12V, and 12V/K104Q). Post-infection, the cultures were maintained in complete growth medium supplemented with puromycin to select for stably infected cells. Samples were collected immediately after 72 h post-selection and analyzed for signaling via Western blotting. The drug-resistant cells were further passaged and maintained in puromycin-containing growth medium. Light microscopy images were collected at 24 h (Nikon Eclipse TS100) post-selection to monitor transformation.
RAS-GTP Pull-down Assays
NIH-3T3 cells were infected with retrovirus containing cDNA for KRAS (WT, K104Q, 12V, 12V/K104Q), followed by selection in puromycin-containing growth medium, to establish mass populations of drug-resistant cells. Determination of the steady-state GTP-bound levels of each KRAS protein was performed using standard pull-down analyses as described by us previously (44). Briefly, drug-resistant mass populations of cells maintained in complete calf serum-containing growth medium were collected 72 h post-infection for analyses. The cultures were lysed in detergent buffer, and the total cell lysates were then incubated with recombinant glutathione S-transferase (GST)-tagged CRAF RBD protein, followed by Protein G-Sepharose beads, to isolate the bound KRAS-GTP. After separation by SDS-PAGE, the level of KRAS-GTP was determined by blot analyses with anti-KRAS antibody. Total FLAG epitope-tagged KRAS was determined by blot analyses with anti-FLAG antibody using the total cellular lysate.
Retrovirus Production
Retrovirus was produced in HEK-293T cells via transfection of pBABE-puro target vector and pCL-10A1 packaging vector with calcium chloride. Cells were allowed to produce retrovirus for 24 h. Retrovirus was then harvested and placed on target cells in the presence of 2 μg/ml Polybrene. Cells were incubated with retrovirus for 8 h. Fresh medium was then placed on the cells, and antibiotic selection was applied 24 h later (2 μg/ml puromycin).
Western Blotting
Cells maintained in complete growth medium were lysed in 1% Nonidet P-40 buffer (50 mm Tris, 150 mm NaCl, 10 mm MgCl2, 10% glycerol, 1% Nonidet P-40, 0.25% sodium deoxycholate, pH 7.4) and resolved using SDS-PAGE analysis. To determine the levels of effector signaling, Western blotting analyses were done using phospho-specific antibodies to ERK1/2(Thr202/Tyr204) and AKT(Ser473), with antibodies recognizing total ERK1/2 and AKT to control for total protein expression (Cell Signaling Technologies). Antibodies for KRAS (OP24, EMD Millipore) and anti-HA epitope (16B12, Covance) were used to determine the expression levels of endogenous and exogenous KRAS, respectively. An antibody for vinculin (Sigma-Aldrich) was used to verify equivalent loading of cellular proteins.
Author Contributions
G. Y., S. K., S. D. G., N. K., M. H., and L. G. conducted the experiments and analyzed the data; G. Y., S. L. C., S. D. G., M. L., R. K. B., and C. J. D. wrote the paper; S. L. C., S. D. G., R. K. B., and C. J. D. designed the experiments.
Acknowledgments
We thank Qi Zhang, Bo Zhao, and Paul Sapienza for discussion on NMR experiments. We thank Jerry Zhang and Ryan Thurman for advice in conducting the effector binding assay. We thank Min-Qi Lu for help with sample preparation and Greg Young for assistance in NMR data collection. We thank Mariano Barbacid for the Rasless MEFs.
This work was supported by National Institutes of Health Grants R01-GM106227 and PO1-CA5104986 (to S. L. C.) and P01-CA5104986, R01-CA042978, and U01-CA199235 (to C. J. D.) and Heisenberg Program of the Deutsche Forschungsgemeinschaft (DFG) Grant LA2984/3-1 (to M. L.). The authors declare that they have no conflicts of interest with the contents of this article. The content is solely the responsibility of the authors and does not necessarily represent the official views of the National Institutes of Health.
- GEF
- guanine nucleotide exchange factors
- GAP
- GTPase-activating protein
- SWI and SWII
- switch I and II, respectively
- G domain
- guanine nucleotide binding domain
- PTM
- post-translational modification
- MD
- molecular dynamics
- MANT-GDP
- 2′-(or-3′)-O-(N-methylanthraniloyl) guanosine 5′-diphosphate, disodium salt
- MANT-GMPPCP
- 2′-(or-3′)-O-(N-methylanthraniloyl)-β:γ-imidoguanosine 5′-triphosphate, trisodium salt
- RBD
- RAS binding domain
- HSQC
- heteronuclear single quantum coherence
- CSI
- chemical shift indexing
- RDC
- residual dipolar coupling
- PDB
- Protein Data Bank
- IPTG
- isopropyl-β-d-1-thiogalactopyranoside
- MTT
- 3-(4,5-dimethylthiazol-2-yl)-2,5-diphenyltetrazolium bromide
- MEF
- mouse embryo fibroblast
- TEV
- tobacco etch virus.
References
- 1. Geyer M., and Wittinghofer A. (1997) GEFs, GAPs, GDIs and effectors: taking a closer (3D) look at the regulation of Ras-related GTP-binding proteins. Curr. Opin. Struct. Biol. 7, 786–792 [DOI] [PubMed] [Google Scholar]
- 2. Vigil D., Cherfils J., Rossman K. L., and Der C. J. (2010) Ras superfamily GEFs and GAPs: validated and tractable targets for cancer therapy? Nat. Rev. Cancer 10, 842–857 [DOI] [PMC free article] [PubMed] [Google Scholar]
- 3. Cox A. D., Fesik S. W., Kimmelman A. C., Luo J., and Der C. J. (2014) Drugging the undruggable RAS: mission possible? Nat. Rev. Drug Discov. 13, 828–851 [DOI] [PMC free article] [PubMed] [Google Scholar]
- 4. Stephen A. G., Esposito D., Bagni R. K., and McCormick F. (2014) Dragging ras back in the ring. Cancer Cell 25, 272–281 [DOI] [PubMed] [Google Scholar]
- 5. Ahearn I. M., Haigis K., Bar-Sagi D., and Philips M. R. (2011) Regulating the regulator: post-translational modification of RAS. Nat. Rev. Mol. Cell Biol. 13, 39–51 [DOI] [PMC free article] [PubMed] [Google Scholar]
- 6. Sasaki A. T., Carracedo A., Locasale J. W., Anastasiou D., Takeuchi K., Kahoud E. R., Haviv S., Asara J. M., Pandolfi P. P., and Cantley L. C. (2011) Ubiquitination of K-Ras enhances activation and facilitates binding to select downstream effectors. Sci. Signal. 4, ra13. [DOI] [PMC free article] [PubMed] [Google Scholar]
- 7. Baker R., Wilkerson E. M., Sumita K., Isom D. G., Sasaki A. T., Dohlman H. G., and Campbell S. L. (2013) Differences in the regulation of K-Ras and H-Ras isoforms by monoubiquitination. J. Biol. Chem. 288, 36856–36862 [DOI] [PMC free article] [PubMed] [Google Scholar]
- 8. Yang M. H., Nickerson S., Kim E. T., Liot C., Laurent G., Spang R., Philips M. R., Shan Y., Shaw D. E., Bar-Sagi D., Haigis M. C., and Haigis K. M. (2012) Regulation of RAS oncogenicity by acetylation. Proc. Natl. Acad. Sci. U.S.A. 109, 10843–10848 [DOI] [PMC free article] [PubMed] [Google Scholar]
- 9. Yang M. H., Laurent G., Bause A. S., Spang R., German N., Haigis M. C., and Haigis K. M. (2013) HDAC6 and SIRT2 regulate the acetylation state and oncogenic activity of mutant K-RAS. Mol. Cancer Res. 11, 1072–1077 [DOI] [PMC free article] [PubMed] [Google Scholar]
- 10. Knyphausen P., Lang F., Baldus L., Extra A., and Lammers M. (2016) Insights into K-Ras 4B regulation by post-translational lysine acetylation. Biol. Chem. 397, 1071–1085 [DOI] [PubMed] [Google Scholar]
- 11. Wittinghofer A., and Pai E. F. (1991) The structure of Ras protein: a model for a universal molecular switch. Trends Biochem. Sci. 16, 382–387 [DOI] [PubMed] [Google Scholar]
- 12. McCormick F., and Wittinghofer A. (1996) Interactions between Ras proteins and their effectors. Curr. Opin. Biotechnol. 7, 449–456 [DOI] [PubMed] [Google Scholar]
- 13. Margarit S. M., Sondermann H., Hall B. E., Nagar B., Hoelz A., Pirruccello M., Bar-Sagi D., and Kuriyan J. (2003) Structural evidence for feedback activation by Ras·GTP of the Ras-specific nucleotide exchange factor SOS. Cell 112, 685–695 [DOI] [PubMed] [Google Scholar]
- 14. Mott H. R., and Owen D. (2015) Structures of Ras superfamily effector complexes: what have we learnt in two decades? Crit. Rev. Biochem. Mol. Biol. 50, 85–133 [DOI] [PubMed] [Google Scholar]
- 15. Wittinghofer A., and Vetter I. R. (2011) Structure-function relationships of the G domain, a canonical switch motif. Annu. Rev. Biochem. 80, 943–971 [DOI] [PubMed] [Google Scholar]
- 16. Sattler M., Schleucher J., and Griesinger C. (1999) Heteronuclear multidimensional NMR experiments for the structure determination of proteins in solution employing pulsed field gradients. Prog. Nucl. Mag. Res. Spectr. 34, 93–158 [Google Scholar]
- 17. Wishart D. S., and Sykes B. D. (1994) The 13C chemical-shift index: a simple method for the identification of protein secondary structure using 13C chemical-shift data. J. Biomol. NMR 4, 171–180 [DOI] [PubMed] [Google Scholar]
- 18. Kraulis P. J., Domaille P. J., Campbell-Burk S. L., Van Aken T., and Laue E. D. (1994) Solution structure and dynamics of ras p21·GDP determined by heteronuclear three- and four-dimensional NMR spectroscopy. Biochemistry 33, 3515–3531 [DOI] [PubMed] [Google Scholar]
- 19. Terada T., Ito Y., Shirouzu M., Tateno M., Hashimoto K., Kigawa T., Ebisuzaki T., Takio K., Shibata T., Yokoyama S., Smith B. O., Laue E. D., and Cooper J. A. (1999) Nuclear magnetic resonance and molecular dynamics studies on the interactions of the Ras-binding domain of Raf-1 with wild-type and mutant Ras proteins. J. Mol. Biol. 286, 219–232 [DOI] [PubMed] [Google Scholar]
- 20. Long D., Marshall C. B., Bouvignies G., Mazhab-Jafari M. T., Smith M. J., Ikura M., and Kay L. E. (2013) A comparative CEST NMR study of slow conformational dynamics of small GTPases complexed with GTP and GTP analogues. Angew. Chem. Int. Ed. Engl. 52, 10771–10774 [DOI] [PubMed] [Google Scholar]
- 21. Lipari G., and Szabo A. (1982) Model-free approach to the interpretation of nuclear magnetic resonance relaxation in macromolecules. 1. Theory and range of validity. J. Am. Chem. Soc. 104, 4546–4559 [Google Scholar]
- 22. Drosten M., Dhawahir A., Sum E. Y., Urosevic J., Lechuga C. G., Esteban L. M., Castellano E., Guerra C., Santos E., and Barbacid M. (2010) Genetic analysis of Ras signalling pathways in cell proliferation, migration and survival. EMBO J. 29, 1091–1104 [DOI] [PMC free article] [PubMed] [Google Scholar]
- 23. Sasaki A. T., Carracedo A., Locasale J. W., Anastasiou D., Takeuchi K., Kahoud E. R., Haviv S., Asara J. M., Pandolfi P. P., and Cantley L. C. (2011) Ubiquitination of K-Ras enhances activation and facilitates binding to select downstream effectors. Sci. Signal. 4, ra13. [DOI] [PMC free article] [PubMed] [Google Scholar]
- 24. Scheffzek K., Ahmadian M. R., Kabsch W., Wiesmüller L., Lautwein A., Schmitz F., and Wittinghofer A. (1997) The Ras-RasGAP complex: structural basis for GTPase activation and its loss in oncogenic Ras mutants. Science 277, 333–338 [DOI] [PubMed] [Google Scholar]
- 25. Boriack-Sjodin P. A., Margarit S. M., Bar-Sagi D., and Kuriyan J. (1998) The structural basis of the activation of Ras by Sos. Nature 394, 337–343 [DOI] [PubMed] [Google Scholar]
- 26. Sondermann H., Soisson S. M., Boykevisch S., Yang S. S., Bar-Sagi D., and Kuriyan J. (2004) Structural analysis of autoinhibition in the Ras activator Son of sevenless. Cell 119, 393–405 [DOI] [PubMed] [Google Scholar]
- 27. Hall B. E., Yang S. S., Boriack-Sjodin P. A., Kuriyan J., and Bar-Sagi D. (2001) Structure-based mutagenesis reveals distinct functions for Ras switch 1 and switch 2 in Sos-catalyzed guanine nucleotide exchange. J. Biol. Chem. 276, 27629–27637 [DOI] [PubMed] [Google Scholar]
- 28. Khosravi-Far R., White M. A., Westwick J. K., Solski P. A., Chrzanowska-Wodnicka M., Van Aelst L., Wigler M. H., and Der C. J. (1996) Oncogenic Ras activation of Raf/mitogen-activated protein kinase-independent pathways is sufficient to cause tumorigenic transformation. Mol. Cell. Biol. 16, 3923–3933 [DOI] [PMC free article] [PubMed] [Google Scholar]
- 29. Freedman T. S., Sondermann H., Friedland G. D., Kortemme T., Bar-Sagi D., Marqusee S., and Kuriyan J. (2006) A Ras-induced conformational switch in the Ras activator Son of sevenless. Proc. Natl. Acad. Sci. U.S.A. 103, 16692–16697 [DOI] [PMC free article] [PubMed] [Google Scholar]
- 30. Iwig J. S., Vercoulen Y., Das R., Barros T., Limnander A., Che Y., Pelton J. G., Wemmer D. E., Roose J. P., and Kuriyan J. (2013) Structural analysis of autoinhibition in the Ras-specific exchange factor RasGRP1. Elife 2, e00813. [DOI] [PMC free article] [PubMed] [Google Scholar]
- 31. Fujimoto H., Higuchi M., Koike M., Ode H., Pinak M., Bunta J. K., Nemoto T., Sakudoh T., Honda N., Maekawa H., Saito K., and Tsuchida K. (2012) A possible overestimation of the effect of acetylation on lysine residues in KQ mutant analysis. J. Comput. Chem. 33, 239–246 [DOI] [PubMed] [Google Scholar]
- 32. Spencer-Smith R., Koide A., Zhou Y., Eguchi R. R., Sha F., Gajwani P., Santana D., Gupta A., Jacobs M., Herrero-Garcia E., Cobbert J., Lavoie H., Smith M., Rajakulendran T., Dowdell E., et al. (2017) Inhibition of RAS function through targeting an allosteric regulatory site. Nat. Chem. Biol. 13, 62–68 [DOI] [PMC free article] [PubMed] [Google Scholar]
- 33. Baker R., Lewis S. M., Sasaki A. T., Wilkerson E. M., Locasale J. W., Cantley L. C., Kuhlman B., Dohlman H. G., and Campbell S. L. (2013) Site-specific monoubiquitination activates Ras by impeding GTPase-activating protein function. Nat. Struct. Mol. Biol. 20, 46–52 [DOI] [PMC free article] [PubMed] [Google Scholar]
- 34. Lenzen C., Cool R. H., and Wittinghofer A. (1995) Analysis of intrinsic and CDC25-stimulated guanine nucleotide exchange of p21ras-nucleotide complexes by fluorescence measurements. Methods Enzymol. 255, 95–109 [DOI] [PubMed] [Google Scholar]
- 35. Lenzen C., Cool R. H., Prinz H., Kuhlmann J., and Wittinghofer A. (1998) Kinetic analysis by fluorescence of the interaction between Ras and the catalytic domain of the guanine nucleotide exchange factor Cdc25Mm. Biochemistry 37, 7420–7430 [DOI] [PubMed] [Google Scholar]
- 36. Shutes A., and Der C. J. (2006) Real-time in vitro measurement of intrinsic and Ras GAP-mediated GTP hydrolysis. Methods Enzymol. 407, 9–22 [DOI] [PubMed] [Google Scholar]
- 37. Gu H., Lalonde S., Okumoto S., Looger L. L., Scharff-Poulsen A. M., Grossman A. R., Kossmann J., Jakobsen I., and Frommer W. B. (2006) A novel analytical method for in vivo phosphate tracking. FEBS Lett. 580, 5885–5893 [DOI] [PMC free article] [PubMed] [Google Scholar]
- 38. Burd C. E., Liu W., Huynh M. V., Waqas M. A., Gillahan J. E., Clark K. S., Fu K., Martin B. L., Jeck W. R., Souroullas G. P., Darr D. B., Zedek D. C., Miley M. J., Baguley B. C., Campbell S. L., and Sharpless N. E. (2014) Mutation-specific RAS oncogenicity explains NRAS codon 61 selection in melanoma. Cancer Discov. 4, 1418–1429 [DOI] [PMC free article] [PubMed] [Google Scholar]
- 39. Herrmann C., Horn G., Spaargaren M., and Wittinghofer A. (1996) Differential interaction of the ras family GTP-binding proteins H-Ras, Rap1A, and R-Ras with the putative effector molecules Raf kinase and Ral-guanine nucleotide exchange factor. J. Biol. Chem. 271, 6794–6800 [DOI] [PubMed] [Google Scholar]
- 40. Jung Y. S., and Zweckstetter M. (2004) Mars: robust automatic backbone assignment of proteins. J. Biomol. NMR 30, 11–23 [DOI] [PubMed] [Google Scholar]
- 41. Tamiola K., Acar B., and Mulder F. A. (2010) Sequence-specific random coil chemical shifts of intrinsically disordered proteins. J. Am. Chem. Soc. 132, 18000–18003 [DOI] [PubMed] [Google Scholar]
- 42. Cole R., and Loria J. P. (2003) FAST-Modelfree: a program for rapid automated analysis of solution NMR spin-relaxation data. J. Biomol. NMR 26, 203–213 [DOI] [PubMed] [Google Scholar]
- 43. Mandel A. M., Akke M., and Palmer A. G. 3rd (1995) Backbone dynamics of Escherichia coli ribonuclease HI: correlations with structure and function in an active enzyme. J. Mol. Biol. 246, 144–163 [DOI] [PubMed] [Google Scholar]
- 44. Lambert J. M., Lambert Q. T., Reuther G. W., Malliri A., Siderovski D. P., Sondek J., Collard J. G., and Der C. J. (2002) Tiam1 mediates Ras activation of Rac by a PI(3)K-independent mechanism. Nat. Cell Biol. 4, 621–625 [DOI] [PubMed] [Google Scholar]