ABSTRACT
Sensitive and accurate hepatitis B virus (HBV) DNA detection and quantification are essential to diagnose HBV infection, establish the prognosis of HBV-related liver disease, and guide the decision to treat and monitor the virological response to antiviral treatment and the emergence of resistance. Currently available HBV DNA platforms and assays are generally designed for batching multiple specimens within an individual run and require at least one full day of work to complete the analyses. The aim of this study was to evaluate the ability of the newly developed, fully automated, one-step Aptima HBV Quant assay to accurately detect and quantify HBV DNA in a large series of patients infected with different HBV genotypes. The limit of detection of the assay was estimated to be 4.5 IU/ml. The specificity of the assay was 100%. Intra-assay and interassay coefficients of variation ranged from 0.29% to 5.07% and 4.90% to 6.85%, respectively. HBV DNA levels from patients infected with HBV genotypes A to F measured with the Aptima HBV Quant assay strongly correlated with those measured by two commercial real-time PCR comparators (Cobas AmpliPrep/Cobas TaqMan HBV test, version 2.0, and Abbott RealTime HBV test). In conclusion, the Aptima HBV Quant assay is sensitive, specific, and reproducible and accurately quantifies HBV DNA in plasma samples from patients with chronic HBV infections of all genotypes, including patients on antiviral treatment with nucleoside or nucleotide analogues. The Aptima HBV Quant assay can thus confidently be used to detect and quantify HBV DNA in both clinical trials with new anti-HBV drugs and clinical practice.
KEYWORDS: HBV DNA, HBV monitoring, real-time TMA, hepatitis B virus
INTRODUCTION
Hepatitis B virus (HBV) infection is a major cause of chronic liver disease that affects nearly 250 million individuals worldwide (1). Chronic HBV infection may lead to cirrhosis, decompensated liver failure, and hepatocellular carcinoma (HCC), all of which carry significant morbidity and mortality, with more than 700,000 HBV-related deaths each year (2, 3). Indeed, HBV is the main cause of HCC, one of the most frequent cancers in sub-Saharan Africa and the leading cause of cancer deaths in West African males (4). Despite the availability of an effective vaccine and of potent antiviral drugs, chronic hepatitis B remains a global public health concern, with considerable geographic variations of its prevalence. Despite a steadily decreasing trend in the Northern Hemisphere in the past 15 years, the HBV prevalence remains high in some countries of Africa and Eastern Europe (5, 6). Current HBV treatment is based on the lifelong administration of nucleoside or nucleotide analogues that maintain undetectable HBV DNA levels in the long term and substantially improve the prognosis of HBV-related liver disease, while decreasing the incidence of its complications, including HCC (7, 8). Current therapeutic research aims at developing strategies that lead to HBsAg clearance and possible anti-HBs antibody seroconversion, the so-called functional cure of HBV infection.
The use of sensitive nucleic acid amplification technologies is recommended by international Clinical Practice Guidelines for HBV DNA detection and quantification in clinical practice (9, 10). These techniques are now widely used in clinical virology laboratories. HBV DNA assays are fully or partly automated. With a broad range of linear quantification, a limit of detection (LOD) on the order of 10 to 20 IU/ml, and identical LODs and lower limits of quantification (LLOQs) for the most recent assays, these techniques are well suited to clinical needs (11). Among them, the Cobas AmpliPrep/Cobas TaqMan HBV, version 2.0 (CAP/CTM HBV 2.0), test (Roche Molecular Systems, Pleasanton, CA) and Abbott RealTime HBV assay (Abbott Molecular, Des Plaines, IL) are the most widely used assays. They show satisfactory performances for HBV DNA detection and quantification in clinical practice (12–14). However, currently available HBV DNA platforms and assays are generally designed for batch testing of multiple specimens within a run, so that many laboratories struggle to provide results within a 1-day window.
The Aptima HBV Quant assay (Hologic Inc., San Diego, CA) is a transcription-mediated amplification (TMA)-based dual-target assay making use of the fully automated Panther system, which eliminates the need for batch processing of samples and automates all aspects of nucleic acid testing in a single step. Thus, only 2.5 h is required to obtain the first 5 results, and from then, 5 more results are generated every 5 min. The aim of the present study was to evaluate the ability of the Aptima HBV Quant assay to accurately detect and quantify HBV DNA in a large series of patients infected with HBV genotypes frequently encountered in clinical practice.
RESULTS
Specificity.
To assess the specificity of the Aptima HBV Quant assay, 206 serum samples collected from HBV-seronegative subjects and patients with resolved HBV infection (group 1) were tested. HBV DNA was undetectable in the 206 clinical specimens, resulting in a specificity of 100% (95% confidence interval [95%CI], 98.2% to 100%).
Analytical sensitivity.
To estimate the analytical sensitivity of the Aptima HBV Quant assay, the AcroMetrix HBV panel (a plasma source) was serially diluted from 50 IU/ml to 1.56 IU/ml. Then, 20 replicates of each dilution were tested in the same experiment, as recommended by the Clinical and Laboratory Standards Institute (15). The detection rates were 100% for replicates at 50 IU/ml, 25 IU/ml, 12.5 IU/ml, and 6.25 IU/ml and 75% to 85% for replicates at 3.12 IU/ml and 1.56 IU/ml. The LOD for the Aptima HBV Quant assay was estimated to be 4.5 IU/ml (95%CI, 3.1 to 48.9) in plasma. This result is in keeping with the manufacturer's stated LOD for the Aptima HBV Quant assay in plasma (5.6 IU/ml).
Precision and reproducibility.
To assess precision (intra-assay reproducibility), each of the 7 members of the AcroMetrix HBV panel was tested three times in the same experiment. The coefficients of variation (CV) varied from 0.29% to 5.07%. To assess the interassay reproducibility, both the low and the high positive controls (LPC and HPC) from the kit were tested in 15 different experiments. The CVs were 6.85% and 4.90% for the LPC and HPC, respectively.
Linear quantification of a standard panel.
To evaluate the linearity of HBV DNA quantification, each member of the AcroMetrix HBV panel was tested three times in the same experiment with the Aptima HBV Quant assay, and the measured values were compared to the expected ones. A significant relationship was found between the average measured and expected HBV DNA levels (r = 0.9975; P < 0.0001; linear regression equation, y = 1.001 × −0.2808) (Fig. 1). The difference between the average measured values and the expected ones varied between 0.07 and 0.53 log IU/ml.
FIG 1.
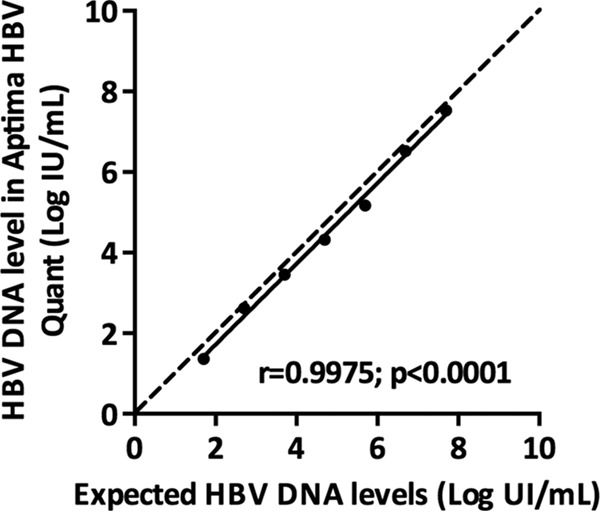
Quantification of HBV DNA levels in a commercial panel containing 5 × 101 (1.7 log) to 5 × 10⁷ (7.7 log) HBV DNA IU/ml (AcroMetrix HBV panel; Thermo Fisher Scientific, Fremont, CA) with the Aptima HBV Quant assay. The average measured values are shown as a function of the expected values. The dashed line represents the equality line.
Influence of the HBV genotype, BCP and precore mutations, and amino acid substitutions in the major hydrophilic region (MHR) of HBsAg on HBV DNA quantification.
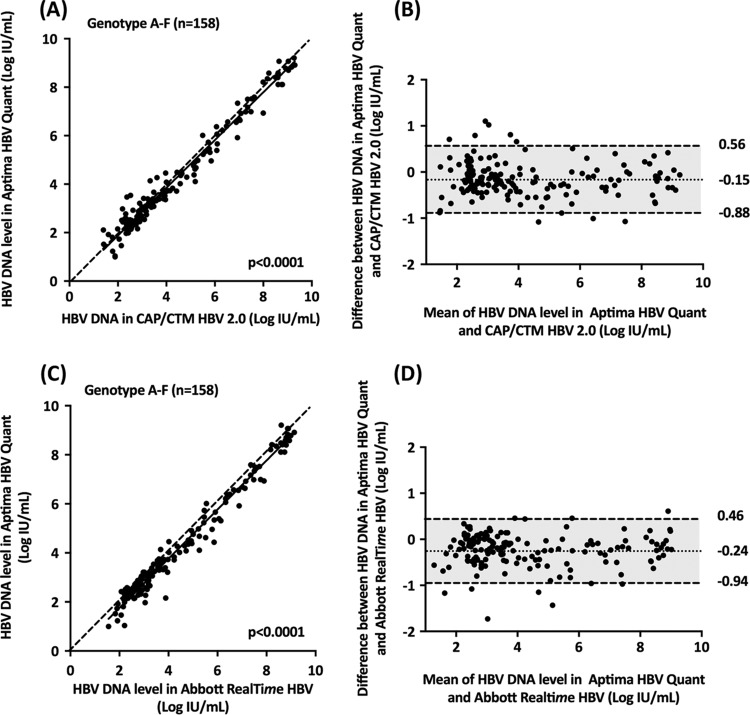
To assess the influence of the HBV genotype on HBV DNA quantification, plasma samples from 158 untreated patients from group 2 with chronic HBV infection due to genotypes A to F were tested in parallel with the Aptima HBV Quant, CAP/CTM HBV 2.0, and Abbott RealTime HBV assays. All of these samples fell within the dynamic ranges of quantification of the three assays. Figure 2 shows the relationship between the HBV DNA levels measured with the Aptima HBV Quant assay and the two comparators.
FIG 2.
Deming correlation and Bland-Altman plot analysis of HBV DNA levels measured by the Aptima HBV Quant assay in 158 clinical specimens (group 2) containing HBV genotypes A (n = 50), B (n = 8), C (n = 8), D (n = 52), E (n = 38), or F (n = 2). (A) Deming regression of HBV DNA levels measured by the Aptima HBV Quant and CAP/CTM HBV 2.0 assays, respectively; (B) Bland-Altman plot analysis of the Aptima HBV Quant assay versus the CAP/CTM HBV 2.0 assay; (C) Deming regression analysis of HBV DNA levels measured by the Aptima HBV Quant assay versus the Abbott RealTime HBV assay; (D) Bland-Altman plot analysis of the Aptima HBV Quant assay versus the Abbott RealTime HBV assay. In the Bland-Altman plots, the dotted and dashed lines represent mean differences ± 1.96 SD, respectively.
As shown in Fig. 2, a significant relationship was found between HBV DNA levels obtained with the Aptima HBV Quant and CAP/CTM HBV 2.0 assays (Fig. 2A) or the Abbott RealTime HBV test (Fig. 2C). A modest bias (−0.15 ± 0.37 IU/ml) was observed between the Aptima HBV Quant and CAP/CTM HBV 2.0 assays (Fig. 2B). A lower HBV DNA level was observed with the Aptima HBV Quant assay than with the CAP/CTM HBV 2.0 assay in 115 of the 158 samples (72.8%), with no relationship with the HBV DNA level. Ten samples had a difference of more than 1.96 times the average bias, including 6 (2 with genotype A, 2 with genotype D, and 2 with genotype F) that were higher and 4 (2 with genotype A and 2 with genotype D) that were lower in the Aptima HBV Quant assay than in the CAP/CTM HBV 2.0 assay. In all cases the difference was less than 1.10 log IU/ml.
When the Abbott RealTime HBV test was used as a comparator, a modest bias (−0.24 ± 0.35 IU/ml) was also observed (Fig. 2D). The HBV DNA level was lower with the Aptima HBV Quant assay than with the CAP/CTM HBV 2.0 assay in 122 of the 158 samples (77.2%), with no relationship with the HBV DNA level. For eight samples, the difference between the Aptima HBV Quant and Abbott RealTime HBV assays was above 1.96 times the average bias, including for one genotype B sample that was higher and seven samples (3 with genotype A, one with genotype B and 3 with genotype D) that were lower with the Aptima HBV Quant assay. In 5 plasma samples, the difference between the two assays was more than 1 log IU/ml. The sequences of a portion of the S gene (positions 200 to 800) spanning the two regions targeted by the Aptima HBV Quant assay primers and probe were compared between patients, with and without differences in quantification among the assays. This analysis did not reveal a molecular basis for the discrepant results.
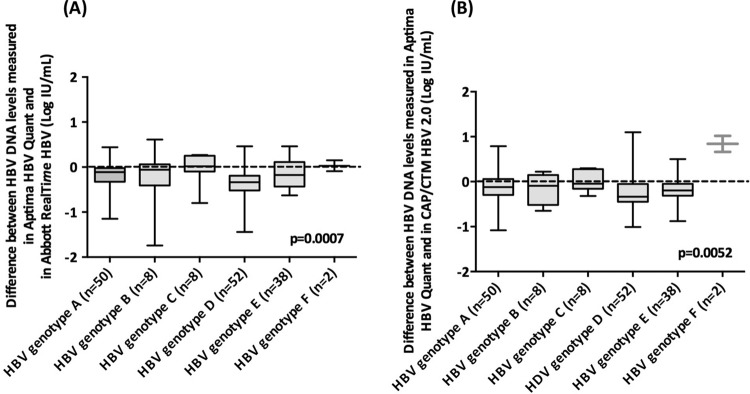
Box plots of individual differences between the Aptima HBV Quant assay and the two comparators are shown for each genotype in Fig. 3. They confirm the generally slightly lower HBV DNA levels in the Aptima HBV Quant assay than in both comparator PCR-based assays, regardless of the HBV genotype. The median differences between the Aptima HBV Quant and Abbott RealTime HBV assays were −0.11 log IU/ml for genotype A, −0.06 log IU/ml for genotype B, +0.02 log IU/ml for genotype C, −0.33 log IU/ml for genotype D, and −0.17 log IU/ml for genotype E (P = 0.0007) (Fig. 3A). The difference was +0.03 log IU/ml for genotype F, but only 2 specimens were included. The median differences between the Aptima HBV Quant and CAP/CTM HBV 2.0 assays were −0.12 log IU/ml for genotype A, −0.09 log IU/ml for genotype B, −0.04 log IU/ml for genotype C, −0.33 log IU/ml for genotype D, and −0.19 log IU/ml for genotype E (P = 0.0052) (Fig. 3B). The difference was +0.84 log IU/ml for genotype F, but only 2 specimens were included.
FIG 3.
Box plot representation of the distribution of the differences between the HBV DNA levels obtained by the Aptima HBV Quant assay and the CAP/CTM HBV 2.0 assay (A) or the Aptima HBV Quant and Abbott RealTime HBV assays (B), according to the HBV genotype. The midline and the lower and upper edges of the boxes represent the median value, 25th percentile, and 75th percentile, respectively. The lower and upper error bars represent the minimum and maximum values, respectively.
To assess the influence of amino acid substitutions in the MHR on HBV DNA quantification, 23 plasma specimens from group 4 were tested in parallel with the Aptima HBV Quant, CAP/CTM HBV 2.0, and Abbott RealTime HBV assays. As shown in Fig. 4A, HBV DNA levels were comparable for the 3 assays, regardless of the amino acid substitution(s), HBV genotype, and HBV DNA level. In addition, 18 plasma specimens from group 5, with viruses bearing BCP and/or precore mutations, were tested in parallel with the three assays. No discrepancies were observed across the assays in these patients (Fig. 4B).
FIG 4.
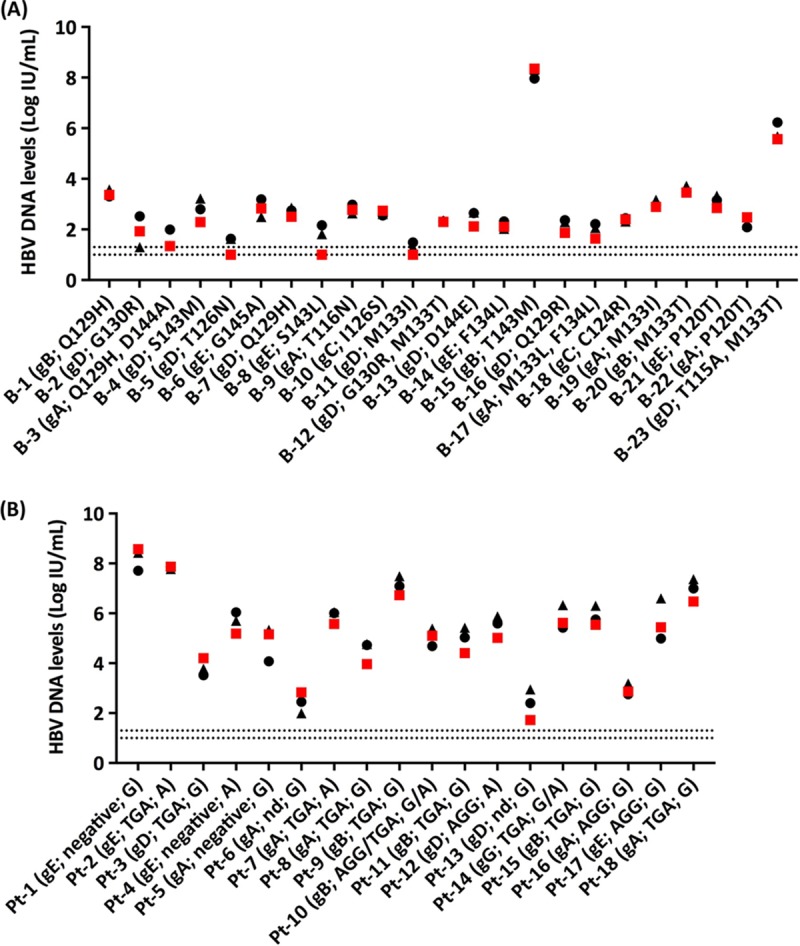
Quantification of HBV DNA levels in 23 clinical specimens (group 4) infected with HBV bearing amino acid substitutions in the MHR of the S gene (A) and in 18 clinical specimens (group 5) infected with HBV bearing BCP and/or precore mutations (B). HBV DNA levels were measured with the Aptima HBV Quant assay (red squares), the CAP/CTM HBV 2.0 assay (black triangles), or the Abbott RealTime HBV assay (black circles). The red or black dashed lines correspond to the LODs of the Aptima HBV Quant assay (1.0 log IU/ml) and the Abbott RealTime HBV assay (1.0 log IU/ml) or the CAP/CTM HBV 2.0 assay (1.3 log IU/ml), respectively. B-1, blood donor 1; Pt-1, patient 1; gA, genotype A; gB, genotype B; gC, genotype C; gD, genotype D; gE, genotype E; gG, genotype G; nd, not determined due to PCR amplification failure or lack of hybridization to the specific probes in spite of efficient PCR amplification. Amino acid substitutions in the MHR containing the “a” determinant and BCP (AGG or TGA at positions 1762 to 1764) and precore (G or A at position 1896) mutations are indicated.
HBV DNA monitoring in patients receiving nucleoside or nucleotide analogue therapy.
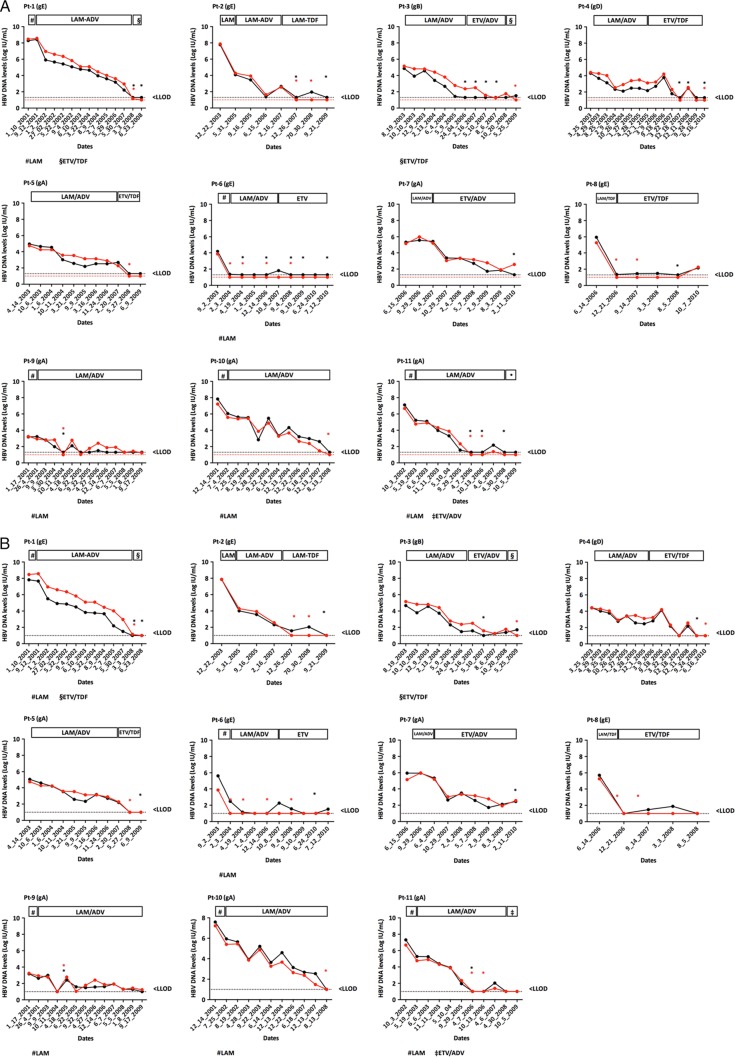
Eleven patients chronically infected with HBV (5 with genotype A, 1 with genotype B, 1 with genotype D, and 4 with genotype E) were serially sampled during treatment with nucleoside- or nucleotide-containing regimens, including monotherapy with lamivudine or dual therapy with a nucleoside and a nucleotide analogue (Fig. 5). One hundred fifteen specimens were tested in parallel with the Aptima HBV Quant, CAP/CTM HBV 2.0, and Abbott RealTime HBV assays. The last could not be used on 7 additional samples because of the insufficient volume of plasma available. In all cases, individual patient HBV DNA dynamics were parallel, regardless of the treatment regimen, demonstrating a satisfactory concordance of the three assays (Fig. 5A and B).
FIG 5.
Kinetics of HBV DNA levels measured in patients' plasma specimens with the Aptima HBV Quant (red lines and filled circles) and CAP/CTM HBV 2.0 assays (black lines and filled circles) (A) or the Abbott RealTime HBV assay (black lines and filled circles) (B). The red or black dashed lines correspond to the LODs of the Aptima HBV Quant (1.0 log IU/ml) and CAP/CTM HBV 2.0 (1.3 log IU/ml) assays or the Abbott RealTime HBV assay (1.0 log IU/ml), respectively. HBV DNA levels are shown on the y axis. Red or black asterisks represent detectable but not quantifiable HBV DNA in the Aptima HBV Quant and CAP/CTM HBV 2.0 assays or the Abbott RealTime HBV assay, respectively. gA, genotype A; gB, genotype B; gD, genotype D; gE, genotype E; LAM, lamivudine; ETV, entecavir; ADV, adefovir; TDF, tenofovir.
DISCUSSION
Sensitive and accurate nucleic acid amplification technologies are recommended by international Clinical Practice Guidelines for the quantification of viral genomes in clinical practice, such as HBV, HIV, hepatitis C virus, and other viruses (9, 10). In the present study, based on a large number of clinical specimens, including specimens with the different genotypes found in HBV-infected patients, we showed that the new automated real-time TMA-based Aptima HBV Quant assay accurately quantifies HBV DNA levels. Its performances appeared comparable to those of two real-time PCR platforms widely used in clinical practice, including the CAP/CTM HBV 2.0 and Abbott RealTime HBV assays. The Aptima HBV Quant assay has excellent analytical sensitivity, with an estimated lower limit of detection on the same order as that claimed by the manufacturer, i.e., 4.5 IU/ml. This assay was also precise, and its results were reproducible in our study. We observed only a modest difference in HBV DNA levels with the Aptima HBV Quant assay for all members of the standard panel. This finding was confirmed in clinical specimens when we compared the Aptima HBV Quant assay to the two real-time PCR-based assays. This small deviation was independent of the HBV genotype and has most likely no implications in clinical practice. Indeed, HBV DNA monitoring of patients receiving antiviral treatment showed a perfect concordance of the results between the assays, independently of the treatment regimen received.
One limitation of our study is the small proportion of samples containing genotypes B and C tested. This reflects the HBV genotype distribution in our area, where genotypes A, D, and E are the most prevalent. Thus, although our results strongly suggest that the performance of the Aptima HBV Quant assay is good for all genotypes, further studies will be needed, as will more patients with genotypes B and C, in particular, those living in Asia or of Asian origin. Few specimens containing rare genotypes (F, G, H, I, and J) were included.
In conclusion, this is the first study showing that the newly developed real-time TMA-based assay Aptima HBV Quant assay is sensitive, specific, and reproducible and accurately quantifies HBV DNA levels in plasma samples from patients with chronic HBV infection, including patients on antiviral treatment. Quantification is linear over the full dynamic range of quantification, which covers values commonly observed in both untreated and treated patients with chronic HBV infection. The Aptima HBV Quant assay can thus be confidently used to detect and quantify HBV DNA in clinical trials with new anti-HBV drugs currently in development and in clinical practice.
MATERIALS AND METHODS
Standards.
A standard panel containing different concentrations of HBV DNA obtained by dilution of an HBV-positive human plasma in normal human plasma (AcroMetrix HBV panel; Thermo Fisher Scientific, Fremont, CA) was used. Each panel member contains a predetermined amount of HBV DNA calibrated against the WHO international standard. Consequently, the assigned values are reported in international units per milliliter. The seven panel members, HBV 5E1, 5E2, 5E3, 5E4, 5E5, 5E6, and 5E7, contain 5 × 101 IU/ml (1.7 log IU/ml), 5 × 10² IU/ml (2.7 log IU/ml), 5 × 10³ IU/ml (3.7 log IU/ml), 5 × 10⁴ IU/ml (4.7 log IU/ml), 5 × 10⁵ IU/ml (5.7 log IU/ml), 5 × 10⁶ IU/ml (6.7 log IU/ml), and 5 × 10⁷ IU/ml (7.7 log IU/ml), respectively.
Clinical specimens.
Serum (n = 106, group 1) or plasma (n = 321, groups 2 to 5) samples were obtained from patients attending the Department of Hepatology of the Henri Mondor Hospital, from patients who tested HBsAg positive in the Cerba Laboratory, and from blood donors diagnosed with an HBV infection at the Institut National de la Transfusion Sanguine.
Group 1 comprised 206 non-HBV-infected individuals, including 101 HBV-seronegative patients (no markers of past or ongoing HBV infection) and 105 patients with a serological profile of resolved HBV infection (with both anti-HBc and anti-HBs antibodies). Group 2 comprised 158 untreated patients with chronic HBV infection, all of whom had detectable HBsAg, anti-HBc antibodies, and HBV DNA. Genotyping based on the sequencing of a portion of the S gene followed by phylogenetic analysis showed that group 2 consisted of 50 patients infected with genotype A, 8 with genotype B, 8 with genotype C, 52 with genotype D, 38 with genotype E, and 2 with genotype F. Group 3 comprised 11 patients treated with different nucleoside or nucleotide analogue regimens, including lamivudine, adefovir, entecavir, or tenofovir given once daily. They included 5 patients infected with genotype A, 1 with genotype B, 1 with genotype D, and 4 with genotype E. These patients were serially sampled on treatment to assess their virological responses. In total, 122 plasma specimens were available from group 3 patients. Group 4 comprised 23 blood donors with chronic HBV infection infected with a dominant variant bearing one or two amino acid substitutions in the major hydrophilic region (MHR), which spans the “a” determinant of the S gene. Among them, 5 were infected with genotype A, 3 with genotype B, 2 with genotype C, 9 with genotype D, and 4 with genotype E. Group 5 comprised 18 patients chronically infected with HBV variants bearing nucleotide substitutions in the basal core promoter (BCP; positions 1762 to 1764) and precore (position 1896) regions. BCP and precore mutations were found by means of a line probe assay after nested PCR amplification of the corresponding genomic region (INNO-LiPA HBV PreCore assay; Fujirebio, Ghent, Belgium), according to the manufacturer's instructions. In this group, 6 patients were infected with genotype A, 4 with genotype B, 3 with genotype C, 4 with genotype E, and 1 with genotype G.
The study was performed in accordance with the principles of Good Clinical Practice and conducted in adherence with the Declaration of Helsinki. Only leftover samples from samples originally sent to our laboratory for routine HBV testing were used. All samples were anonymized before the study began. An identification number was assigned to each leftover sample, and the identification number did not contain any patient identifier.
Study design.
Each clinical specimen was tested with three different HBV DNA detection and quantification assays, including the real-time TMA-based Aptima HBV Quant assay and two widely used commercially available assays based on real-time PCR (CAP/CTM HBV 2.0 and Abbott RealTime HBV assays).
HBV DNA quantification. (i) Aptima HBV Quant assay.
HBV DNA was isolated on the Panther instrument from 500 μl of plasma or serum by lysis of viral particles with detergent and binding of viral genomic DNA to capture oligonucleotides. The hybridized target was then captured onto magnetic microparticles that are separated from the specimen in a magnetic field. The data were analyzed with Performance Evaluation Only (PEO) software, version 5.3. HBV DNA levels were expressed in international units per milliliter. The claimed dynamic range of quantification of Aptima HBV Quant is 10 to 1 × 10⁹ IU/ml (1.0 to 9.0 log IU/ml), with an LOD of 5.6 IU/ml in plasma and 4.3 IU/ml in serum and with an LLOQ of 10 IU/ml, according to the manufacturer's product insert. The viral region targeted by dual primers and probes is the S gene.
(ii) CAP/CTM HBV 2.0 assay.
HBV DNA was extracted from 650 μl of plasma or serum by means of the Cobas AmpliPrep automated extractor, according to the manufacturer's instructions. The Cobas TaqMan 96 analyzer was used for automated real-time PCR amplification and detection of PCR products, according to the manufacturer's instructions. The data were analyzed with AMPLILINK software, version 3.3.7. HBV DNA levels were expressed in international units per milliliter. The dynamic range of quantification of the CAP/CTM HBV 2.0 assay is 20 to 1.7 × 10⁸ IU/ml (1.3 to 8.2 log IU/ml), with an LOD of 9.0 IU/ml in plasma and 19.0 IU/ml in serum and with an LLOQ of 20 IU/ml, according to the manufacturer's product insert. The viral region targeted by primers and probes is the preC-C gene.
(iii) Abbott RealTime HBV assay.
HBV DNA was extracted from 500 μl of plasma or serum by means of the automated extractor m2000SP, according to the manufacturer's instructions. The m2000RT device was then used for automated real-time PCR amplification and detection of PCR products, according to the manufacturer's instructions. The data were analyzed with the Abbott RealTime m2000RT software, version 8. HBV DNA levels were expressed in international units per milliliter. The dynamic range of quantification of this assay is 10 to 1 × 10⁹ IU/ml (1.0 to 9.0 log IU/ml), with an LOD of 6.4 IU/ml in plasma and 3.8 IU/ml in serum and with an LLOQ of 10 IU/ml, according to the manufacturer's product insert. The viral region targeted by primers and probes is the S gene.
Statistical analyses.
Descriptive statistics are shown as means ± standard deviations (SD) or as medians and interquartile ranges, as appropriate. The LOD of the Aptima assay was determined by means of Logit analysis as the 95% point estimate with a surrounding 95% confidence interval, using IBM SPSS Statistics version 23 (Statistical Package for Social Sciences; IBM Corp., Chicago, IL). The relationship between quantitative variables was studied by means of Deming regression analysis. For better visualization of differences between the quantification assays, the Bland-Altman plot method, in which differences between the two techniques are plotted against the average of the results of the two techniques, was also used. Comparison between groups was made using the Kruskal-Wallis test. P values of <0.05 were considered significant.
ACKNOWLEDGMENT
The Aptima HBV Quant assay kits and the Panther instrument were kindly provided by Hologic Inc.
REFERENCES
- 1.Schweitzer A, Horn J, Mikolajczyk RT, Krause G, Ott JJ. 2015. Estimations of worldwide prevalence of chronic hepatitis B virus infection: a systematic review of data published between 1965 and 2013. Lancet 386:1546–1555. doi: 10.1016/S0140-6736(15)61412-X. [DOI] [PubMed] [Google Scholar]
- 2.GBD. 2013 Mortality and Causes of Death Collaborators. 2015. Global, regional, and national age-sex specific all-cause and cause-specific mortality for 240 causes of death, 1990–2013: a systematic analysis for the Global Burden of Disease Study 2013. Lancet 385:117–171. doi: 10.1016/S0140-6736(14)61682-2. [DOI] [PMC free article] [PubMed] [Google Scholar]
- 3.Fitzmaurice C, Dicker D, Pain A, Hamavid H, Moradi-Lakeh M, MacIntyre MF, Allen C, Hansen G, Woodbrook R, Wolfe C, Hamadeh RR, Moore A, Werdecker A, Gessner BD, Te Ao B, McMahon B, Karimkhani C, Yu C, Cooke GS, Schwebel DC, Carpenter DO, Pereira DM, Nash D, Kazi DS, De Leo D, Plass D, Ukwaja KN, Thurston GD, Yun Jin K, Simard EP, Mills E, Park EK, Catala-Lopez F, deVeber G, Gotay C, Khan G, Hosgood HD III, Santos IS, Leasher JL, Singh J, Leigh J, Jonas JB, Sanabria J, Beardsley J, Jacobsen KH, Takahashi K, Franklin RC, Ronfani L, Montico M, Naldi L, et al. 2015. The global burden of cancer 2013. JAMA Oncol 1:505–527. doi: 10.1001/jamaoncol.2015.0735. [DOI] [PMC free article] [PubMed] [Google Scholar]
- 4.Jemal A, Bray F, Forman D, O'Brien M, Ferlay J, Center M, Parkin DM. 2012. Cancer burden in Africa and opportunities for prevention. Cancer 118:4372–4384. doi: 10.1002/cncr.27410. [DOI] [PubMed] [Google Scholar]
- 5.Ott JJ, Horn J, Krause G, Mikolajczyk RT. 2017. Time trends of chronic HBV infection over prior decades—a global analysis. J Hepatol 66:48–54. doi: 10.1016/j.jhep.2016.08.013. [DOI] [PubMed] [Google Scholar]
- 6.Wasley A, Kruszon-Moran D, Kuhnert W, Simard EP, Finelli L, McQuillan G, Bell B. 2010. The prevalence of hepatitis B virus infection in the United States in the era of vaccination. J Infect Dis 202:192–201. doi: 10.1086/653622. [DOI] [PubMed] [Google Scholar]
- 7.Chang TT, Liaw YF, Wu SS, Schiff E, Han KH, Lai CL, Safadi R, Lee SS, Halota W, Goodman Z, Chi YC, Zhang H, Hindes R, Iloeje U, Beebe S, Kreter B. 2010. Long-term entecavir therapy results in the reversal of fibrosis/cirrhosis and continued histological improvement in patients with chronic hepatitis B. Hepatology 52:886–893. doi: 10.1002/hep.23785. [DOI] [PubMed] [Google Scholar]
- 8.Marcellin P, Gane E, Buti M, Afdhal N, Sievert W, Jacobson IM, Washington MK, Germanidis G, Flaherty JF, Aguilar Schall R, Bornstein JD, Kitrinos KM, Subramanian GM, McHutchison JG, Heathcote EJ. 2013. Regression of cirrhosis during treatment with tenofovir disoproxil fumarate for chronic hepatitis B: a 5-year open-label follow-up study. Lancet 381:468–475. doi: 10.1016/S0140-6736(12)61425-1. [DOI] [PubMed] [Google Scholar]
- 9.European Association for the Study of the Liver. 2012. EASL clinical practice guidelines: management of chronic hepatitis B virus infection. J Hepatol 57:167–185. doi: 10.1016/j.jhep.2012.02.010. [DOI] [PubMed] [Google Scholar]
- 10.Terrault NA, Bzowej NH, Chang KM, Hwang JP, Jonas MM, Murad MH. 2016. AASLD guidelines for treatment of chronic hepatitis B. Hepatology 63:261–283. doi: 10.1002/hep.28156. [DOI] [PMC free article] [PubMed] [Google Scholar]
- 11.Chevaliez S, Rodriguez C, Pawlotsky JM. 2012. New virologic tools for management of chronic hepatitis B and C. Gastroenterology 142:1303–1313. doi: 10.1053/j.gastro.2012.02.027. [DOI] [PMC free article] [PubMed] [Google Scholar]
- 12.Chevaliez S, Bouvier-Alias M, Laperche S, Hezode C, Pawlotsky JM. 2010. Performance of version 2.0 of the Cobas AmpliPrep/Cobas TaqMan real-time PCR assay for hepatitis B virus DNA quantification. J Clin Microbiol 48:3641–3647. doi: 10.1128/JCM.01306-10. [DOI] [PMC free article] [PubMed] [Google Scholar]
- 13.Thibault V, Pichoud C, Mullen C, Rhoads J, Smith JB, Bitbol A, Thamm S, Zoulim F. 2007. Characterization of a new sensitive PCR assay for quantification of viral DNA isolated from patients with hepatitis B virus infections. J Clin Microbiol 45:3948–3953. doi: 10.1128/JCM.01180-07. [DOI] [PMC free article] [PubMed] [Google Scholar]
- 14.Yeh ML, Huang CF, Hsieh MY, Huang JF, Dai CY, Yu ML, Chuang WL. 2014. Comparison of the Abbott RealTime HBV assay with the Roche Cobas AmpliPrep/Cobas TaqMan HBV assay for HBV DNA detection and quantification. J Clin Virol 60:206–214. doi: 10.1016/j.jcv.2014.04.008. [DOI] [PubMed] [Google Scholar]
- 15.Armbruster DA, Pry T. 2008. Limit of blank, limit of detection and limit of quantitation. Clin Biochem Rev 29(Suppl 1):S49–S52. [PMC free article] [PubMed] [Google Scholar]


