Abstract
Background
Prior studies have demonstrated how price transparency lowers the test-ordering rates of trainees in hospitals, and physician-targeted price transparency efforts have been viewed as a promising cost-controlling strategy.
Objective
To examine the effect of displaying paid-price information on test-ordering rates for common imaging studies and procedures within an accountable care organization (ACO).
Design
Block randomized controlled trial for 1 year.
Subjects
A total of 1205 fully licensed clinicians (728 primary care, 477 specialists).
Intervention
Starting January 2014, clinicians in the Control arm received no price display; those in the intervention arms received Single or Paired Internal/External Median Prices in the test-ordering screen of their electronic health record. Internal prices were the amounts paid by insurers for the ACO’s services; external paid prices were the amounts paid by insurers for the same services when delivered by unaffiliated providers.
Main Measures
Ordering rates (orders per 100 face-to-face encounters with adult patients): overall, designated to be completed internally within the ACO, considered “inappropriate” (e.g., MRI for simple headache), and thought to be “appropriate” (e.g., screening colonoscopy).
Key Results
We found no significant difference in overall ordering rates across the Control, Single Median Price, or Paired Internal/External Median Prices study arms. For every 100 encounters, clinicians in the Control arm ordered 15.0 (SD 31.1) tests, those in the Single Median Price arm ordered 15.0 (SD 16.2) tests, and those in the Paired Prices arms ordered 15.7 (SD 20.5) tests (one-way ANOVA p-value 0.88). There was no difference in ordering rates for tests designated to be completed internally or considered to be inappropriate or appropriate.
Conclusions
Displaying paid-price information did not alter how frequently primary care and specialist clinicians ordered imaging studies and procedures within an ACO. Those with a particular interest in removing waste from the health care system may want to consider a variety of contextual factors that can affect physician-targeted price transparency.
KEY WORDS: randomized trials, electronic health record, health services research
INTRODUCTION
Physicians have been targeted for price transparency efforts because they have the expertise needed to distinguish when medical spending is necessary versus wasteful.1 – 4 Physician-targeted price transparency efforts are considered a promising cost-control strategy because the vast majority of controlled studies found that when clinicians are shown the prices of tests, they lower test-ordering rates.5 – 20
Available evidence is not without limitations. Nearly all studies have presented clinicians with charge information rather than paid prices, which are the prices that health plans actually pay.5 – 20 Charge information is usually used in contract negotiation and can be 4–40-fold higher than paid prices.21 As a result, presenting clinicians with charge information can potentially exaggerate clinicians’ price response.21 Existing studies have also presented price information to trainee clinicians on inpatient rotations rather than to fully licensed clinicians active in routine outpatient practice.5 – 20 Actively practicing, fully licensed clinicians may not know exact prices but may have an awareness of relative pricing (e.g., that ultrasounds are cheaper than MRIs). Thus, they may already be combining that knowledge with evidence-based practice while ordering and making high-value decisions.
It is also important to study the effect of price information within the context of an accountable care organization (ACO) because this type of organization is proliferating; ACOs—health care providers who are responsible for the cost and quality of care for a defined population of patients—are also interesting because they represent a type of organization that can benefit financially from lower spending.18 , 22 As a result, ACOs may develop or promote cultures that may cause clinicians to respond to price information differently than they would in hospital or emergency department settings (e.g., they may already have reduced unnecessary care to low rates or be more interested in shifting location of care rather than lowering ordering rates).18 The one study done within the ACO setting by members of our team suggests that price transparency involving laboratory tests can have a variable effect.18
The extant literature also lacks several domains that are relevant today. It does not explore how alternate presentations of price information may differentially affect clinician ordering rates.5 – 20 Presenting a Single Median Price may allow clinicians to focus on whether the test they are considering is “worth” the price they see; they may lower or raise ordering rates accordingly. Within a global payment contract or ACO, however, information about the differential paid price associated with tests performed “internally” versus “externally” to the risk-bearing (i.e., being financially responsible if a patient population spends beyond estimated or budgeted amounts) entity of the ACO may allow cost savings to be achieved by shifting the location of imaging or procedures rather than from lowering ordering levels.23
To our knowledge, no study has assessed how price information affects ordering of tests under clinical scenarios in which test ordering would be considered “inappropriate” (e.g., advanced brain imaging for simple headaches) while preserving ordering thought to be “appropriate” (e.g., recommended screening colonoscopies). If price information were to have an effect on clinician ordering rates, then it would be important for this effect to be limited to testing that is considered inappropriate and for price to have no effect on testing that is considered appropriate.
This study uses a blocked randomized-controlled study design to evaluate the effect of displaying a single median price or a pair of “internal/external” median prices on how often clinicians caring for adult patients order imaging studies and procedures: (1) overall, (2) to be completed internally within an ACO, (3) in test-ordering circumstances considered “inappropriate,” and (4) in test-ordering scenarios reflecting “appropriate” orders.
METHODS
Study Setting
Atrius Health (Atrius) is a large multispecialty medical group consisting of over 35 practice locations in eastern and central Massachusetts. At the time of our study, Atrius’ over 1200 primary care and specialist clinicians (84 % MDs/DOs; 16 % nurse practitioners/physician assistants) delivered care to nearly 400,000 patients aged 21 and older annually. About 10 % of patients were from Black or Non-White Hispanic backgrounds; 8 % and 13 % were insured by Medicaid and Medicare, respectively. Approximately half of the contracts and patients cared for by Atrius are risk-bearing. Boston Children’s Hospital Institutional Review Board approved this study, including a waiver of informed consent for clinicians.
Price Education Intervention (PEI)
Early in January 2014, Atrius introduced the PEI focused on commonly ordered imaging studies and procedures (Appendix Table 3) to all of their eligible clinicians; all clinicians had memo-based price information prior to randomized start of EHR-based price information. For each test, Atrius calculated a single median paid price from the insurer paid amount across all the risk-bearing commercial, Medicaid, and Medicare contracts that Atrius had in the year prior to the PEI. Atrius also calculated a set of “internal/external” median paid prices reflecting prices if the test was conducted within Atrius or outside of Atrius, respectively. Atrius prices were lower than non-Atrius prices in 92 % of cases with the mean difference in prices being $365 (SD $914). Paper and electronic memos introduced the intent of the PEI, which was to provide price information without adjunctive clinical decision support or patient education materials.
Table 3.
Atrius Health Price Education Initiative: List of Diagnostic Imaging and Procedures
| Procedure name | |
| Cardiac procedures | |
| Carotid ultrasound | |
| Echocardiogram | |
| Exercise stress test | |
| Myocardial perfusion | |
| Stress echocardiogram | |
| Scope procedures | |
| Colonoscopy | |
| Endoscopy (nasal) | |
| Knee arthroscopy | |
| Nasal endoscopy | |
| Flex sigmoidoscopy | |
| Advanced imaging procedures | |
| Abdominal CT | |
| Abdominal US/complete | |
| Abdominal US/limited | |
| Bone density study | |
| Brain MRI | |
| Breast MRI | |
| Cervical spine MRI | |
| Chest CT | |
| Chest CTA | |
| Chest X-ray PA & lateral | |
| Head CT | |
| Head MRA (angio) | |
| KUB X-ray | |
| Lower extremity MRI | |
| Lumbar spine MRI | |
| Pelvic US Non-OB | |
| Thoracic spine MRI | |
| Upper extremity MRI | |
| Other specialty procedures | |
| Cataract surgery (internal might not include facility fees) | |
| Dialysis treatment | |
| Orthopedic injections (small, intermediate, major) | |
| Cardiac catheterization (not part of hospitalization) | |
| Pulmonary function tests | |
| Electromyography (EMG) | |
| Sleep study |
CT Computed tomography, US ultrasound, MRI magnetic resonance imaging, CTA CT angiography, X-ray X-radiation, PA posterioranterior, MRA magnetic resonance angiogram, KUB kidney, ureter, bladder, OB obstetric
Study Design
Starting January 26, 2014, and continuing through December 31, 2014, we block randomized clinicians who could independently place orders in Atrius’ Epic-based electronic health record (EHR) to one of three study arms: Control (no EHR price display), Single Median Price, or Paired Internal/External Median Prices (Appendix Table 4). We first obtained Atrius’ list of 1509 clinician employees who could independently place orders in the Epic-based EHR. We drew practices in random order and randomized all physicians and eligible non-physician clinicians within each practice (or block) before moving on to the next practice. We block randomized clinicians because practice locations varied substantially in terms of size (5–50 providers), setting (urban, suburban), and patient population characteristics (e.g., race/ethnicity, insurance).
Table 4.
Price Display in Epic Systems
| Control | |
| Name | Type |
| BRAIN MRI W/ CONTRAST | IMAGING |
| BRAIN MRI W/O + W/BRAIN MRA W/O / CAROTID MRA W/O CONTRAST | IMAGING |
| BRAIN MRI W/O + W/BRAIN MRA W/O /CAROTID MRA W/O+ W CONTRAST (DISSECTION) | IMAGING |
| BRAIN MRI W/O + W/ CONTRAST | IMAGING |
| Single price | |
| BRAIN MRI W/ CONTRAST | IMAGING-Median: $778 |
| BRAIN MRI W/O + W/BRAIN MRA W/O / CAROTID MRA W/O CONTRAST | IMAGING |
| BRAIN MRI W/O + W/BRAIN MRA W/O / CAROTID MRA W/O + W CONTRAST (DISSECTION) | IMAGING |
| BRAIN MRI W/O + W/ CONTRAST | IMAGING-Median: $778 |
| Paired internal/external prices | |
| BRAIN MRI W/ CONTRAST | IMAGING-Median: Int: $636 vs Ext: $949 |
| BRAIN MRI W/O + W/BRAIN MRA W/O / CAROTID MRA W/O CONTRAST | IMAGING |
| BRAIN MRI W/O + W/BRAIN MRA W/O /CAROTID MRA W/O + W/ CONTRAST (DISSECTION) | IMAGING |
| BRAIN MRI W/O + W/ CONTRAST | IMAGING-Median: Int: $636 vs Ext: $949 |
© 2015 Epic Systems Corporation. Confidential.
Clinicians randomized to the Single Median Price arm received a single median price display next to the test while they were placing that order in their EHR. Those in the Paired Internal/External Median Price arm had internal and external median prices appear next to the test in the ordering screen in their EHR.
The study sample consisted of 1205 clinicians who had at least one direct patient encounter with a patient ≥21 years within 2014, of which 407 were randomized to the Control arm, 396 to the Single Median Price arm, and 402 to the Paid Prices arm. Among eligible clinicians, 728 were primary care providers (e.g., internists, family practitioners) and 477 were specialists (e.g., obstetrics/gynecologists, cardiologists, orthopedists). Study team members were blinded to study arm assignment until our initial analysis was complete.
Data Source
Atrius’ Epic Systems©-based Stage 7 EHR records all clinicians’ ordering actions (e.g., orders placed, whether order was to be completed internally within Atrius) and has served as the chief repository for research data.24 – 27 We used Atrius data for calendar years 2013 and 2014. We used post-intervention (2014) data to measure the effect of the intervention because the pre-intervention (2013) data verified that study arms were balanced in our outcomes of interest prior to the intervention (Appendix Tables 5 and 6). Atrius’ EHR data were enhanced with electronic abstract information designed to capture whether “Choosing Wisely” recommendations were being followed28 , 29 and whether recommended cervical and colorectal cancer screening rates were being completed.
Table 5.
Clinicians’ and Panel Characteristics, 2013
| Clinicians receiving: | ||||
|---|---|---|---|---|
| Control | Single price | Paired internal/external prices | ||
| All clinicians, N | 428 | 416 | 414 | |
| Per clinician: | Mean (SD) | Mean (SD) | Mean (SD) | p-value* |
| Total: | ||||
| Unique patients | 666 (646) | 714 (653) | 741 (629) | 0.23 |
| Orders | 159 (214) | 190 (259) | 185 (231) | 0.12 |
| Encounters | 1073 (1077) | 1126 (1057) | 1198 (1069) | 0.24 |
| Panel characteristics: | ||||
| Mean age in years | 45 (14) | 45 (14) | 47 (14) | 0.26 |
| Percent female | 66 (21) | 67 (21) | 64 (22) | 0.15 |
| Percent white | 77 (18) | 77 (18) | 77 (18) | 0.99 |
| Percent commercially insured | 73 (14) | 73 (13) | 71 (15) | 0.04 |
| Mean number of chronic conditions† | 0.49 (0.47) | 0.48 (0.41) | 0.53 (0.45) | 0.27 |
| Primary care, N | 250 | 262 | 255 | |
| Per clinician: | Mean (SD) | Mean (SD) | Mean (SD) | |
| Total: | ||||
| Unique patients | 643 (688) | 717 (692) | 766 (657) | 0.13 |
| Orders | 154 (214) | 183 (247) | 174 (205) | 0.34 |
| Encounters | 981 (1118) | 1100 (1142) | 1191 (1106) | 0.11 |
| Panel characteristics: | ||||
| Mean age in years | 40 (14) | 42 (13) | 44 (14) | 0.02 |
| Percent female | 63 (20) | 64 (19) | 61 (20) | 0.13 |
| Percent white | 77 (20) | 77 (20) | 77 (20) | 0.99 |
| Percent commercially insured | 77 (13) | 76 (12) | 73 (13) | 0.001 |
| Mean number of chronic conditions† | 0.46 (0.42) | 0.46 (0.39) | 0.55 (0.43) | 0.03 |
| Specialists, N | 178 | 154 | 159 | |
| Per clinician: | Mean (SD) | Mean (SD) | Mean (SD) | |
| Total: | ||||
| Unique patients | 698 (582) | 707 (582) | 702 (580) | 0.99 |
| Orders | 165 (214) | 202 (278) | 201 (267) | 0.30 |
| Encounters | 1203 (1005) | 1171 (895) | 1208 (1010) | 0.93 |
| Panel characteristics: | ||||
| Mean age | 52 (12) | 51 (12) | 51 (12) | 0.79 |
| Percent female | 70 (22) | 71 (23) | 69 (23) | 0.73 |
| Percent white | 78 (14) | 78 (13) | 78 (14) | 0.97 |
| Percent commercially insured | 66 (13) | 66 (13) | 66 (17) | 0.98 |
| Mean number of chronic conditions† | 0.53 (0.52) | 0.51 (0.44) | 0.50 (0.47) | 0.81 |
*One-way analysis of variance test
†Agency for Healthcare Research and Quality. Chronic Condition Indicator (CCI) for ICD-9-CM.32
Table 6.
Ordering Rates by Arm, Clinician Type, and Order Type, 2013
| Clinicians receiving: | |||||||
|---|---|---|---|---|---|---|---|
| Control | Single price | Paired internal/external prices | |||||
| All clinicians, N | 428 | 416 | 414 | ||||
| Mean | SD | Mean | SD | Mean | SD | p-value* | |
| Overall | 13.8 | 18.4 | 14.9 | 15.5 | 16.6 | 27.1 | 0.14 |
| Designated to be completed internally | 3.7 | 6.3 | 3.9 | 6.3 | 3.9 | 6.1 | 0.87 |
| Inappropriate | 0.3 | 0.5 | 0.3 | 0.5 | 0.3 | 0.5 | 0.54 |
| Appropriate | 1.9 | 4.4 | 2.0 | 3.8 | 2.1 | 4.4 | 0.87 |
| Primary care, N | 250 | 262 | 255 | ||||
| Mean | SD | Mean | SD | Mean | SD | ||
| Overall | 11.3 | 13.0 | 12.6 | 10.1 | 12.3 | 8.6 | 0.36 |
| Designated to be completed internally | 2.9 | 3.9 | 3.2 | 3.6 | 3.4 | 3.8 | 0.31 |
| Inappropriate | 0. 3 | 0.5 | 0.3 | 0.5 | 0.3 | 0.4 | 0.36 |
| Appropriate | 1.1 | 2.0 | 1.3 | 2.2 | 1.2 | 1.9 | 0.46 |
| Specialists, N | 178 | 154 | 159 | ||||
| Mean | SD | Mean | SD | Mean | SD | ||
| Overall | 17.3 | 23.6 | 18.8 | 21.3 | 23.5 | 21.3 | 0.14 |
| Designated to be completed internally | 4.8 | 8.4 | 5.0 | 9.1 | 4.6 | 8.5 | 0.92 |
| Inappropriate | 0.2 | 0.6 | 0.3 | 0.6 | 0.2 | 0.6 | 0.99 |
| Appropriate | 3.0 | 6.2 | 3.1 | 5.4 | 3.4 | 6.4 | 0.87 |
*One-way analysis of variance test
We followed Choosing Wisely criteria to identify clinical circumstances under which an imaging study or procedure test order would be considered “inappropriate.”30 Our analysis focused on the subset of orders being placed for patients: (1) at low-risk for cervical cancer (e.g., those with hysterectomies) who had Pap smear orders placed; (2) with Framingham Risk scores ≤12 points for men or ≤19 points for women who were receiving cardiac test orders (e.g., EKGs, ECHOs); (3) with simple syncope or simple headache who had head CT or MRI orders; (4) with uncomplicated low-back pain within 6 weeks of the initial diagnostic encounter who were having lumbar CTs or MRIs; (5) with acute, uncomplicated rhinosinusitis who were having sinus CTs; (6) at low risk for osteoporosis (e.g., normal weight women <50 years old without history of fracture, smoking, or heavy drinking) who had dual-energy X-ray absorptiometry orders placed.
We followed modified Healthcare Effectiveness Data and Information Set (HEDIS) criteria to identify “appropriate” ordering rates, which included: (1) orders for women aged 21–64 years who had not had a Pap within the prior 3 years; (2) orders for women aged 30–64 years who had not had cervical cytology/HPV co-testing within the prior 5 years; (3) orders for colonoscopy and flexible sigmoidoscopy for men or women aged 50–75 years who had not had a colonoscopy in the past 10 years or flexible sigmoidoscopy in the past 5 years.31
Main independent variable
Our main independent variable was an indicator of whether the clinician was randomized to the Control, Single Median Price, or Paired Internal/External Median Prices study arm.
Outcome variables
Our main dependent variables were ordering rates for the price-revealed tests, generally specified as each clinicians’ total volume of price-displayed tests of a given type divided by their total volume of encounters (i.e., orders per 100 patient encounters). We examined four different types of ordering rates: (1) overall (i.e., all orders for price-displayed tests); (2) internal; (3) inappropriate; (4) appropriate orders.
Statistical Analysis
For all analyses, our unit of analysis was the unit of randomization—clinician. We first analyzed data for all clinicians together. We then analyzed data for primary care clinicians separately from specialists because they order tests under different clinical circumstances. In general, we used one-way analysis of variance (ANOVA) and pair-wise t-tests (if ANOVAs were significant) to describe and compare clinicians in the Control arm relative to the intervention arms.
We examined the total volume and composition of each clinicians’ patient panels: average age, percent female, percent White, percent commercially insured, and number of chronic conditions per patient.32 We conducted sensitivity analyses to examine if our results were robust to including or excluding orders placed in non-face-to-face encounters.
Our study was designed to detect an effect size of 25 % of a standard deviation in test ordering with 80 % power and 5 % Type I error (i.e., a decrease or increase of roughly 3 orders per 100 encounters).
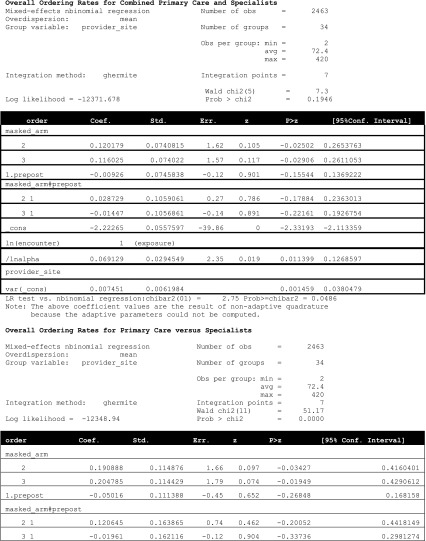
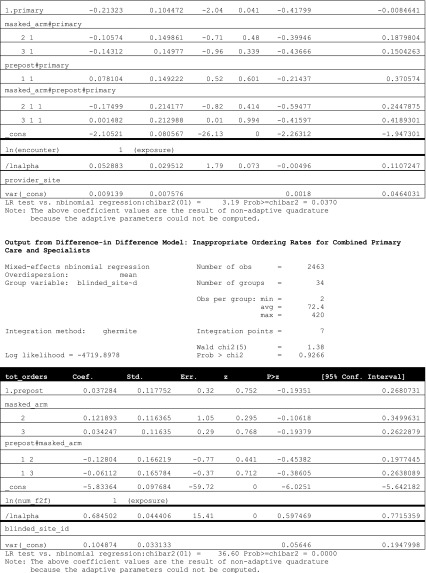
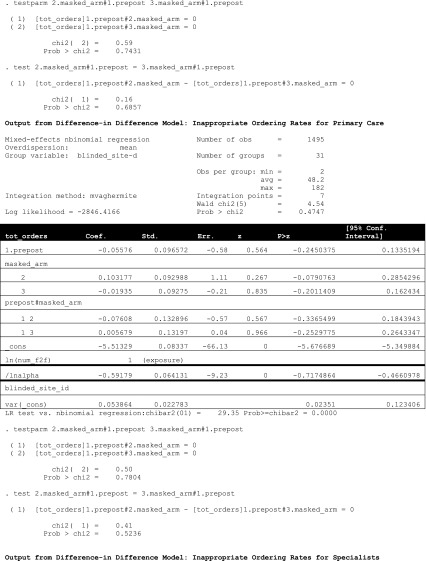
Even though differences in the ordering rates across study arms during the intervention period represent the effect of paid-price information in a randomized study design, we also estimated a generalized linear mixed model with a difference-in-difference regression specification in case one significant difference in patient panel characteristics (percent commercially insured) and low ordering rates could affect our analyses.
Data were analyzed using STATA statistical package, version 13.1.
RESULTS
Study Population
In 2014, clinicians across the three study arms were not significantly different with respect to: the volume of unique patients they cared for within the year, the composition of their patient panels, the volume of face-to-face encounters they were having with patients, and the volume of orders they were placing during face-to-face and non-face-to-face encounters (Table 1). On average across the three arms, clinicians cared for 770 [standard deviation (SD) 675; ANOVA p = 0.22] unique patients within the year through 1235 (SD 1116; ANOVA p = 0.19) face-to-face encounters. On average, clinicians’ patients were 46 years old (SD 14; ANOVA p = 0.74), female 64 % (SD 23 %; ANOVA p = 0.80) of the time, White 78 % (SD 17 %; ANOVA p = 0.95) of the time, commercially insured 72 % (SD 14 %; ANOVA p = 0.50) of the time, and had an average of 0.51 (SD 0.44; ANOVA p = 0.29) chronic conditions.
Table 1.
Clinicians’ and Panel Characteristics, 2014
| Clinicians receiving: | ||||
|---|---|---|---|---|
| Control | Single median price | Paired internal/external median prices | ||
| All clinicians, N | 407 | 396 | 402 | |
| Per clinician: | Mean (SD) | Mean (SD) | Mean (SD) | p-value* |
| Total unique patients | 731 (670) | 767 (671) | 813 (684) | 0.22 |
| Patient panel characteristics | ||||
| Mean age in years | 45 (14) | 46 (14) | 46 (13) | 0.74 |
| Percent female | 65 (23) | 65 (23) | 64 (22) | 0.80 |
| Percent white | 78 (17) | 78 (17) | 77 (17) | 0.95 |
| Percent commercially insured | 72 (14) | 71 (14) | 72 (13) | 0.50 |
| Mean number of chronic conditions† | 0.51 (0.47) | 0.48 (0.42) | 0.53 (0.45) | 0.29 |
| Total orders | 172 (229) | 206 (273) | 201 (241) | 0.88 |
| Total face-to-face encounters | 1174 (1105) | 1218 (1093) | 1313 (1147) | 0.19 |
*One-way analysis of variance
†Agency for Healthcare Research and Quality Chronic Condition Indicator (CCI) for ICD-9-CM.32
Ordering Rates: Overall
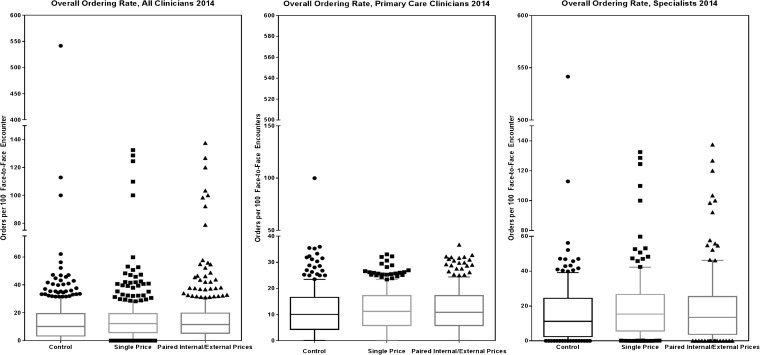
We found no significant difference in overall ordering rates among clinicians randomized to the Control, Single Median Price, or Paired Prices study arms (Fig. 1 and Table 2). Figure 1 presents the overall ordering rates graphically and illustrates how wide the variation in ordering rates can be relative to ordering levels. Table 2 shows that for every 100 face-to-face encounters, clinicians in the Control arm ordered 15.0 (SD 31.1) of the targeted tests, those in the Single Median Price arm ordered 15.0 (SD 16.2) tests, and those in the Paired Prices arms ordered 15.7 (SD 20.5) tests; ANOVA p-value 0.88.
Figure 1.
Boxplots of ordering rates by arm, clinician type, and order type, 2014
Table 2.
Ordering Rates by Arm, Clinician Type, and Order Type, 2014
| Clinicians receiving: | |||||||
|---|---|---|---|---|---|---|---|
| Control | Single median price | Paired internal/external median prices | |||||
| All clinicians, N | 407 | 396 | 402 | ||||
| Mean | SD | Mean | SD | Mean | SD | p-value* | |
| Overall | 15.0 | 31.1 | 15.0 | 16.2 | 15.7 | 20.5 | 0.88 |
| Designated to be completed internally | 4.0 | 6.9 | 4.3 | 7.6 | 4.5 | 8.2 | 0.63 |
| Inappropriate | 0.3 | 0.6 | 0.3 | 0.5 | 0.3 | 0.8 | 0.60 |
| Appropriate | 1.9 | 4.7 | 1.8 | 3.6 | 2.0 | 4.1 | 0.82 |
| Primary care, N | 235 | 250 | 243 | ||||
| Mean | SD | Mean | SD | Mean | SD | ||
| Overall | 11.6 | 10.6 | 11.8 | 8.1 | 12.2 | 8.8 | 0.75 |
| Designated to be completed internally | 3.0 | 3.9 | 3.5 | 3.7 | 3.6 | 3.7 | 0.19 |
| Inappropriate | 0.3 | 0.6 | 0.3 | 0.4 | 0.4 | 0.8 | 0.25 |
| Appropriate | 1.1 | 1.9 | 1.2 | 1.9 | 1.4 | 2.2 | 0.40 |
| Specialists, N | 172 | 146 | 159 | ||||
| Mean | SD | Mean | SD | Mean | SD | ||
| Overall | 19.6 | 45.8 | 20.5 | 23.5 | 21.1 | 29.9 | 0.92 |
| Designated to be completed internally | 5.4 | 9.5 | 5.8 | 11.4 | 5.9 | 12.0 | 0.90 |
| Inappropriate | 0.3 | 0.8 | 0.2 | 0.6 | 0.2 | 0.6 | 0.74 |
| Appropriate | 2.8 | 6.8 | 2.9 | 5.3 | 3.0 | 5.8 | 0.98 |
*One-way analysis of variance
Ordering Rates: Internal, Inappropriate, and Appropriate
We also found no significant difference across arms with respect to orders designated to be completed internally or under clinical circumstances considered inappropriate or appropriate (Table 2).
For every 100 face-to-face encounters, clinicians in the Control arm designated 4.0 (SD 6.9) orders be completed internally, while those in the Single Median Price arm designated 4.3 (SD 7.6) orders to occur within Atrius, and those in the Paired Internal/External Median Prices arm specified that 4.5 (SD 8.2) orders to be completed internally; ANOVA p = 0.63.
For the clinical circumstances in which we could assess whether orders were inappropriate, clinicians in the Control arm ordered 0.3 (SD 0.6) tests, those in the Single Median Price arm ordered 0.3 (SD 0.5) tests, and those in the Paired Prices arms ordered 0.3 (SD 0.8) tests per 100 face-to-face encounters; ANOVA p-value 0.60. This pattern of results extended to the two clinical scenarios where orders were appropriate; clinicians in the Control arm ordered 1.9 (SD 4.7) tests, those in the Single Median Price arm ordered 1.8 (SD 3.6) tests, and those in the Paired Prices arms ordered 2.0 (SD 4.1) tests per 100 face-to-face encounters; ANOVA p = 0.82.
Primary Care versus Specialist Clinicians
We found the same non-significant differences in ordering rates between study arms when we analyzed 728 primary care clinicians separately from 477 specialists (Table 2). However, the two groups of clinicians exhibited different ordering levels and variation in their ordering rates. Specialists ordered nearly twice as many imaging studies or procedures overall per 100 face-to-face encounters compared to primary care clinicians. Mean overall ordering rates for specialists ranged from 19.6 to 21.1 across the three study arms compared with primary care clinicians’ mean overall rate of 11.6–12.2; p-values 0.75 and 0.92, respectively. Variation in overall ordering rates was also greater among specialists compared to primary care clinicians with the SD for specialists ranging from 23.5 to 45.8, whereas primary care clinicians’ SD was between 8.1 and 10.6.
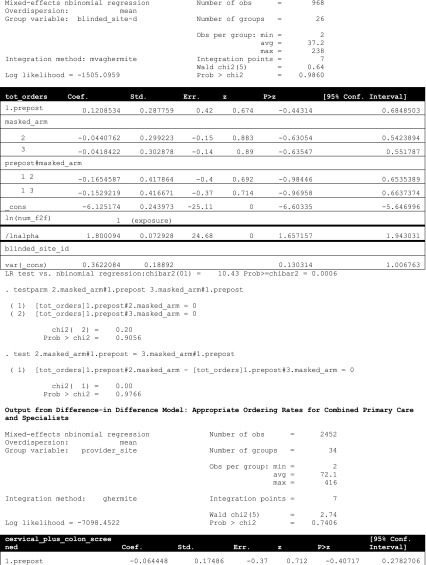
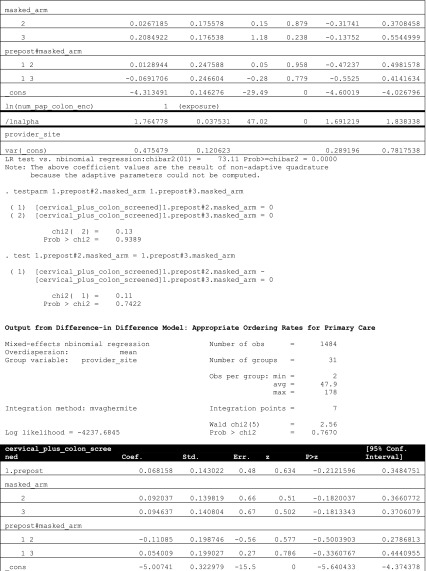
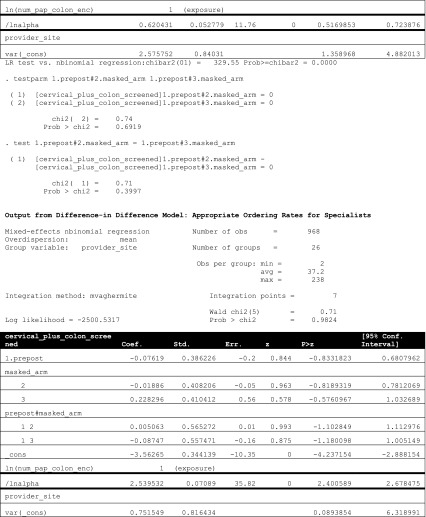
Our sensitivity analyses demonstrated that the findings were robust to operationalizing ordering rates as being inclusive or exclusive of non-face-to-face encounters. We also found no difference between study arms when using a difference-in-difference regression model (Appendix Table 7).
Table 7.
Output from Difference-in Difference Models
DISCUSSION
To our knowledge, this is the largest randomized study of prospectively sharing paid-price information on imaging studies and procedures with clinicians at the point of care.5 – 20 This study suggests that, in contrast to the prior literature that mainly presented charge information to trainees in hospital settings, the display of paid prices to fully trained clinicians in an ACO setting does not necessarily lower ordering rates.
We also show that clinicians—at least those working in this particular ACO—do not differentially respond to price information when it is presented either as a Single Median Price or a Paired Internal/External Price. Price information also does not seem to be differentially applied to clinical scenarios in which ordering would be considered “inappropriate;” it may be reassuring that price information appears to have no impact on ordering in clinical scenarios considered “appropriate.”
Our non-significant findings exist despite the intensity of the price transparency intervention, the use of actual ordering data for assessment (not clinician self-report or claims that only represent care that has been completed and billed for), the evaluation duration being twice as long as in prior studies, and our having the power to detect a change that is one-fifth the size of what other studies have been powered to detect.5 – 20
Our findings are timely because ACOs are a type of delivery system that continues to proliferate across the US. The capabilities within the ACO we studied—the ability of organizations to calculate their own paid prices and insert them into EHRs so that clinicians can see the prices of the services while they are placing orders—are capabilities other ACOs have or are acquiring.
Three major factors likely explain our non-significant findings. First and foremost, Atrius clinicians work for an organization that has been involved in risk-bearing contracts for decades, and these clinicians have indicated that they see themselves as stewards of health care costs.18 Second, even though fully licensed active clinicians do not know specific prices, they may recognize the relative cost of services.33 Third, the clinicians in this intervention received paid-price information, not charges, so prices may not have seemed as high as clinicians might have expected them to be; this notion is substantiated by the qualitative interviews that we conducted.27 Lastly, we were not able to systematically collect information pertaining to the degree to which paid prices may have engendered different types of clinical interations between clinicians and patients before orders were placed.
There are limitations to our study. Our study was conducted at a single ACO that may not be generalizable to other health care organizations or clinicians. Displaying price information in settings where clinicians have not been acculturated to the idea of value-conscious care could still have an effect on clinician ordering rates. Our ability to identify some orders as inappropriate or appropriate, while novel, is still rudimentary; findings may differ if additional orders could be classified as inappropriate or appropriate. Similarly, although we had information on when clinicians designated orders internally, this designation was not required as a part of ordering, so findings could be different if we had more granular ordering details. Control group contamination may be a concern, but our qualitative interviews confirmed that clinicians did not confer with one another about price information.27 , 34 Lack of contamination concern is not surprising—even in prior hospital-based price transparency interventions where trainees work in teams, cross-cover, and constantly sign-out to one another, contamination was not found to be a significant factor.6 – 15 Some may be concerned about the possibility that the initial memo may have constituted a co-intervention, but numerous studies find that clinicians need repeated and ongoing exposure to information in order to change ordering behavior or practice patterns, so the possibility of an intervention effect from the one-time distribution of a memo is likely very remote; our qualitative interviews also confirmed that clinicians did not recall the contents of the memo.16 , 35 Lastly, we did not study how clinicians may respond to patient out-of-pocket spending, which may be an alternate price transparency strategy to consider.36
Conclusions
Clinicians are increasingly expected to act as good stewards of health care resources.37 – 40 To assist clinicians in value-conscious ordering practices, organizations may be considering including price displays in their EHRs. However, providing clinicians with price information does not necessarily lower test ordering rates. Further study is needed to understand the contextual, motivational, and behavioral factors that explain this result. Those with a particular interest in removing waste from the health care system may want to consider strategies outside of physician-targeted price transparency.27 Price transparency’s other benefits, such as the ability to improve patient and provider shared decision-making, is an important future research direction.
Abbreviations
- ACO
Accountable care organization
- EHR
Electronic health record
- PEI
Price Education Initiative
- CT
Computed tomography
- MRI
Magnetic resonance imaging
- X-ray
X-radiation
Appendix
Compliance with Ethical Standards
Contributors
We appreciate the assistance our organizational partner, Atrius Health, provided for this study.
Funder
This work was financially supported by the Robert Wood Johnson Foundation Health Care Financing Organization.
Prior Presentations
This paper received a “Best Abstract” Award at the 2015 AcademyHealth Annual Research Meeting, the premier meeting for health services research. This study was also presented at the 2015 Society of General Internal Medicine Annual Meeting.
Financial Disclosure
The authors have no financial relationships relevant to this article to disclose. The sponsor had no role in the design and conduct of the study; in the collection, analysis, and interpretation of the data; or in the preparation, review, or approval of the manuscript or the decision to submit.
Conflict of Interest
The authors have no conflicts of interest to disclose, except Dr. Thomas D. Sequist is a member on Aetna’s Racial and Ethnic Equality Committee. The content of this manuscript is solely the responsibility of the authors and does not represent the official views of the Veterans Health Administration, the National Center for Ethics in Health Care, or the US Government.
Authorship
Alyna T. Chien: Dr. Chien conceptualized and designed the study; acquired, analyzed and interpreted the data; drafted the initial and critically revised the manuscript; obtained funding, provided administrative, technical, and material support; had full access to all of the data in the study; and takes responsibility for the integrity of the data and the accuracy of the data analysis. Kate E. Koplan, Lisa S. Lehmann and Anna D. Sinaiko: Drs. Koplan, Lehmann and Sinaiko interpreted the data and critically revised the manuscript. Laura A. Hatfield, Carter R. Petty: Dr. Hatfield and Mr. Petty analyzed and interpreted the data, and critically revised the manuscript. Meredith B. Rosenthal and Thomas D. Sequist: Drs. Rosenthal and Sequist conceptualized and designed the study; interpreted the data; critically revised the manuscript, and obtained funding.
Footnotes
TRIAL REGISTRATION
clinicaltrials.gov Identifier: NCT02611999
References
- 1.Bentley TG, Effros RM, Palar K, Keeler EB. Waste in the US health care system: a conceptual framework. Milbank Q. 2008;86(4):629–659. doi: 10.1111/j.1468-0009.2008.00537.x. [DOI] [PMC free article] [PubMed] [Google Scholar]
- 2.Boyd C, Darer J, Boult C, Fried L. Clinical practice guidelines and quality of care for older patients with multiple comorbid diseases: implications for pay for performance. JAMA. 2005;294(6). http://jama.jamanetwork.com/article.aspx?articleid=201377. Accessed 21 Oct 2016. [DOI] [PubMed]
- 3.Rathod RH, Farias M, Friedman KG, Graham D, Lock JE. A novel approach to gathering and acting on relevant clinical information: SCAMPs. 2012;5(4):343–353. doi:10.1111/j.1747-0803.2010.00438.x.A. [DOI] [PMC free article] [PubMed]
- 4.Crosson F. Change the microenvironment. Delivery system reform essential to control costs. Mod Healthc. 2009;27(39):20–21. [PubMed] [Google Scholar]
- 5.Cohen DI, Jones P, Littenberg B, Neuhauser D. Does cost information availability reduce physician test usage?: a randomized clinical trial with unexpected findings. Med Care. 1982;20(3):286–292. doi: 10.1097/00005650-198203000-00005. [DOI] [PubMed] [Google Scholar]
- 6.Tierney WM, Miller ME, McDonald CJ. The effect on test ordering of informing physicians of the charges for outpatient diagnostic tests. N Engl J Med. 1990;322(21):1499–1504. doi: 10.1056/NEJM199005243222105. [DOI] [PubMed] [Google Scholar]
- 7.Bates DW, Kuperman GJ, Jha A, et al. Does the computerized display of charges affect inpatient ancillary test utilization? Arch Intern Med. 1997;157(21):2501–2508. doi: 10.1001/archinte.1997.00440420135015. [DOI] [PubMed] [Google Scholar]
- 8.Durand DJ, Feldman LS, Lewin JS, Brotman DJ. Provider cost transparency alone has no impact on inpatient imaging utilization. J Am Coll Radiol. 2013;10(2):108–113. doi: 10.1016/j.jacr.2012.06.020. [DOI] [PubMed] [Google Scholar]
- 9.Everett GD, deBlois CS, Chang PF, Holets T. Effect of cost education, cost audits, and faculty chart review on the use of laboratory services. Arch Intern Med. 1983;143(5):942–944. doi: 10.1001/archinte.1983.00350050100019. [DOI] [PubMed] [Google Scholar]
- 10.Pugh JA, Frazier LM, DeLong E, Wallace AG, Ellenbogen P, Linfors E. Effect of daily charge feedback on inpatient charges and physician knowledge and behavior. Arch Intern Med. 1989;149(2):426–429. doi: 10.1001/archinte.1989.00390020122026. [DOI] [PubMed] [Google Scholar]
- 11.Hampers L, Cha S, Gutglass D. The effect of price information on test-ordering behavior and patient outcomes in a pediatric emergency department. Pediatrics. 1999. http://pediatrics.aappublications.org/content/103/Supplement_1/877.short. Accessed 21 Oct 2016. [PubMed]
- 12.Marton KI, Tul V, Sox HC. Modifying test-ordering behavior in the outpatient medical clinic. A controlled trial of two educational interventions. Arch Intern Med. 1985;145(5):816–821. doi: 10.1001/archinte.1985.00360050060009. [DOI] [PubMed] [Google Scholar]
- 13.Gama R, Nightingale P, Broughton PM, et al. Modifying the request behaviour of clinicians. J Clin Pathol. 1992;45(3):248–249. http://jcp.bmj.com/content/45/3/248.abstract. Accessed 21 Oct 2016. [DOI] [PMC free article] [PubMed]
- 14.Sachdeva R, Jefferson L, Coss-Bu J, et al. Effects of availability of patient-related charges on practice patterns and cost containment in the pediatric intensive care unit. Crit Care Med. 1996;24(3):501–506. http://journals.lww.com/ccmjournal/Abstract/1996/03000/Effects_of_availability_of_patient_related_charges.22.aspx. Accessed 21 Oct 2016. [DOI] [PubMed]
- 15.Schroeder S, Kenders K, Cooper J, Piemme T. Use of laboratory tests and pharmaceuticals: variation among physicians and effect of cost audit on subsequent use. JAMA. 1973;225(8):969–973. http://jama.jamanetwork.com/article.aspx?articleid=350098. Accessed 21 Oct 2016. [PubMed]
- 16.Feldman LS, Shihab HM, Thiemann D, et al. Impact of providing fee data on laboratory test ordering: a controlled clinical trial. JAMA Intern Med. 2013;173(10):903–908. doi: 10.1001/jamainternmed.2013.232. [DOI] [PubMed] [Google Scholar]
- 17.Berwick D, Coltin K. Feedback reduces test use in a health maintenance organization. JAMA. 1986;255(11):1450–1454. http://jama.jamanetwork.com/article.aspx?articleid=403313. Accessed 21 Oct 2016. [PubMed]
- 18.Horn DM, Koplan KE, Senese MD, Orav EJ, Sequist TD. The impact of cost displays on primary care physician laboratory test ordering. J Gen Intern Med. 2014;29(5):708–714. doi: 10.1007/s11606-013-2672-1. [DOI] [PMC free article] [PubMed] [Google Scholar]
- 19.Fang DZ, Sran G, Gessner D, et al. Cost and turn-around time display decreases inpatient ordering of reference laboratory tests: a time series. BMJ Qual Saf. 2014;23(12):994–1000. doi: 10.1136/bmjqs-2014-003053. [DOI] [PubMed] [Google Scholar]
- 20.Tierney W, Miller M, Overhage J, Mcdonald C. Physician inpatient order writing on microcomputer workstations—effects on resource utilization. JAMA. 1993;269(3):379–383. doi: 10.1001/jama.1993.03500030077036. [DOI] [PubMed] [Google Scholar]
- 21.Sinaiko AD, Rosenthal MB. Increased price transparency in health care—challenges and potential effects—NEJM. N Engl J Med. 2011:891–894. doi:10.1056/NEJMp1100041. [DOI] [PubMed]
- 22.Shortell SM, Wu FM, Lewis VA, Colla CH, Fisher ES. A taxonomy of accountable care organizations for policy and practice. Health Serv Res. 2014;49(6):1883–1899. doi: 10.1111/1475-6773.12234. [DOI] [PMC free article] [PubMed] [Google Scholar]
- 23.Song Z, Safran D, Landon B, Landrum M. The “Alternative Quality Contract” in Massachusetts, based on a global budget, lowered medical spending and improved quality. Health Aff. 2012. http://content.healthaffairs.org/content/31/8/1885.long. Accessed 21 Oct 2016. [DOI] [PMC free article] [PubMed]
- 24.Sequist T, Schneider E. Quality monitoring of physicians: linking patients’ experiences of care to clinical quality and outcomes. JGIM. 2008:1784–1790. doi:10.1007/s11606-008-0760-4. [DOI] [PMC free article] [PubMed]
- 25.Sequist T. Physician performance and racial disparities in diabetes mellitus care. Arch Intern Med. 2008;168(11):1145–1151. http://archpsyc.jamanetwork.com/article.aspx?articleid=414277. Accessed 21 Oct 2016. [DOI] [PubMed]
- 26.Sequist T, Adams A. Effect of quality improvement on racial disparities in diabetes care. Arch Intern Med. 2006;166:675–681. http://archpedi.jamanetwork.com/article.aspx?articleid=410023. Accessed 21 Oct 2016. [DOI] [PubMed]
- 27.Schiavoni KH, Lehmann LS, Guan W, Rosenthal M, Sequist TD, Chien AT. How primary care physicians integrate price information into clinical decision-making. J Gen Intern Med. 2016 doi: 10.1007/s11606-016-3805-0. [DOI] [PMC free article] [PubMed] [Google Scholar]
- 28.Isaac T, Rosenthal MB, Colla CH, et al. Specificity of Overuse Measurement Using Structured Data from Electronic Health Records: A Chart Review Analysis. (In Progress).
- 29.Rosenberg A, Agiro A, Gottlieb M, et al. Early trends among seven recommendations from the choosing wisely campaign. JAMA Intern Med. 2015;19801(12):1. doi: 10.1001/jamainternmed.2015.5441. [DOI] [PubMed] [Google Scholar]
- 30.Consumer Reports. Choosing Wisely campaign brochures. http://consumerhealthchoices.org/campaigns/choosing-wisely/#materials. Accessed 21 Oct 2016.
- 31.(NQMC) NQMC. Colorectal cancer screening: percentage of patients 50 to 75 years of age who had appropriate screening for colorectal cancer. https://www.qualitymeasures.ahrq.gov/content.aspx?id=48811.
- 32.Agency for Healthcare Research and Quality. Chronic Condition Indicator (CCI) for ICD-9-CM. http://www.hcup-us.ahrq.gov/toolssoftware/chronic/chronic.jsp. Accessed 21 Oct 2016.
- 33.Allan GM, Lexchin J. Physician awareness of diagnostic and nondrug therapeutic costs: a systematic review. Int J Technol Assess Health Care. 2008;24(2):158–165. doi: 10.1017/S0266462308080227. [DOI] [PubMed] [Google Scholar]
- 34.Torgerson DJ. Contamination in trials: is cluster randomisation the answer? BMJ. 2001;322(7282):355–357. doi: 10.1136/bmj.322.7282.355. [DOI] [PMC free article] [PubMed] [Google Scholar]
- 35.Jones SS, Rudin RS, Perry T, Shekelle PG. Health information technology: an updated systematic review with a focus on meaningful use. Ann Intern Med. 2014;160(1):48–54. doi: 10.7326/M13-1531. [DOI] [PubMed] [Google Scholar]
- 36.Whaley C, Schneider Chafen J, Pinkard S, et al. Association between availability of health service prices and payments for these services. JAMA. 2014;312(16):1670–1676. doi: 10.1001/jama.2014.13373. [DOI] [PubMed] [Google Scholar]
- 37.Ginsburg S, Bernabeo E, Holmboe E. Doing what might be “Wrong”. Acad Med. 2014;89(4):664–670. doi: 10.1097/ACM.0000000000000163. [DOI] [PubMed] [Google Scholar]
- 38.Sabbatini AK, Tilburt JC, Campbell EG, Sheeler RD, Egginton JS, Goold SD. Controlling health costs: physician responses to patient expectations for medical care. J Gen Intern Med. 2014;29(9):1234–1241. doi: 10.1007/s11606-014-2898-6. [DOI] [PMC free article] [PubMed] [Google Scholar]
- 39.Reuben DB, Cassel CK. Physician stewardship of health care in an era of finite resources. JAMA. 2011;306(4):430–431. doi: 10.1001/jama.2011.999. [DOI] [PubMed] [Google Scholar]
- 40.Chien AT, Rosenthal MB. Waste not, want not: promoting efficient use of health care. Ann Intern Med. 2013;158(1):67–68. doi: 10.7326/0003-4819-158-1-201301010-00014. [DOI] [PubMed] [Google Scholar]


