Abstract
Purpose
To predict the organ-at-risk (OAR) dose levels achievable with proton beam therapy (PBT), solely based upon the geometric arrangement of the target volume in relation to the OARs. Comparison to an alternative therapy yields a prediction of the patient-specific benefits offered by PBT. This could enable a physician at a hospital without proton capabilities to make a better-informed referral decision, or aid patient selection in model-based clinical trials.
Methods and Materials
Skull-base tumors were chosen to test the method, owing to their geometric complexity and multitude of nearby OARs. By exploiting correlations between dose and distance-to-target in existing PBT plans, models were independently trained for six types of OAR: brainstem, cochlea, optic chiasm, optic nerve, parotid gland and spinal cord. Once trained, the models could estimate the feasible dose-volume histogram and generalized equivalent uniform dose (gEUD) for OAR structures of new patients. Models were trained using 20 patients and validated with a further 21 patients. Validation was achieved by comparing the predicted gEUD to that of the actual PBT plan.
Results
The predicted and planned gEUD were in good agreement: considering all OARs, the prediction error was +1.4 ± 5.1 Gy (mean ± SD) and Pearson’s correlation coefficient was 93%. When compared to an IMRT plan, the model could classify whether an OAR structure would experience a gain with a sensitivity of 93% (95% CI: 87% – 97%) and a specificity of 63% (95% CI: 38% – 84%).
Conclusions
We trained and validated models that quickly and accurately predict the patient-specific benefits of PBT for skull-base tumors. Similar models could be developed for other tumor sites. Such models are useful when an estimation of the feasible benefits of PBT is desired, but the experience and/or resources required for treatment planning are unavailable.
Introduction
The rationale for proton beam therapy (PBT) resides in its ability to deliver more conformal dose distributions than advanced photon therapy techniques, allowing dose to organs-at-risk (OARs) to be reduced whilst maintaining high target dose. The magnitudes of these gains are expected to be largely determined by the patient-specific geometric arrangement of the target in relation to the OARs.
Although becoming increasingly popular (1), PBT is likely to remain rare due to the high costs involved. Limited capacity drives an endeavor to identify patients who are expected to receive the greatest benefits from PBT. This is difficult to achieve in practice because cancer centers without proton capabilities possess neither the clinical experience nor the proton treatment planning system (TPS) necessary to make a well-informed referral decision. Thus, referrals are often restricted to cancers where the gain is historically highest, neglecting cases where a patient’s geometry permits an increased gain (2,3). In Germany, a workflow has been proposed whereby a plan can be requested from a PBT center before the referral decision is made, but this strategy is resource intensive (4). Jakobi et al recently showed that primary tumor location correlates with benefit in head-and-neck cancer, but this could not sufficiently describe interpatient variation (5).
To design randomized controlled trials to assess the efficacy of PBT with respect to an alternative photon therapy, Langendijk et al have proposed a promising model-based approach (6,7). Patients are enrolled if their expected reduction in normal tissue complication probability (NTCP) is above some threshold. In this way, the clinical trial looks for the benefits of PBT only in patients where it is theoretically expected. Patients whose expected reduction in NTCP is above another higher threshold are excluded, in order to maintain equipoise. This approach is resource intensive since it requires both proton and photon treatment planning for every patient, in order to make the NTCP comparison.
This work aims to develop a tool that can quickly predict the patient-specific benefits of PBT, which might aid physicians to make better-informed referral decisions. It could also provide pre-selection to model-based trials by estimating the NTCP reduction using far fewer resources. Furthermore, the tool could help persuade insurance companies of the benefits of PBT when a treatment plan is unavailable.
The tool should be fully automated (i.e. no PBT experience is required) and fast (i.e. yield the prediction within seconds to minutes, rather than the hours to days usually associated with treatment planning). To achieve these goals, a knowledge-based approach is suitable. This involves training a model upon geometric patterns present in the dose distributions of existing PBT treatment plans, before using this model to predict the feasible dose levels for the OARs of a yet-to-be-planned patient.
The aim of this study is twofold. First, to develop a geometric knowledge-based tool for predicting OAR dose levels achievable with PBT and to verify its speed and accuracy. Second, to demonstrate how the tool would be used clinically to predict the benefits of PBT with respect to an alternative therapy.
Methods and Materials
Patient cohort and treatment planning
A cohort of clinically-approved treatment plans for skull-base tumors (clival chordoma and chondrosarcoma) were used to train and validate predictive models. This site offers a rich environment for this study, due to its geometric complexity and the multitude of nearby OARs. Models were trained for each of the following OAR types: brainstem, cochlea, optic chiasm, optic nerve, parotid gland and spinal cord.
Treatment plans were designed at our institution using a combination of PBT and intensity modulated photon therapy (IMRT). The PBT component was delivered using passively scattered proton therapy (PSPT), though our institute recently began treating this site using pencil beam scanning (PBS). Further details are provided in the supplementary material. These two components were separated for the purposes of this study, with the PSPT plans used during model training and validation and the IMRT plans used as the alternative therapy during the clinical demonstration.
Models were trained using 20 PSPT plans and validated with a further 21 PSPT plans. Not every OAR structure had been delineated for every patient; the total number of delineated OARs is summarized in Table 1.
Table 1.
The number of structures N, the gEUD prediction error (mean ± SD), the p-value of a paired t-test to assess differences between the predicted and planned gEUD, and Pearson’s correlation coefficient r. Results are given for each OAR type and for each cohort.
| Training cohort
|
Validation cohort
|
PBS cohort
|
|||||||
|---|---|---|---|---|---|---|---|---|---|
| N | N | Error [Gy] | P | r | N | Error [Gy] | p | r | |
| Brainstem | 20 | 21 | −0.7 ± 4.2 | 0.5 | 79% | 10 | +1.1 ± 2.1 | 0.2 | 36% |
| Cochlea | 40 | 40 | +0.3 ± 4.6 | 0.7 | 95% | 20 | +3.2 ± 4.4 | <0.01 | 97% |
| Optic chiasm | 17 | 20 | +3.8 ± 5.3 | <0.01 | 88% | 5 | +6.3 ± 7.0 | 0.2 | 96% |
| Optic nerve | 36 | 40 | +3.2 ± 5.6 | <0.01 | 85% | 10 | +3.3 ± 3.1 | 0.01 | 93% |
| Parotid | 14 | 18 | −0.1 ± 4.2 | 0.9 | 77% | 10 | +2.1 ± 3.0 | 0.06 | 87% |
| Spinal cord | 10 | 10 | +1.5 ± 4.0 | 0.3 | 92% | 5 | +4.8 ± 2.8 | 0.03 | 97% |
|
| |||||||||
| All OARs | 137 | 149 | +1.4 ± 5.1 | <0.001 | 93% | 60 | +3.1 ± 4.1 | <10−6 | 96% |
Knowledge-based approach
Several geometric knowledge-based methods were previously developed to predict OAR dose levels achievable with advanced photon therapies (8–12). They were developed within two contexts. First, treatment plan quality assurance, in an attempt to detect suboptimal plans and automate the decision to replan. Second, to provide planning objectives to initiate the treatment planning process. Most of these methods start from the concept of a distance-to-target quantity, which is the shortest distance from a point to the surface of the target structure. This study modifies the method developed by Appenzoller et al (10), and adapts it to predict the achievable OAR dose levels of PBT plans. The general principles are outlined below with more details provided in the supplementary material.
Data pre-processing
The method uses 3D arrays of dose, distance-to-target and OAR masks upon a common grid. Although dose arrays were directly extracted from DICOM files, the target and OAR structure information was stored as contour sets. Structure masks were constructed by rasterizing contours onto the dose grid and stacking the resulting 2D masks. The distance-to-target array was computed by applying a Euclidean distance transform to the boundary voxels of the target structure mask. Voxels within the target structure were assigned negative distance-to-target.
Model training
Each OAR is divided into subvolumes of shells surrounding the surface of the target structure. That is, the kth OAR subvolume corresponds to the portion of the OAR that satisfies (k − 1)w < r ≤ kw, where r is the distance-to-target and w = 3 mm is the shell width. Note that k ≤ 0 corresponds to subvolumes that overlap the target structure. The clinical target volume (CTV) was chosen as the target structure since PBT treatment planning uses a beam-specific asymmetric expansion (13).
The method fundamentally assumes that the dose-volume histogram (DVH) of each OAR subvolume, containing a small range of distance-to-target, is universal (i.e. the DVH of the kth subvolume is the same in all patients). Thus, interpatient variation in OAR DVH originates solely from differences in the distance-to-target histogram. A model is trained upon these spatial patterns in existing treatment plans, and can then predict the OAR DVH for a new patient. Deviations from this assumption lead to a spread in the model parameters during training and a degradation of prediction accuracy.
Predictive models are trained independently for each OAR type. Also, a single combined model is trained for symmetric OAR types, because both the left and right instances should exhibit the same spatial patterns (e.g. a single cochlea model). This doubles the training cohort size for these OAR types. Since patients were prescribed different doses, each dose distribution was normalized to the mean CTV dose before training.
Figure 1a demonstrates how dose decreases as distance-to-target increases within the brainstem of an example PBT plan (binned columns correspond to shell subvolumes). The differential DVH within each subvolume is fit by a skew-normal distribution f(D; θ), where D is the dose and θ={θ1, θ2, θ3} are parameters corresponding to the location, scale and shape of the distribution, respectively. Parameter maximum-likelihood estimates are extracted from each fit, as exemplified by Figures 1b–d.
Figure 1.
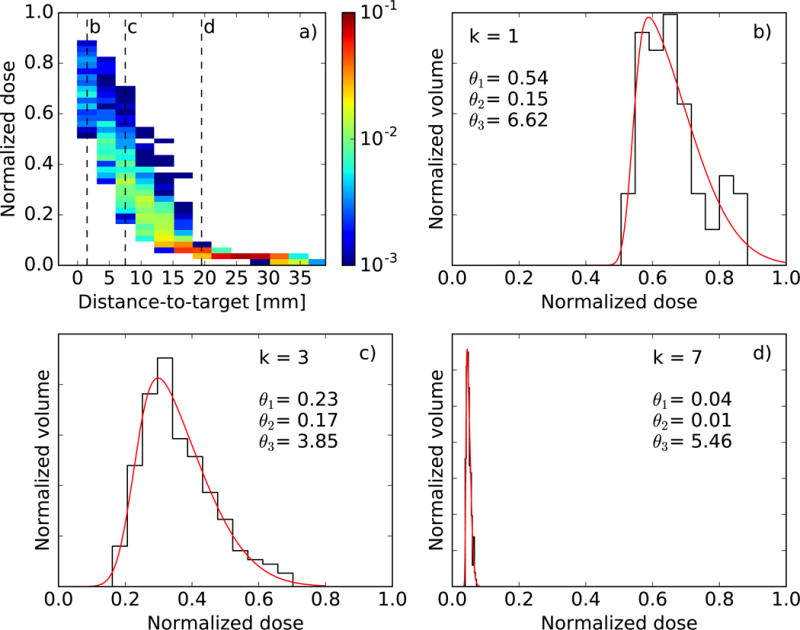
(a) 2D histogram of dose versus distance-to-target for a single brainstem structure. Color indicates the fractional volume. (b–d) Skew-normal fits (red) to the dose distribution (black) found in three different subvolumes, indicated by the dashed lines in (a). Maximum-likelihood parameter estimates are also displayed. Dose is normalized to the mean target dose.
Once every structure of this OAR type in the training cohort has been processed, there is a spread of parameter estimates for each subvolume, as shown in Figures 2a–c for the brainstem. Despite this spread, there are still clear trends in how θ1 and θ2 depend upon distance-to-target. The trend in θ3 is less apparent, but this parameter is less constrained by the fit (for this reason it is limited to −10 ≤ θ3 ≤10) and has less impact upon the predicted DVHs. The average parameters are computed within each subvolume (see Figures 2d–f), and these embody the predictive model.
Figure 2.
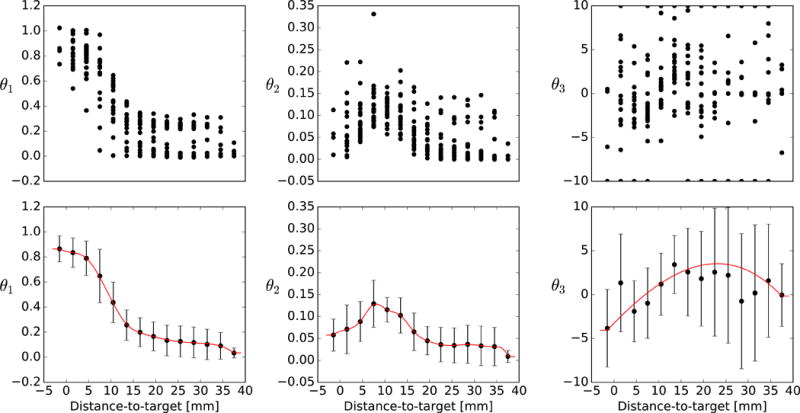
(a–c) Maximum-likelihood estimates of parameters θ1, θ2 and θ3 (location, scale, shape) yielded by each shell in each OAR structure. (d–f) The mean and standard deviation of these parameter estimates, accompanied by the spline used to interpolate between shells (red line). Parameter estimates are shown for the brainstem model.
Model validation
The method used to predict the DVH of an OAR structure depends upon the structure size. For structures containing more than 100 voxels, the subvolume DVHs were predicted using the average parameters . These were then weighted by the fractional volume of each subvolume vk, and summed to yield the total DVH according to . For structures containing less than 100 voxels, the DVHs of individual voxels were predicted according to their distance-to-target and summed, i.e. where j labels voxels. In this case, the average parameters were interpolated between subvolumes using a cubic smoothing spline, which weighted the average parameters by the inverse of their variance (see Figures 2d–f). Parameters were extrapolated outside the fitted distance-to-target range by using the parameter values at the minimum and maximum fitted distance-to-target.
In order to quantify the predictive accuracy of each model, DVHs were predicted for every OAR structure in the validation cohort. Each predicted DVH was then compared to the corresponding DVH of the actual PBT plan. For this comparison, the generalized equivalent uniform dose (gEUD) was used as a DVH metric because it has been linked to clinical outcome (14–18). The gEUD is expressed as
where vi is the fractional volume receiving dose Di. The tissue-specific parameter a describes the volume effect and was taken to be 7 for brainstem (14), 1 for cochlea (15,16), 25 for optic chiasm (14), 25 for optic nerve (14), 1 for parotid (17) and 10 for spinal cord (18).
Clinical demonstration
In a clinical environment without PBT capabilities, a physician may have an existing treatment plan deliverable by a more commonplace technique such as IMRT. In this instance, they would use the models to predict each OAR gEUD achievable with PBT. By comparing these predicted gEUD values to those of the IMRT plan, they can assess the expected patient-specific dosimetric benefits of PBT.
To demonstrate how these models might be used in a clinical environment, the predicted gEUD of the PBT plan was compared to the actual gEUD of the IMRT plan, yielding a predicted ΔgEUD = gEUDPBT − gEUDIMRT. This predicted ΔgEUD was compared to the planned ΔgEUD (computed using the gEUD of the actual PBT plan). Since the IMRT plans for the validation cohort were components of IMRT+PBT plans, they were first normalized such that their mean CTV dose was equal to that of the PBT plan. This provided an IMRT plan that could be directly compared to the PBT plan.
Results
Model validation
Once a model was trained for each OAR type, the DVH of each OAR structure in the validation cohort was predicted. Figure 3 compares the predicted DVHs to the planned DVHs for two example patients. Although Figure 3 directly visualizes the model output, to properly appraise the models we must consider every OAR structure in the validation cohort. The total number of OAR structures of each type is shown in Table 1.
Figure 3.
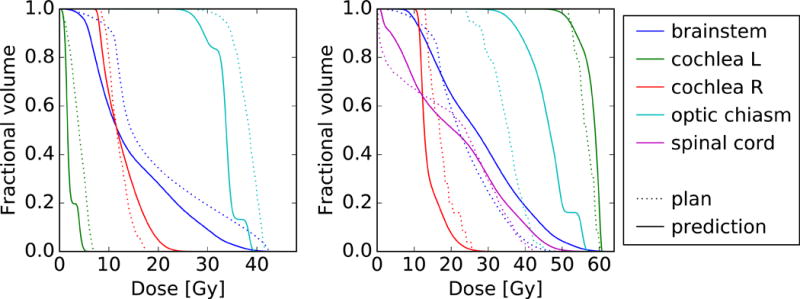
Comparison between the predicted (solid) and planned (dotted) OAR DVHs for two patients in the validation cohort. For clarity, not every OAR structure is shown.
Figure 4 compares the predicted gEUD to the planned gEUD for every OAR structure in the validation cohort. A strong correlation is observed for each model. Considering all OAR types, the Pearson’s correlation coefficient r is 93%. Some OAR types yielded a smaller r since the gEUD was confined to a smaller range.
Figure 4.
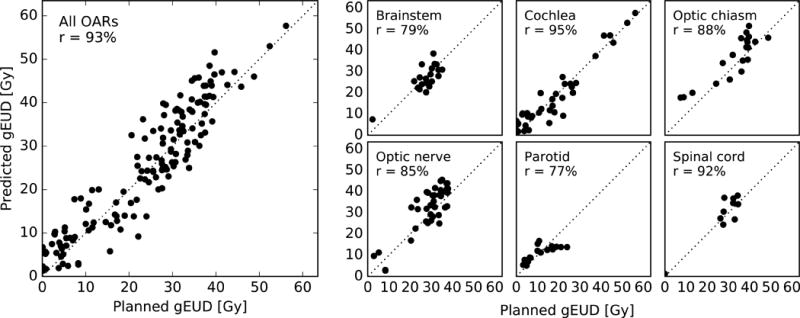
Predicted gEUD versus planned gEUD for every OAR structure in the validation cohort (left) and a breakdown by OAR type (right). Pearson’s r is also shown.
Table 1 shows the prediction errors (predicted minus planned), expressed as mean ± standard deviation (SD). Considering all OAR types, the prediction error was +1.4 ± 5.1 Gy (mean ± SD). Paired 2-sided Student’s t-tests assessed the statistical significance of the prediction errors and found that the optic chiasm and optic nerve models exhibit evidence of bias (p < 0.05). However, the mean error was always smaller than the SD.
Training all six models took 63 s, of which 15 s was occupied by data pre-processing. Predicting the DVHs of all nine OAR structures (i.e. including symmetric pairs) for a single patient took 1.1 s on average, of which 0.9 s was needed for data pre-processing. Computations were performed on an iMac desktop computer with a 3.4 GHz Intel Core i5 processor and 16 GB of RAM.
Clinical Demonstration
The difference in gEUD of a PSPT plan with respect to an IMRT plan, ΔgEUD, was used to assess the patient-specific benefit of proton therapy. Figure 5 compares the predicted ΔgEUD to the planned ΔgEUD. By construction, the prediction errors remained identical to those shown in Table 1. However, Pearson’s r for each OAR type reduced because the variance in ΔgEUD is smaller than the variance in gEUD.
Figure 5.
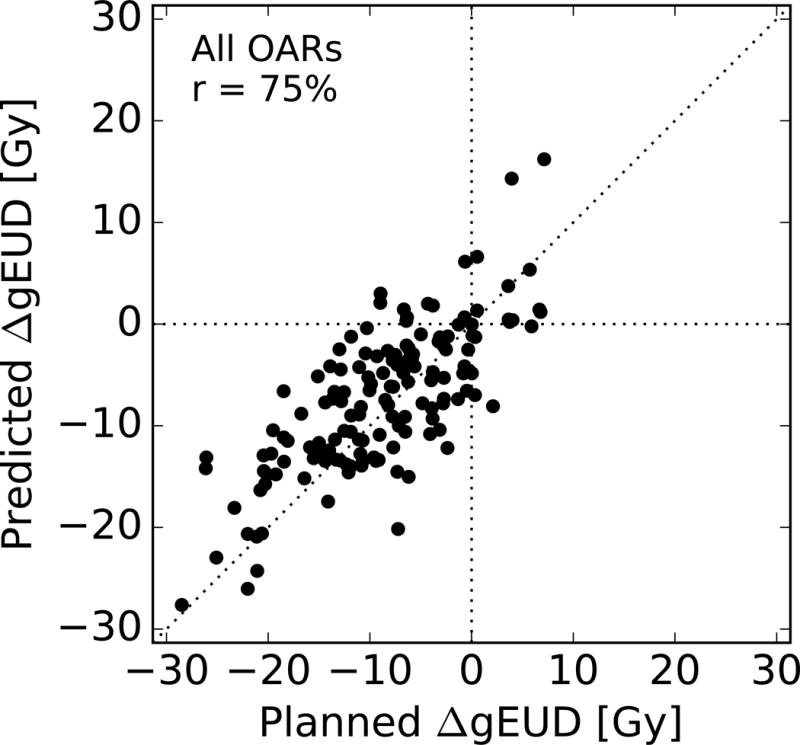
Predicted change in gEUD of a PBT plan with respect to an IMRT plan versus the actual change, for every OAR structure in the validation cohort. Pearson’s r is also shown.
In classifying the difference between PSPT and IMRT as either a gain (ΔgEUD < 0) to an OAR, the sensitivity was found to be 93% (95% CI: 87% – 97%) and the specificity was found to be 63% (95% CI: 38% – 84%). The specificity is lower than the sensitivity because losses are usually smaller than gains (see Figure 5).
Discussion
The accuracy of the method is largely determined by the degree to which its fundamental assumption holds true (i.e. the universality of subvolume DVHs). Since PBT plans feature higher dose gradients than IMRT/VMAT plans, it is expected that deviations from this assumption will lead to greater degradations in predictive accuracy. This is the first time that a geometric knowledge-based method has been applied within the context of PBT, and the level of agreement observed is impressive. Nonetheless, it is instructive to consider how the model accuracy might be improved.
First, parameter universality can be improved by tailoring the subvolume selection criteria to the treatment planning strategy. This would reduce the spread in parameter values during training and improve prediction accuracy. For example, coplanar beams used in prostate treatment planning can be exploited by splitting OARs into in-field and out-of-field components (10). Subvolume selection criteria could also take advantage of multiple target structures (12). However, more restrictive subvolume selection criteria can potentially lead to poorly constrained model parameters (i.e. more susceptible to statistical fluctuations), if there are too few training patients featuring a particular OAR subvolume. Thus, increasing the training cohort size can support more tailored subvolume selection criteria, thereby improving the prediction accuracy.
Second, inconsistent treatment planning criteria have been shown to degrade model accuracy (12). The patient cohort in this study exhibited diversity in the prescribed dose constraints to the target and OAR structures (see supplementary material). However, no statistically significant difference in parameter estimates was observed between patient groups with high (> 52 Gy) and low (≤ 52 Gy) prescribed target dose, suggesting that variation in this dose constraint did not dominate the prediction error. Future work might include these dose constraints as additional predictors, enabling the prediction of personalized treatment plans. However, to constrain such a complex model would require a significantly larger training cohort.
Treatment plans depend upon the strategy for delivery (e.g. PSPT or PBS, spot size) and planning (e.g. dose constraints, margins, beam angles). The knowledge-based predictions are consistent with the strategy employed in the training cohort. Predicting an alternative strategy introduces a systematic error, due to the difference with the training strategy. If this error is comparable to, or greater than, the SD of prediction errors found during model validation, then a new model should be trained specifically for this alternative strategy. Thus, in addition to knowing the model accuracy, one should be aware of differences in strategy between the model training institute and the intended treatment delivery institute.
To demonstrate this concept, plans predicted by the PSPT-trained model were compared to PBS plans using a separate cohort of 10 patients. A strong correlation in gEUD was observed; considering all OAR types, Pearson’s r is 96%. The prediction error is +3.1 ± 4.1 Gy (mean ± SD), as shown in Table 1. The observed bias is consistent with the more conformal dose distributions found in PBS plans. A model trained specifically on PBS plans would be expected to yield improved prediction accuracy, though may exhibit greater institutional dependence due to variance in spot size.
The method has been shown to be computationally efficient. In particular, it took on average 1.1 s to predict all nine OARs for a single patient. There is also potential for performance improvements due to the parallelism of the problem (i.e. OARs, subvolumes). One can envisage a webtool whereby a structure set is uploaded and the predicted DVHs displayed within seconds. Future work might combine predictive models with an automated segmentation tool, so that predictions can be made from the diagnostic CT scan.
The clinical demonstration showed how the models could be used to predict the difference in gEUD between a PSPT plan and an existing IMRT plan, in order to assess the patient-specific benefits of PBT. A subtlety to this specific cohort is that the PBT and IMRT plans were extracted from composite plans, and so their 3D dose distributions might differ from those of a single-modality plan. However, this effect is expected to be small and does not invalidate the demonstration itself.
Knowledge-based models can support a referral or allocation decision by estimating the dose reduction to each OAR achievable with PBT. Combining this knowledge-based approach with a three-level (dose, toxicity and cost-effectiveness) proton versus photon decision support tool (19) would be fruitful. In decision making, it is helpful to remember that the dose uncertainty is more critical for some OARs than others, e.g. a precise dose estimate is more important for the optic nerve than the parotid gland.
Conclusions
This work trained and validated a set of models to predict the achievable OAR dose levels of PBT treatment plans for skull-base tumors, solely based upon the geometric arrangement of the target volume in relation to the OARs. Considering all OARs in the validation cohort, gEUD was predicted with an error of 1.4 ± 5.1 Gy (mean ± SD) and a Pearson’s correlation coefficient of r = 93%, though it is likely that model accuracy was degraded by inconsistent planning objectives between patients.
This is the first time such a knowledge-based methodology has been applied within the context of PBT; similar models could be trained for other OARs and tumor sites. Future work should connect knowledge-based dosimetric predictions to NTCP models. Such predictions are useful when an estimation of the feasible benefits of PBT is desired, but the experience and/or resources required for treatment planning are unavailable. However, they should not be used blindly without considering non-dosimetric risk factors.
Supplementary Material
Summary.
This work aims to develop models that can predict the patient-specific benefits offered by proton therapy, solely based upon a patient’s geometry. A knowledge-based method trains the models upon geometric patterns observed in a set of existing proton treatment plans for skull base tumors. The models were validated yielding a Pearson’s correlation coefficient of 93%; similar models could be trained for other tumor sites and be used to make better-informed referral decisions.
Acknowledgments
This work was supported by National Institutes of Health grant U19 CA21239.
Footnotes
Publisher's Disclaimer: This is a PDF file of an unedited manuscript that has been accepted for publication. As a service to our customers we are providing this early version of the manuscript. The manuscript will undergo copyediting, typesetting, and review of the resulting proof before it is published in its final citable form. Please note that during the production process errors may be discovered which could affect the content, and all legal disclaimers that apply to the journal pertain.
Conflict of interest statement:
Conflict of interest: none
References
- 1.Jermann M. Particle Therapy Statistics in 2014. Int J Particle Ther. 2015;2:50–54. http://dx.doi.org/10.14338/IJPT-15-00013. [Google Scholar]
- 2.Crellin AM, Burnet NG. Proton beam therapy: the context, future direction and challenges become clearer. Clin Oncol. 2014;26:736–738. doi: 10.1016/j.clon.2014.10.009. http://dx.doi.org/10.1016/j.clon.2014.10.009. [DOI] [PubMed] [Google Scholar]
- 3.Patel S, Parliament M, Kostaras X, et al. Recommendations for the referral of patients for proton-beam therapy, an Alberta Health Services report: A model for Canada? Curr Oncol. 2014;21:251–262. doi: 10.3747/co.21.2207. http://dx.doi.org/10.3747/co.21.2207. [DOI] [PMC free article] [PubMed] [Google Scholar]
- 4.Lühr A, Löck S, Roth K, et al. Concept for individualized patient allocation: ReCompare–remote comparison of particle and photon treatment plans. Radiat Oncol. 2014;9:59. doi: 10.1186/1748-717X-9-59. http://dx.doi.org/10.1186/1748-717X-9-59. [DOI] [PMC free article] [PubMed] [Google Scholar]
- 5.Jakobi A, Bandurska-Luque A, Stützer K, et al. Identification of Patient Benefit from Proton Therapy for Advanced Head and Neck Cancer Patients Based on Individual and Subgroup Normal Tissue Complication Probability Analysis. Int J Radiat Oncol Biol Phys. 2015;92:1165–1174. doi: 10.1016/j.ijrobp.2015.04.031. http://dx.doi.org/10.1016/j.ijrobp.2015.04.031. [DOI] [PubMed] [Google Scholar]
- 6.Langendijk JA, Lambin P, De Ruysscher D, et al. Selection of patients for radiotherapy with protons aiming at reduction of side effects: The model-based approach. Radiother Oncol. 2013;107:267–273. doi: 10.1016/j.radonc.2013.05.007. http://dx.doi.org/10.1016/j.radonc.2013.05.007. [DOI] [PubMed] [Google Scholar]
- 7.Widder J, Van Der Schaaf A, Lambin P, et al. The quest for evidence for proton therapy: Model-based approach and precision medicine. Int J Radiat Oncol Biol Phys. 2016;95:30–36. doi: 10.1016/j.ijrobp.2015.10.004. http://doi.org/10.1016/j.ijrobp.2015.10.004. [DOI] [PubMed] [Google Scholar]
- 8.Wu B, Ricchetti F, Sanguineti G, et al. Patient geometry-driven information retrieval for IMRT treatment plan quality control. Med Phys. 2009;36:5497–5505. doi: 10.1118/1.3253464. http://dx.doi.org/10.1118/1.3253464. [DOI] [PubMed] [Google Scholar]
- 9.Zhu X, Ge Y, Li T, et al. A planning quality evaluation tool for prostate adaptive IMRT based on machine learning. Med Phys. 2011;38:719–726. doi: 10.1118/1.3539749. http://dx.doi.org/10.1118/1.3539749. [DOI] [PubMed] [Google Scholar]
- 10.Appenzoller LM, Michalski JM, Thorstad WL, et al. Predicting dose-volume histograms for organs-at-risk in IMRT planning. Med Phys. 2012;39:7446–7461. doi: 10.1118/1.4761864. http://dx.doi.org/10.1118/1.4761864. [DOI] [PubMed] [Google Scholar]
- 11.Petit SF, van Elmpt W. Accurate prediction of target dose-escalation and organ-at-risk dose levels for non-small cell lung cancer patients. Radiother Oncol. 2015;117:453–458. doi: 10.1016/j.radonc.2015.07.040. http://dx.doi.org/10.1016/j.radonc.2015.07.040. [DOI] [PubMed] [Google Scholar]
- 12.Wang Y, Breedveld S, Heijmen B, et al. Evaluation of plan quality assurance models for prostate cancer patients based on fully automatically generated Pareto-optimal treatment plans. Phys Med Biol. 2016;4268:1–21. doi: 10.1088/0031-9155/61/11/4268. http://dx.doi.org/10.1088/0031-9155/61/11/4268. [DOI] [PubMed] [Google Scholar]
- 13.Paganetti H. Range uncertainties in proton therapy and the role of Monte Carlo simulations. Phys Med Biol. 2012;57:R99–177. doi: 10.1088/0031-9155/57/11/R99. http://dx.doi.org/10.1088/0031-9155/57/11/R99. [DOI] [PMC free article] [PubMed] [Google Scholar]
- 14.Gay HA, Niemierko A. A free program for calculating EUD-based NTCP and TCP in external beam radiotherapy. Phys Medica. 2007;23:115–125. doi: 10.1016/j.ejmp.2007.07.001. http://dx.doi.org/10.1016/j.ejmp.2007.07.001. [DOI] [PubMed] [Google Scholar]
- 15.De Marzi L, Feuvret L, Boule T, et al. Use of gEUD for predicting ear and pituitary gland damage following proton and photon radiation therapy. Br J Radiol. 2015;88:20140413. doi: 10.1259/bjr.20140413. http://dx.doi.org/10.1259/bjr.20140413. [DOI] [PMC free article] [PubMed] [Google Scholar]
- 16.Bhandare N, Jackson A, Eisbruch A, et al. Radiation Therapy and Hearing Loss. Int J Radiat Oncol Biol Phys. 2010;76:S50–S57. doi: 10.1016/j.ijrobp.2009.04.096. http://dx.doi.org/10.1016/j.ijrobp.2009.04.096. [DOI] [PMC free article] [PubMed] [Google Scholar]
- 17.Dijkema T, Raaijmakers CPJ, Ten Haken RK, et al. Parotid gland function after radiotherapy: The combined Michigan and Utrecht experience. Int J Radiat Oncol Biol Phys. 2010;78:449–453. doi: 10.1016/j.ijrobp.2009.07.1708. http://dx.doi.org/10.1016/j.ijrobp.2009.07.1708. [DOI] [PMC free article] [PubMed] [Google Scholar]
- 18.Marucci L, Niemierko A, Liebsch NJ, et al. Spinal cord tolerance to high-dose fractionated 3D conformal proton-photon irradiation as evaluated by equivalent uniform dose and dose volume histogram analysis. Int J Radiat Oncol Biol Phys. 2004;59:551–555. doi: 10.1016/j.ijrobp.2003.10.058. http://dx.doi.org/10.1016/j.ijrobp.2003.10.058. [DOI] [PubMed] [Google Scholar]
- 19.Cheng Q, Roelofs E, Ramaekers BLT, et al. Development and evaluation of an online three-level proton vs photon decision support prototype for head and neck cancer – Comparison of dose, toxicity and cost-effectiveness. Radiother Oncol. 2016;118:281–285. doi: 10.1016/j.radonc.2015.12.029. http://dx.doi.org/10.1016/j.radonc.2015.12.029. [DOI] [PubMed] [Google Scholar]
Associated Data
This section collects any data citations, data availability statements, or supplementary materials included in this article.


