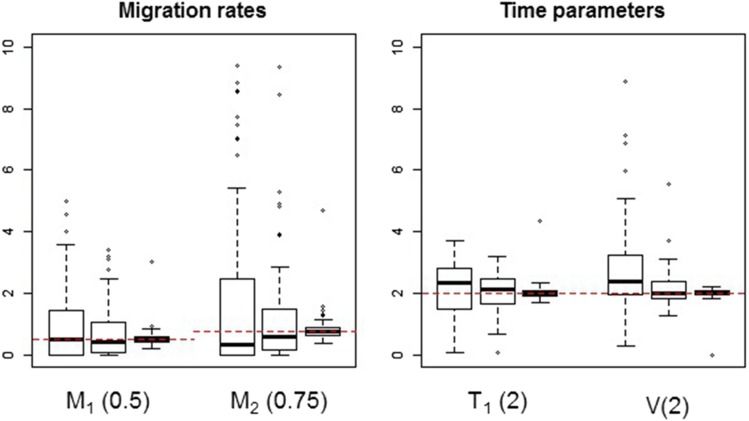
Figure 3.
Estimates of migration rates and time parameters for simulated data. For each parameter, the estimates shown on the left, center, and right-hand-side boxplots are based on sample sizes of 8000, 40,000, and 800,000 loci, respectively. The values stated in parentheses are the true parameter values used to generate the data. Horizontal dashed lines indicate the true parameter values for each group of boxplots.

