Abstract
The nematocyst is the explosive injection system of the phylum Cnidaria, and is one of the fastest delivery systems found in Nature. Exploring its injection mechanism is key for understanding predator–prey interactions and protection against jellyfish stinging. Here we analyse the injection of jellyfish nematocysts and ask how the build-up of the poly-γ-glutamate (pγGlu) osmotic potential inside the nematocyst drives its discharge. To control the osmotic potential, we used a two-channel microfluidic system to direct the elongating nematocyst tubule through oil, where no osmotic potential can develop, while keeping the nematocyst capsule in water at all times. In addition, the flow inside the tubule and the pγGlu concentration profiles were calculated by applying a one-dimensional mathematical model. We found that tubule elongation through oil is orders of magnitude slower than through water and that the injection rate of the nematocyst content is reduced. These results imply that the capsule's osmotic potential is not sufficient to drive the tubule beyond the initial stage. Our proposed model shows that the tubule is pulled by the high osmotic potential that develops at the tubule moving front. This new understanding is vital for future development of nematocyst-based systems such as osmotic nanotubes and transdermal drug delivery.
Keywords: nematocyst, mass transfer modelling, microfluidics
1. Introduction
Nematocysts are ultra-fast stinging organelles that are utilized by most of the Cnidaria phylum (sea anemones, corals, jellyfish, hydra and myxozoans) for prey capture, defense strategies and locomotion [1–3]. Their unique structure and extremely fast penetration rates have fascinated scientists since the pioneering microscopy work of Antonie van Leeuwenhoek at the beginning of the eighteenth century. They are densely distributed along the tentacles and body surface, loaded and ready for firing [4]. Once fired, they cannot be used again, but, while still loaded, they can be effective even outside their biological cells [5].
A single nematocyst consists of a long thin needle-like tubule that is packed with a matrix inside the nematocyst capsule [4]. The tubule base is connected to the capsule wall and upon activation the tubule begins a fascinating inside-out eversion in which it elongates to reach a length of up to 100 times the capsule diameter. The capsule wall is composed of a mesh of proteins, cross-linked by intermolecular disulfide bridges, that provide the elasticity and tensile strength needed to withstand the extremely high internal pressure that drives the process [1,6,7]. The matrix is made of large aggregates of poly-γ-glutamate (pγGlu) and metal cations [8,9]. It is initially trapped inside the capsule, but as water penetrates through the capsule wall the resulting aqueous pγGlu solution leaves the capsule and fills up the tubule internal volume.
The common explanation suggests that an osmotic potential is building up inside the capsule owing to the pγGlu matrix and the osmotic properties of the capsule wall [2,8–10]. According to this explanation, the osmotic potential generates the required forces to fire and elongate the tubule. It has been shown that, as the process begins, the internal capsule pressure increases to 150 bars [11] and this high pressure drives the initial tubule acceleration, reported by Nüchter et al. [12] to be as high as 5 × 10⁶g (where g = 9.81 cm s−2). The high pressure results in a temporary increase in the capsule diameter which quickly relaxes well before the tubule elongation is complete [11, fig. 3]. This extremely high tubule acceleration is utilized to penetrate prey targets such as fish scales and the tough cuticle of crustacean integuments. Past studies have focused on the triggering [13] and the initial few microseconds at the beginning of the tubule elongation process, overlooking the details of the rest of the process, and leaving the impression that the osmotic driven internal pressure in the capsule provides all the forces needed to complete the tubule elongation. However, a rough calculation shows that water penetrating the capsule through its wall dilutes the pγGlu solution such that the capsule loses most of its ability to continue pushing the tubule forward before its elongation is complete. Therefore, in addition to the capsule, another mechanism that can drive the tubule elongation must be identified. Hence, the study hypothesis is that the nematocyst tubule itself plays an important role in its own eversion. To test this hypothesis, we used a specially designed microfluidic platform to measure the elongation process while manipulating the osmotic potential along the tubule. The experimental findings were analysed by a mass transfer model developed here to represent the proposed elongation mechanism.
We begin by describing the experimental set-up and the mathematical model. We continue by presenting the results of the experiments conducted in water and in water–oil environments, the results of the model simulations and the results of the sensitivity analysis. The newly suggested explanation is discussed and its implications for drug delivery and other applications are presented.
2. Experimental methods
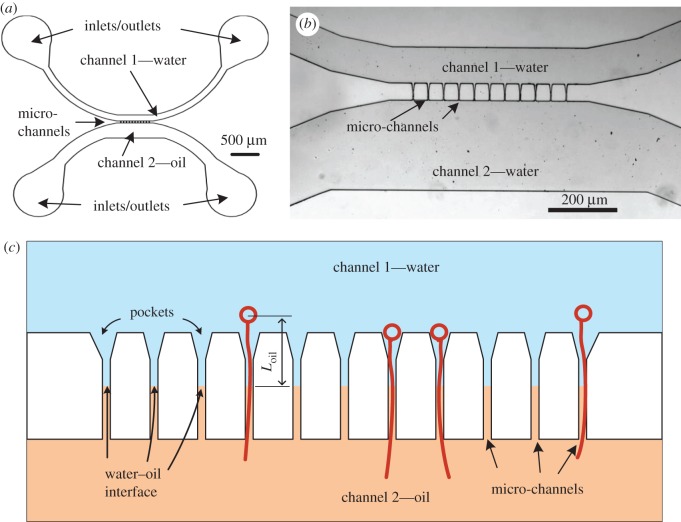
Tentacles from the jellyfish Rhopilema nomadica [14] were collected from Haifa Bay, Israel, and their large isorhiza nematocysts were isolated as described in Rachamim et al. [3] and activated with 1% subtilisin (Sigma). The nematocysts were trapped, activated and their elongation was measured in a microfluidic platform that was specially designed for this study (figure 1). The device consists of parallel micro-channels that bridge between two opposite wide channels. Channel 1 was filled with water and channel 2 was filled with oil for the water–oil experiments. As a control, both channels were filled with water for the water–water experiments. When injecting water into channel 1 and oil into channel 2, a water–oil interface was formed. As shown in figure 1c, its location was defined as the distance from the nematocyst capsule, Loil. Measurements of the elongation dynamics were collected for five values of Loil (140, 85, 70, 65 and 24 µm) and during water-only control experiments.
Figure 1.
The microfluidic platform: (a) a schematic of the microfluidic chip including the inlets and outlets, the two wide channels and the location of the micro-channels; (b) a microscopic image of the platform. The micro-channels in this chip are 50 µm long and 5 µm wide. (c) A representation of the 11 narrow micro-channels that connect between channel 1 and channel 2, the distance between the capsule and the water–oil interface, Loil, and a few discharged nematocysts (not to scale).
The micro-channels are 5 µm wide and 50 µm long except for a single platform that was designed for the Loil = 140 µm experiment for which the micro-channel dimensions were 10 µm wide and 200 µm long. The width of the micro-channels was small enough to trap the nematocysts, which have an external diameter ≥ 10 µm. Using a soft lithography technique [15], the structure of the microfluidic platform was fabricated with a polydimethylsiloxane mould, formed on a silicon wafer using SU8 photoresist (SU-8 2025, Microchem, MA), and sealed on transparent glass slides. The hydrodynamic trapping principle [16,17] was used in the design and the fabrication of these microfluidic devices to provide robust control over the introduction and exchange of the water, oil, capsule suspension and activator solution. Prior to each experiment, the microfluidic chip was filled with deionized water using a syringe pump (KDS LEGATO 210; KDScientific) at a flow rate of 50–100 µl min−1 until all air bubbles were evacuated and the entire chip surface was wet. The nematocyst capsules were injected through the inlets of channel 1 at a flow rate of 5 µl min−1 and trapped in the micro-channel pockets (figure 1c). The water–oil interface was formed in the micro-channels by introducing oil through the inlets of channel 2 at a flow rate of 4 µl min−1, while maintaining the water flow in channel 1. Before adding the activating solution, the flow of both water and oil was stopped. The activating solution (5 µl of 1% subtilisin; Sigma) was added through the inlet of channel 1 using a pipette. Upon activation, the capsule discharged, either back to the space of channel 1 or through the micro-channels. The dynamics of the tubule elongation was recorded using an Andor Neo sCMOS camera that was attached to a Nikon TI inverted epi-fluorescent microscope (with 10× and 20× objective lenses) at a rate of 10–200 frames per second. The length of the elongating tubule as a function of time and the rate of liquid accumulation at the tubule tip were measured using the image processing software ImageJ (NIH).
3. Model derivation
The proposed mechanism of the elongation process is presented here by means of a mathematical mass transport model. The model assumes that an internal pressure is responsible for the force needed to elongate the tubule and that this pressure is building up as a response to an increasing osmotic potential. Instead of limiting the osmotic potential to the nematocyst's capsule, the model assumes that an osmotic potential is developed also along the tubule. The osmotic potential depends on the local concentration of pγGlu; as this concentration depends on the flow of the aqueous pγGlu solution through the system, we focused on formulating the water flow and pγGlu transport along the tubule. The model assumes a one-dimensional approximation and neglects molecular diffusion (the Peclet number, Pe, is approximately 1 × 10⁶ in the water–water experiments and approximately 10–150 in the water–oil experiments). As the model focuses on the tubule elongation dynamics, it does not address the initial ultra-fast stage nor the processes that take place after the tubule reaches its full length (e.g. during which liquid may exit the tubule through its openings).
The distribution of the pγGlu concentration C(x, t) along the tubule is described by the non-conservative form of the solute mass conservation equation,
| 3.1 |
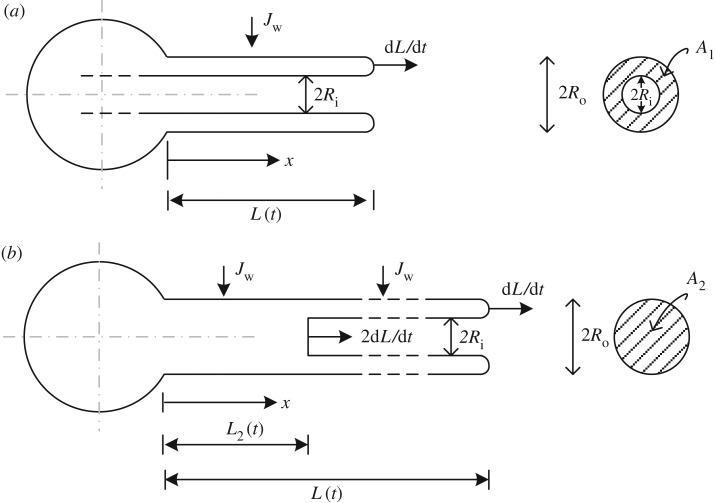
where Q(x, t) is the flow rate in the tubule, x is the axis along the tubule (figure 2), t is the time of the tubule elongation and A is the tubule cross-sectional area, assumed constant except for the change shown in figure 2b. While in figure 2a the tubule's tail is still in the capsule and the cross-sectional area is  , in figure 2b the tail is already everted and is shown inside the tubule. In this case, two cross-sectional areas exist: A1 and
  (Ro and Ri are the outer and inner radii, respectively). For simplicity, the water flux across the tubule wall, Jw, is assumed constant along the tubule section that is immersed in water. Since no osmotic potential can develop in oil, Jw is assumed zero along the oil section. Note that at any time, t, the length of the tubule from the capsule to its tail is defined as L2 (where L2 = 2L−Lend) and equation (3.1) was solved separately for L < Lend/2 and for L > Lend/2 given that A is constant for each case (L = L(t) is the instantaneous tubule length and Lend is its final, fully elongated, length).
Figure 2.
A schematic of the capsule and tubule system. (a) When L(t) < Lend/2 and (b) when L(t) > Lend/2.
A solution of equation (3.1) requires an equation for the flow rate, Q(x, t), and a boundary condition for C(0,t). The flow rate is obtained by a solution of the mass conservation as follows:
| 3.2 |
Given that the flow rate boundary condition at the tubule moving front is Q(L, t) = A1(dL/dt), the solution of equation (3.2) for L(t) > Lend/2 is as follows:
| 3.3 |
| 3.4 |
Equation (3.4) is also the solution when L(t) < Lend/2 for 0 < x < L(t).
To allow continuous and smooth simulations and a well-defined boundary condition at the moving tubule front, measured values of L(t) were fitted to a power law,
 |
3.5 |
where tend is defined as the time needed for the tubule to reach a length of Lend = 356–363 µm for all the experiments except for the Loil = 140 µm experiment where the fully elongated tubule was 335 µm. The curve fitting results are listed in table 1. The table shows that, except for the Loil = 140 µm experiment, a and b are almost the same in all the experiments ( and
and  ).
).
Table 1.
The value of tend and the fitted a and b parameters used for equation (3.5). The five experiments are named by the location of the oil–water interface Loil. The fitting quality is evaluated by the root mean square (RMS) of the difference between the fitted curve and measured values, normalized by the final tubule length, Lend.
| Loil (µm) | 24 | 65 | 70 | 85 | 140 |
| tend (s) | 18.75 | 9.26 | 9.3 | 3.27 | 0.99 |
| a (µm) | 358 | 361 | 363 | 356 | 335 |
| b (–) | 0.197 | 0.220 | 0.193 | 0.201 | 0.120 |
| RMS/Lend | 0.022 | 0.008 | 0.001 | 0.009 | 0.004 |
The boundary condition C(0, t) is calculated by applying a mass balance inside the capsule. We assume that the capsule volume is constant and therefore the flow rate Q0(t) = Q(0, t) that exits the capsule is the same as the water flux that enters the capsule through its wall multiplied by the surface area of its envelope. By assuming perfect mixing inside the capsule, the capsule concentration c(t) is described by
| 3.6 |
where Vc is the capsule constant volume (assuming the capsule is a sphere) and t is time. A solution of equation (3.6) results in an exponential concentration decay and was used as the boundary condition for equation (3.1),
| 3.7 |
Profiles of pγGlu concentration C(x, t) were obtained by numerically solving equation (3.1) for each of the water–oil experiments using measured values of L(t), calculation of Q(x, t) by equations (3.3) and (3.4) and by applying the boundary condition obtained by equation (3.7). As will be shown, the pγGlu concentration profiles were used to calculate the forces that drive the tubule elongation in each of the experiments.
3.1. The numerical simulations
Equation (3.1) was solved numerically by adopting an explicit upwind scheme [18] while stepping backwards along the tubule from its moving front to the capsule. The initial concentration inside the capsule was c0 = 3000 mol m−3, consisting of a 2 M estimated contribution from the pγGlu and a 1 M contribution from the calcium ions [19]. Note that, since equations (3.1) and (3.6) are identical when the concentration C(x, t) is replaced by a non-dimensional concentration C/c0, the model relative behaviour does not change when a different c0 value is chosen. The capsule radius (Rc = 6 µm) and the tubule outer radius (Ro = 1.15 µm) were measured during the experiments but the exact inner radius of the tubule is unknown. The model results were computed by using a fixed value for Ri = 0.15 µm and zero for Jw (§4.3). The sensitivity of the model to both Ri and Jw was tested as reported in §4.4. Finally, the model parameters, tend, a and b, listed in table 1, were used in the simulations of each of the water–oil experiments.
4. Results
The study hypothesis states that, in addition to the wall of the capsule, the tubule wall is also an osmotic membrane, and, depending on the concentration of the aqueous pγGlu solution inside the tubule, the tubule has the ability to generate an osmotic potential. The following comparisons between the water–water experiments and the water–oil experiments, and the effect of the water–oil interface location, are aimed at testing the study hypothesis.
4.1. Water–water experiments
To find the time needed for full tubule release, we initially tested the system in water–water conditions (figure 3). The capsule and the released tubules were surrounded by water and the length of the tubule as a function of time was measured. The results show that the tubule elongation is completed after approximately 50 ms, that the elongation dynamics follows a sigmoid-like behaviour, and that its maximum propagation speed (approx. 12 m s−1) occurs at around half the total time (figure 3a). The low initial tubule elongation speed was also reported by Holstein & Tardent [11, fig. 3], which showed that, immediately after the ultra-fast stage, the tubule halts for about 0.15 ms, before moving forward again. To test the possibility that friction between the tubule and the micro-channel walls may reduce the elongation speed, we compared results that were obtained in an unconstrained water droplet with the results obtained in the microfluidic device. Figure 3a shows that both experiments generate similar results, indicating that potential friction does not play a significant role and that the microfluidic device can be used to test the role of the osmotic potential along the tubule.
Figure 3.
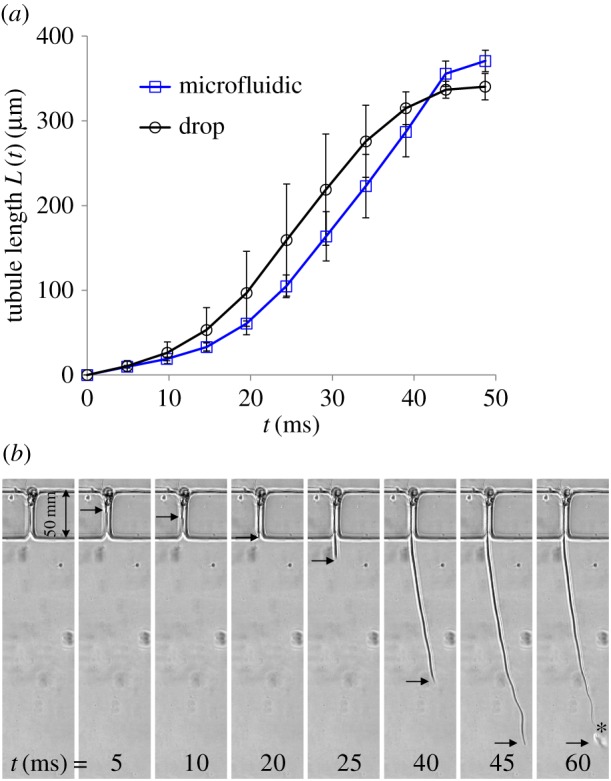
(a) Measurements of tubule elongation as a function of time in the water–water experiments, comparing the results obtained in the microfluidic device with results obtained in an unconstrained water drop. Data are presented as the mean ± s.d., n = 5. (b) A sequence of images taken every 5 ms showing the elongation of the tubule in one of the water–water experiments. Elongation time is shown at the bottom. Black arrows indicate the location of the tubule moving front. Injected liquid appears as a bubble near the moving front on the last image (t = 60 ms), marked by an asterisk. The last image also shows that, following the release of the liquid, the tubule length is reduced.
4.2. Water–oil experiments
The water–oil experiments test the hypothesis that the osmotic potential along the tubule plays a crucial role in its elongation. To this end, the capsule was kept in water, whereas the tubule was released into an oil environment. While the conditions around the capsule were kept exactly the same, oil that was introduced into channel 2 eliminates the development of osmotic potential in increasing sections along the tubule. If the capsule was solely responsible for generating the osmotic potential and the tubule elongation driving force, the elongation rate in all the water–oil experiments would have been the same and equal to that of the water–water experiments. Our findings show that tubule elongation through oil is orders of magnitude slower than that through water. The elongation of the tubule in the Loil = 24 µm experiment took 27.4 s until it was fully released (see electronic supplementary material, video, and figure 4). The video clip consists of six panels: the left panel presents one of the water–water experiments while the other five panels demonstrate the water–oil experiments of varying length, Loil. The distance, Loil, between the water–oil interface (marked by a yellow line in the video) and the capsule body (marked with a white dashed circle) is shown above each of the panels. The running time (s) appears in black below each of the panels and turns red when the moving front reaches its final length. Note that, while the values of tend listed in table 1 were defined as the time needed for the tubule to reach a fixed length, the clock in the video runs until the tubule is fully released. In addition to the elongation dynamics, the video shows that liquid bubbles are released through the far end of the tubule and along its side openings, a phenomenon that was described as a multiheaded poisonous arrow [14].
Figure 4.
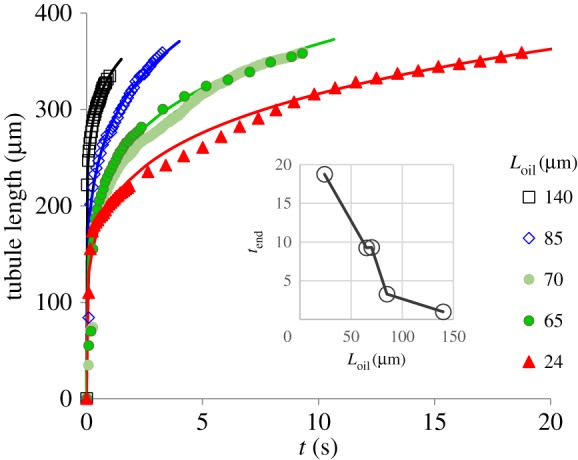
The tubule length as a function of time in the water–oil experiments. Each of the five experiments was conducted for a different Loil (see table 1; electronic supplementary material, video). Symbols represent measured data and lines were plotted by equation (3.5) and the data in table 1. The inset shows tend of the five experiments.
The comparison between the water–water experiments (figure 3) and the water–oil experiments (figure 4) is striking. In addition to the three orders of magnitude difference in the elongation time, the results also show that the temporal elongation changes from a sigmoid-like shape (figure 3) in the water–water experiment to a power law (equation (3.5)) in the water–oil experiments (figure 4). As was demonstrated in the video clip, figure 4 shows that, as Loil increases, the time needed to reach a full extension decreases. Since the conditions surrounding the capsule were the same in all the experiments, this observation indicates that the tubule plays an active role in driving the release process. Viscous forces and the effect of oil viscosity alone cannot explain the results since no relative motion takes place between the tubule outer wall and the ambient oil (for more details see appendix A). At the end of the tubule elongation stage, measurements of the rate of liquid release from the tubule tip and the accumulation of the liquid bubbles provided additional evidence that osmotic potential is developing along the tubule (figure 5). If the tubule wall did not act as an osmotic membrane and no osmotic potential had been developed, then the increase rate of the bubble volume would have been constant in all the experiments. However, as shown in figure 5, the volume of the liquid bubble grows faster when Loil is longer (the tubule is relatively more exposed to water). Since the only difference in these experiments was the length of the tubule section that was immersed in water, these results provide another indication that the tubule wall acts as an osmotic membrane. These observations suggest a new mechanism for the tubule elongation. Upon the initiation of the tubule eversion, the high pγGlu concentration is transported from the capsule into the emerging tubule. Over time, the concentration of pγGlu in the capsule decreases as the length of the tubule increases, diminishing the pγGlu concentration at the entrance to the tubule. This mass transfer process results in a non-uniform concentration distribution along the tubule, maintaining its highest concentration at the moving front with a decreasing concentration profile towards the capsule.
Figure 5.
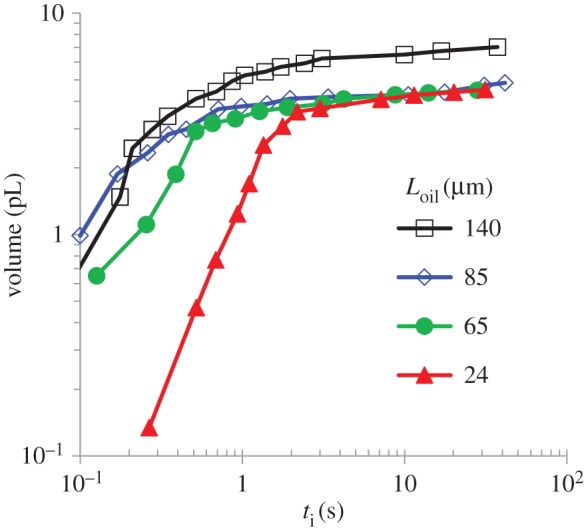
The time evolution of the liquid volume, injected from the tubule far end in the water–oil experiments. The measured time starts after the tubule elongation is completed.
4.3. The mathematical model
The model computes the processes that cannot be measured inside the nematocyst. These include the longitudinal and temporal variations in flow rate and concentration inside the elongating tubule, the distribution of internal pressure and the resulting driving force. Using the measured length and internal geometry of the tubule, the model computes the flow rate that exits the capsule and enters the tubule, Q0(t). Assuming fully mixed conditions inside the capsule, the solution of equation (3.6) results in an exponential decay of the capsule pγGlu concentration (equation (3.7)) that is required as a boundary condition for the mass conservation equation, equation (3.1). Equation (3.7) starts with the initial concentration, c0, and decreases at a rate that depends on the flow rate through the capsule wall, Q0(t). The flow rate along the tubule, Q(x, t), is calculated using equations (3.3) and (3.4). The time-dependent concentrations at the water–oil interface, C(Loil, t), are obtained by numerically solving equation (3.1). The force that drives the tubule elongation was calculated by identifying the relevant pγGlu concentration. When the moving front of the tubule is in water, the driving concentration (Cdrive) is at the moving tubule front such that Cdrive = C(L, t). Once the front crosses the water–oil interface (x = Loil) the driving concentration is calculated at the interface, Cdrive = C(Loil, t), assuming that the maximal osmotic pressure exists along the entire length of the tubule that is immersed within the oil phase.
The flow rate of Loil = 65 µm, calculated by equations (3.3) and (3.4), at five different times ti is presented in figure 6. It shows that the flow rate is decreasing with time and is uniform along the tubule except for a step decrease that occurs due to the sudden change in the cross-sectional area at the trailing end of the tubule. This sudden change is missing in the t1/tend = 0.025 case as the tubule end is still inside the capsule. Starting with t2/tend = 0.05, all the cases display the sudden change as the trailing end is inside the tubule. Figure 6 also shows that the location of the water–oil interface does not affect the flow rate since Jw was assumed to be zero in these simulations.
Figure 6.
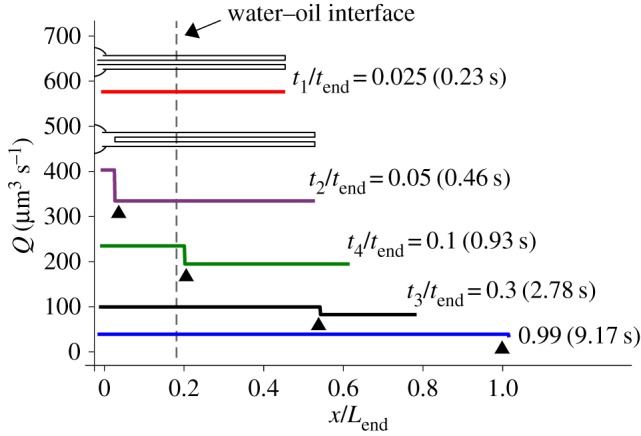
The flow rate, Q, of the pγGlu solution, along the normalized tubule length (x/Lend) at five different times during tubule eversion as computed by equations (3.3) and (3.4) for the 65 µm experiment. tend is the total release time, Ri = 0.15 μm and Jw = 0. Schematics show the length of the folded part of the tubule in the first two instants. Arrowheads indicate the location of the tubule trailing end where the cross-sectional area changes from an annulus to a full circle. Note that, for t/tend = 0.025, the rear part of the tubule is still in the capsule and no step is shown.
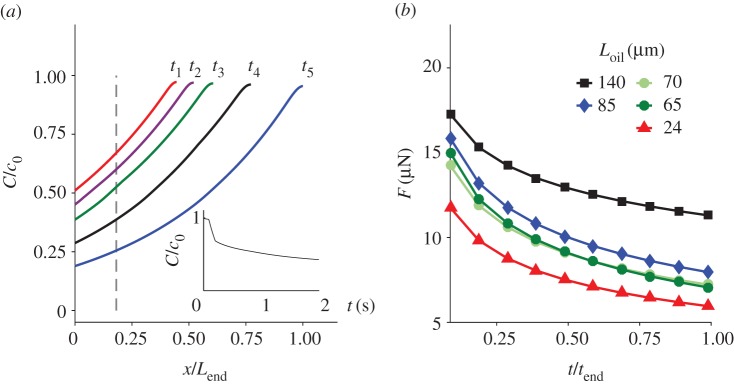
As opposed to the longitudinal uniformity in flow rate, figure 7a shows that the pγGlu concentration is increasing along the tubule, reaching a maximum at its moving front. The reason for this is the exponential concentration decrease at x = 0 (see the left end of the concentration profiles) and the advection caused by Q(x, t). At t = 0, the pγGlu concentration in the capsule is the highest (c0). As time evolves, the concentration of pγGlu in the capsule, c(t), is decreasing and lower values enter the tubule while pushing the pγGlu solution forward. From the concentration profiles that are shown in figure 7a, we have a special interest in the temporal behaviour of the concentration at the water–oil interface, C(Loil, t). Loil is the last location where osmotic potential can develop and where the tubule elongation driving force is determined. An example of the concentration decrease at x = Loil is shown in the inset. The temporal change of this concentration is similar to the temporal change of driving forces shown in figure 7b.
Figure 7.
(a) Normalized pγGlu concentration, C/c0, under the same experimental conditions as in figure 6. The inset shows the temporal evolution of the concentration at the water–oil interface, Cdrive/c0. (b) The driving force of the tubule elongation, calculated using equation (4.4) for all five experiments, given Ri = 0.15 µm and Jw = 0.
The force that drives the tubule elongation is a product of the concentration-dependent pressure Pdrive and the annular cross-sectional area at the moving front, A1,
| 4.1 |
The driving pressure Pdrive is estimated by a formulation commonly used when modelling the flow of a permeate in osmotic membrane systems [20],
| 4.2 |
where α is a water permeability membrane coefficient, ΔP is the difference in internal pressure ( ) and Δπ is the osmotic potential across the tubule wall (
 ), where the subscripts i and a are inner and ambient, respectively. Note that Jw is positive against the radial direction, i.e. positive from outside in. When ΔP = Δπ, no water crosses the wall (Jw = 0) and the internal pressure increases to its highest potential value. For a given Jw/α, the pressure Pi can be calculated by a combination of equation (4.2) and the Morse equation,
| 4.3 |
which is valid for dilute solutions. T is temperature (taken here as 293 K), R is the gas constant and i is the van't Hoff factor, taken as unity. Using equations (4.1)–(4.3) and setting Pa and πa to zero, the tubule elongation force is
| 4.4 |
where Cdrive depends on the experimental conditions (e.g. the location of Loil). Figure 7 shows that the location of the oil interface determines the pγGlu concentration that drives the tubule. For longer Loil lengths, the greater the driving force and the eversion speed are. When no oil interface exists, the driving force depends on the concentration at the far end of the tubule. Assuming no diffusion and no dilution with water (Jw = 0), the concentration at the moving front (figure 7a) and the driving force in the water–water case is constant.
Note that the inner folded tubule section moves at twice the speed of the tubule front and, as a result, these forces are double what would have been needed if the tubule had not been everted inside out. This is analogous to pulley lift systems that apply only half the object weight, compensated by the double distance of the system chain. In order to generate such large forces, a high concentration and large osmotic potential must be developed at the tubule front.
4.4. Sensitivity analysis
Except for the inner tubule diameter (Ri) and the water flux across the tubule wall (Jw) all the other model parameters were either measured or reported in the literature (e.g. [21]). The model results shown so far (figures 6 and 7) assumed a radius ratio Ri/Ro = 0.13 and Jw = 0. In the following, we test the sensitivity of the model to a range of Ri and Jw values.
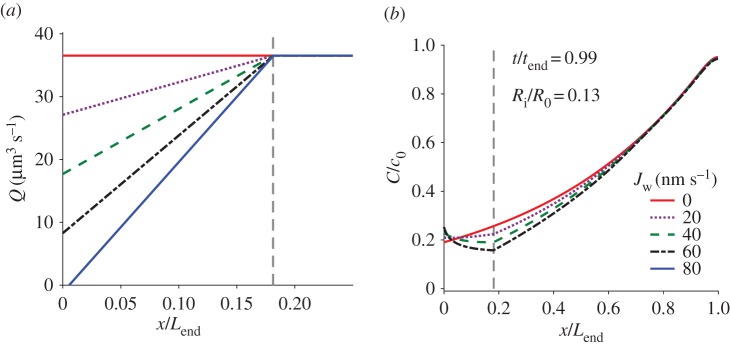
The influence of Jw on the flow rate and the distribution of pγGlu for the Loil = 65 µm experiment are shown in figure 8. These results were obtained for a radius ratio of 0.13 and are shown for t/tend = 0.99, towards the end of the elongation process. Since Jw was assumed constant along the tubule, the flow rate varies linearly with x and is constant when the osmotic potential and Jw are zero in the oil. It was found that, for these conditions, a water flux Jw greater than 77 nm s−1 generates a negative flow, namely from the tubule to the capsule. We chose to limit the analysis to positive flow rates; however, we present in figure 8a the flow rate for Jw = 80 nm s−1 where it is positive everywhere except for a small section near the capsule (note that a negative flow will generate an increasing (or constant) pγGlu concentration inside the capsule, a result that the model did not address).
Figure 8.
The effect of Jw on (a) the flow rate and (b) the pγGlu concentration, computed for the Loil = 65 µm experiment. The vertical dashed line marks the water–oil interface.
Figure 8a shows that non-zero Jw reduces the flow rate at the capsule exit and hence slows down the dilution of the capsule pγGlu concentration. Figure 8b shows that Jw has a minor influence on the relative capsule concentration. It slightly increases the relative concentration in the capsule and decreases the concentration along the tubule. The cumulative effect of Jw appears along the water section (0 < x < Loil) but stops when the tubule is immersed in oil (x > Loil), where the curves converge. A prediction of the pγGlu concentration in the water-only case, especially at the moving front, is important since it defines the elongation driving force. This concentration profile depends on Jw, which in turn is a function of both the concentration and the internal pressure (see equation (4.2)).
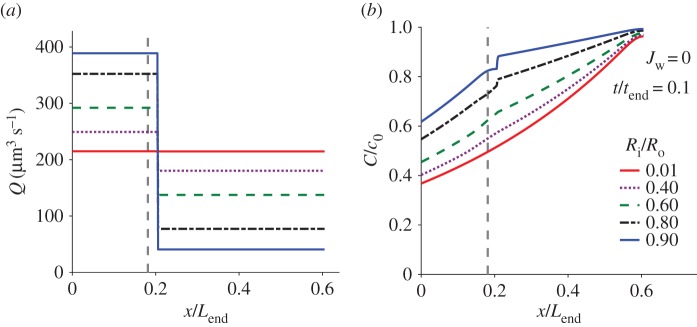
The role of the radius ratio Ri/Ro was tested by changing the inner radius while keeping the outer radius fixed at Ro = 1.15 µm. This sensitivity test is important due to the ambiguity of the tubule inner diameter measurements. Figure 9 shows the computed distributions of flow rate and concentration, a short time after the moving front crosses the water–oil interface (t/tend = 0.1, Loil = 65 µm, Jw = 0). The flow rate through the unfolded tubule (0 < x < L2) is larger than the flow rate through the folded part (x > L2). The effect of the different cross sections (figure 2) on the solution of the flow rate (equations (3.3) and (3.4)) also influences the concentration inside the capsule, c(t), and hence the concentration along the tubule, C(x, t). Figure 9b shows that high Ri/Ro ratios result in higher concentrations at both the capsule exit and along the tubule. The concentration jump at x = L2 is due to the change in flow rate. Tardent [4, fig. 2f] suggests that the radius ratio is smaller than 0.4. The sensitivity analysis presented in figure 9b indicates that the concentration profile is not very sensitive and that the concentration jump is negligible when the radius ratio is within this range.
Figure 9.
The effect of the radius ratio Ri/Ro on (a) the flow rate and (b) the pγGlu concentration for the Loil = 65 µm experiment. The vertical dashed line marks the water–oil interface.
5. Summary
Our new mechanistic explanation suggests that the elongation driving force is equal to the product of the concentration-dependent pressure and the annular cross-sectional area at the tubule moving front. Once it crosses the water–oil interface, it loses its ability to pull the tubule since no osmotic potential can be developed in oil. Therefore, the location of the interface determines the pγGlu concentration that drives the tubule, and the longer the Loil length the greater the driving force and the eversion speed. The elongation rate obtained for Loil = 24 µm represents a scenario where the capsule is almost the only part that is immersed in water. If the previous models were correct, the results should have been the same as in the water–water experiments. The orders of magnitude difference in elongation time of the different experiments emphasizes the importance of the role of the tubule wall. While the previous paradigm suggested that the capsule acts as a pump that pushes the tubule forward, our results show that the moving front acts like a locomotive that pulls the tubule behind it. This implies that the ambient regions that affect the ejection process are not limited to the environment surrounding the capsule, but rather are shared by the inner target domain where the tubule moves while elongating. Therefore, modifications of the immediate environment along the tubule route have the potential to slow down the process, reduce its dramatic impact and assist in applications such as protection against jellyfish stinging. These new findings facilitate our understanding of potential prey defence strategies (such as the release of mucus or high osmotic solutions), but may also facilitate the development of osmosis-based methods for nanotube production and drug delivery [22–24].
Acknowledgements
We thank Vera Brekhman for her laboratory assistance and Eyal Bahar for his unique contribution to the model development. We note that authors Sinwook Park, Gadi Piriatinskiy and Dan Zeevi contributed equally to this work.
Appendix A. The role of oil viscosity
In this appendix, we investigate the potential role of the oil viscosity. As will be shown, it cannot explain the slowing down observed in the water–oil experiments when compared with the water-only experiments. The main mechanism through which viscosity could impose a resisting force is a shear stress that hypothetically develops along the tubule external walls. Since the tubule is released by an inside-out eversion, the tubule wall of the already unfolded part does not move with respect to the ambient fluid (assuming zero motion of the nematocyst as a whole). Figure 10 illustrates the inside-out eversion and shows how the tubule lays its outer wall in the ambient fluid. As an analogy this is similar to the action of a vehicle with caterpillar treads when it moves forward and lays its tracks on the ground; however, as opposed to the vehicle with caterpillar treads that uses friction with the ground to move forward, the elongation driving force in the nematocyst is internal. As a result, no shear stress is generated and viscosity has no role to play. The only location where viscosity might have an influence is at the moving tubule tip. Although the rolling out of the tip might generate a small vortex ring, we chose, for simplicity, to approximate the influence of viscosity at the tubule tip by using Stokes' law,  ,
,  . Using table 1, we estimate the viscous force that resists the tubule tip as
  when the viscosity is that of water (μ = 0.001 kg m−1 s−1). The estimated
  is orders of magnitude smaller than the force shown in figure 7b. Since the dynamic viscosity (μ) of the oil (light mineral oil; Sigma-Aldrich-330779) was only approximately 13 times higher than that of water,
  cannot explain the orders of magnitude reduction in elongation speed.
Figure 10.
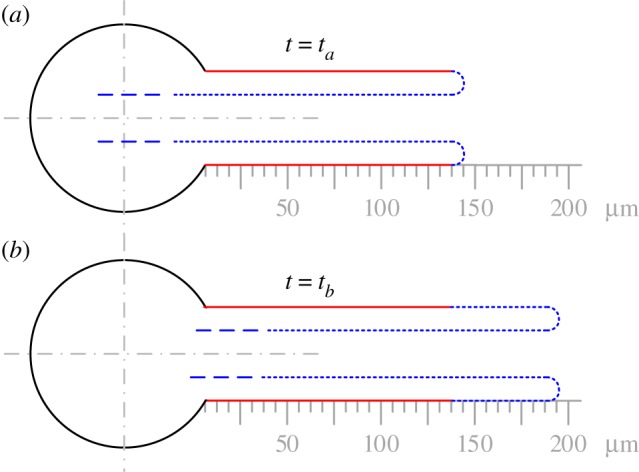
A schematic of the inside-out eversion: (a) and (b) represent the tubule at two times, ta and tb, where the red line marks the tubule elongated length at t = ta.
Finally, in order to demonstrate the negligible role of viscosity, we tested the tubule elongation rate while using a low-viscosity oil (Fluorinert FC-40; Sigma-Aldrich; ν = 2.2 cSt, μ = 3.34 cP). Since the experiment involved a new batch of nematocysts, we tested again the elongation rate with the light mineral oil (ν = 15.6 cSt, μ = 13 cP). Table 2 shows that the time needed to complete the elongation (tend) is approximately the same regardless of the viscosity of the oil. Regardless of the type of the ambient oil, the values of tend in table 2 (4.5–5.5 s) are bounded between the tend in the Loil = 70 µm experiment (9.3 s) and the tend in the Loil = 85 µm experiment (3.27 s) as reported in table 1. We, therefore, conclude that the ambient fluid viscosity cannot explain the large reduction in the tubule elongation rate that we found in this study.
Table 2.
The results of a viscosity test. The values of Loil and tend are shown for experiments that use Fluorinert FC-40 (μ = 3.34 cP) instead of mineral oil (μ = 13 cP).
| Fluorinert FC-40 |
mineral oil | ||
|---|---|---|---|
| Loil (µm) | 72.6 | 76.3 | 82.6 |
| tend (s) | 5.5 | 5.4 | 4.5 |
Competing interests
We declare we have no competing interests.
Funding
This research was supported by grant no. IS-4576-13 from BARD, the United States–Israel Binational Agricultural Research and Development Fund. J.B.-D. was supported by the Helmsley Charitable Trust.
References
- 1.Engel U, Pertz O, Fauser C, Engel J, David CN, Holstein TW. 2001. A switch in disulfide linkage during minicollagen assembly in Hydra nematocysts. EMBO J. 20, 3063–3073. ( 10.1093/emboj/20.12.3063) [DOI] [PMC free article] [PubMed] [Google Scholar]
- 2.Beckmann A, Özbeck S. 2012. The nematocyst: a molecular map of the cnidarian stinging organelle. Int. J. Dev. Biol. 56, 577–582. ( 10.1387/ijdb.113472ab) [DOI] [PubMed] [Google Scholar]
- 3.Rachamim T, Morgenstern D, Aharonovich D, Brekhman V, Lotan T, Sher D. 2015. The dynamically evolving nematocyst content of an Anthozoan, a Scyphozoan, and a Hydrozoan. Mol. Biol. Evol. 32, 740–753. ( 10.1093/molbev/msu335) [DOI] [PubMed] [Google Scholar]
- 4.Tardent P. 1995. The cnidarian cnidocyte, a hightech cellular weaponry. Bioessays 17, 351–362. ( 10.1002/bies.950170411) [DOI] [Google Scholar]
- 5.Ayalon A, Shichor I, Tal Y, Lotan T. 2011. Immediate topical drug delivery by natural submicron injectors. Int. J. Pharm. 419, 147–153. ( 10.1016/j.ijpharm.2011.07.042) [DOI] [PubMed] [Google Scholar]
- 6.Holstein TW, Benoit M, Herder GV, Wanner G, David CN, Gaub HE. 1994. Fibrous mini-collagens in Hydra nematocysts. Science 265, 402–404. ( 10.1126/science.265.5170.402) [DOI] [PubMed] [Google Scholar]
- 7.Beckmann A, et al. 2015. A fast recoiling silk-like elastomer facilitates nanosecond nematocyst discharge. BMC Biol. 13, 3 ( 10.1186/s12915-014-0113-1) [DOI] [PMC free article] [PubMed] [Google Scholar]
- 8.Weber J. 1990. Poly(gamma-glutamic acid)s are the major constituents of nematocysts in Hydra (Hydrozoa, Cnidaria). J. Biol. Chem. 265, 9664–9669. [PubMed] [Google Scholar]
- 9.Szczepanek S, Cikala M, David CN. 2002. Poly-g-glutamate synthesis during formation of nematocyst capsules in Hydra. J. Cell Sci. 115, 745–751. [DOI] [PubMed] [Google Scholar]
- 10.Ozbek S, Balasubramanian PG, Holstein TW. 2009. Cnidocyst structure and the biomechanics of discharge. Toxicon 54, 1038–1045. ( 10.1016/j.toxicon.2009.03.006) [DOI] [PubMed] [Google Scholar]
- 11.Holstein T, Tardent P. 1984. An ultrahigh-speed analysis of exocytosis: nematocyst discharge. Science 223, 830–833. ( 10.1126/science.6695186) [DOI] [PubMed] [Google Scholar]
- 12.Nüchter T, Benoit M, Engel U, Ozbek S, Holstein TW. 2006. Nanosecond-scale kinetics of nematocyst discharge. Curr. Biol. 16, R316–R318. ( 10.1016/j.cub.2006.03.089) [DOI] [PubMed] [Google Scholar]
- 13.Berking S, Herrmann K. 2006. Formation and discharge of nematocysts is controlled by a proton gradient across the cyst membrane. Helgol. Mar. Res. 60, 180–188. ( 10.1007/s10152-005-0019-y) [DOI] [Google Scholar]
- 14.Lotan A, Fishman L, Loya Y, Zlotkin E. 1995. Delivery of a nematocyst toxin. Nature 375, 456 ( 10.1038/375456a0) [DOI] [PubMed] [Google Scholar]
- 15.Anderson JR, Chiu DT, Jackman RJ, Cherniavskaya O, McDonald JC, Wu H, Whitesides SH, Whitesides GM. 2000. Fabrication of topologically complex three-dimensional microfluidic systems in PDMS by rapid prototyping. AnaCh 72, 3158–3164. ( 10.1021/ac9912294) [DOI] [PubMed] [Google Scholar]
- 16.Bithi SS, Vanapalli SA. 2010. Behavior of a train of droplets in a fluidic network with hydrodynamic traps. Biomicrofluidics 4, 044110 ( 10.1063/1.3523053) [DOI] [PMC free article] [PubMed] [Google Scholar]
- 17.Arakawa T, Noguchi M, Sumitomo K, Yamaguchi Y, Shoji S. 2011. High-throughput single-cell manipulation system for a large number of target cells. Biomicrofluidics 5, 014114 ( 10.1063/1.3567101) [DOI] [PMC free article] [PubMed] [Google Scholar]
- 18.LeVeque RJ. 2007. Finite difference methods for ordinary and partial differential equations: steady-state and time-dependent problems, vol. 98 Philadelphia, PA: SIAM. [Google Scholar]
- 19.Weber J. 1989. Nematocysts (stinging capsules of Cnidaria) as Donnan-potential-dominated osmotic systems. Eur. J. Biochem. 184, 465–476. ( 10.1111/j.1432-1033.1989.tb15039.x) [DOI] [PubMed] [Google Scholar]
- 20.Seader J, Henley EJ, Roper DK. 2011. Separation process principles: chemical and biochemical operations. Hoboken, NJ: John Wiley and Sons, Inc. [Google Scholar]
- 21.Lotan A, Fishman L, Zlotkin E. 1996. Toxin compartmentation and delivery in the Cnidaria: the nematocyst's tubule as a multiheaded poisonous brow. J. Exp. Zool. 275, 444–451. ( 10.1002/(SICI)1097-010X(19960815)275:6%3C444::AID-JEZ6%3E3.0.CO;2-O) [DOI] [PubMed] [Google Scholar]
- 22.Shaoul E, Ayalon A, Tal Y, Lotan T. 2012. Transdermal delivery of scopolamine by natural submicron injectors: in-vivo study in pig. PLoS ONE 7, e31922 ( 10.1371/journal.pone.0031922) [DOI] [PMC free article] [PubMed] [Google Scholar]
- 23.Rangamani P, Zhang D, Oster G, Shen AQ. 2013. Lipid tubule growth by osmotic pressure. J. R. Soc. Interface 10, 20130637 ( 10.1098/rsif.2013.0637) [DOI] [PMC free article] [PubMed] [Google Scholar]
- 24.Tal Y, Ayalon A, Sharaev A, Kazir Z, Brekhman V, Lotan T. 2014. Continuous drug release by sea anemone Nematostella vectensis stinging microcapsules. Mar. Drugs 12, 734–745. ( 10.3390/md12020734) [DOI] [PMC free article] [PubMed] [Google Scholar]


