Abstract
High failure rates of femoropopliteal artery (FPA) interventions are often attributed to severe mechanical deformations that occur with limb movement. Torsion of the FPA likely plays a significant role, but is poorly characterized and the associated intramural stresses are currently unknown. FPA torsion in the walking, sitting and gardening postures was characterized in n = 28 in situ FPAs using intra-arterial markers. Principal mechanical stresses and strains were quantified in the superficial femoral artery (SFA), adductor hiatus segment (AH) and the popliteal artery (PA) using analytical modelling. The FPA experienced significant torsion during limb flexion that was most severe in the gardening posture. The associated mechanical stresses were non-uniformly distributed along the length of the artery, increasing distally and achieving maximum values in the PA. Maximum twist in the SFA ranged 10–13° cm−1, at the AH 8–16° cm−1, and in the PA 14–26° cm−1 in the walking, sitting and gardening postures. Maximum principal stresses were 30–35 kPa in the SFA, 27–37 kPa at the AH and 39–43 kPa in the PA. Understanding torsional deformations and intramural stresses in the FPA can assist with device selection for peripheral arterial disease interventions and may help guide the development of devices with improved characteristics.
Keywords: femoropopliteal artery, peripheral artery disease, intra-arterial markers, torsion, mechanical stress
1. Introduction
Peripheral artery disease (PAD) primarily refers to atherosclerotic obstruction of the femoropopliteal artery (FPA) that reduces blood flow to the lower limbs. PAD is a major contributor to the public health burden and is associated with high morbidity, mortality and impairment in quality of life [1]. The FPA begins as the common femoral artery as it crosses posterior to the inguinal ligament, and continues as the superficial femoral artery (SFA) into the upper thigh. It becomes the popliteal artery (PA) as it traverses the adductor hiatus (AH), a thick tendinous channel between the adductor magnus muscle and the femur, passing from the anterior thigh posteriorly into the popliteal fossa behind the knee. The PA ends below the knee joint at the lower border of the popliteus muscle, where it divides into two branches, the anterior tibial artery and the tibioperoneal trunk. Clinically, the two principal sites of femoropopliteal occlusions are the distal SFA at the AH and the PA below the knee [2].
The total annual cost of hospitalizations for patients with PAD is in excess of $21 billion per year, and per-patient costs of PAD are higher than those for both coronary artery disease and cerebrovascular disease [3]. The high cost of PAD is mostly attributed to high numbers of peripheral vascular operations and interventions that fail, resulting in poor clinical outcomes and a frequent need for repetitive interventions [4–7]. Specifically, restenosis within 3 years after FPA bypass occurs in 27% of patients [8], and results of angioplasty and stenting in the lower extremity are even worse, with more than 45% of patients developing haemodynamically significant restenosis within just 2 years after treatment, leading to re-intervention in 37–54% of patients [7].
Though systemic risk factors for restenosis are the same for carotid, renal, iliac and FPA reconstructions, FPA interventions fail significantly more often than those in other locations. This suggests that local factors unique to the SFA and PA strongly influence reconstruction failure. A major difference between the FPA and other arterial segments are the large deformations experienced by the SFA and PA during flexion of the limbs. These deformations are particularly important for the design of FPA stents, as the inability of certain stent designs to accommodate these severe deformations during locomotion may result in arterial wall injury, poor device apposition and even fracture of the stent [9]. All these can lead to deleterious cellular and biochemical responses, culminating in restenosis and reconstruction failure [2,10–14].
Many different stents are approved for use in the FPA, but guidance provided by the Food and Drug Administration to stent manufacturers does not specify the loading conditions these stents should withstand. Instead, they recommend testing FPA stents under ‘physiologic loading conditions’ [15]. The specifications for these conditions are an open discussion as recent evidence suggests that previously measured values may be significantly less severe than the actual deformations experienced by the FPA [14].
Previously characterized modes of FPA deformation include radial and longitudinal compression, bending and torsion [14,16]. A recent study [9] summarized the historical values of these deformations, data largely based on the analysis of in vivo three-dimensional measurements with magnetic resonance imaging (MRI) [17,18] and angiography with three-dimensional modelling [19]. The three-dimensional nature of MRI allows accurate assessment of arterial bending with limb flexion, and use of large side branches allows quantification of torsion. While MRI has a clear advantage of being applicable to live patients, the FPA rarely has enough side branches or other identifiable features along its length large enough to be visualized with clinical MR. As a result, previous studies reported values primarily representing the average deformations that occur over relatively long arterial segments. In addition, side branches may anchor the artery to the surrounding tissues [14], also potentially affecting deformation measurements. These limitations may lead to significant underestimation of torsion, providing inaccurate testing conditions for device manufacturers as was recently demonstrated in a pilot study using intra-arterial markers [14]. The goal of this study was to improve and validate the intra-arterial marker measurement method for assessment of torsion, expand the sample size and determine the associated mechanical stresses occurring in the FPA as a result of limb flexion-induced torsion.
2. Material and methods
2.1. Measurement of torsion using intra-arterial markers
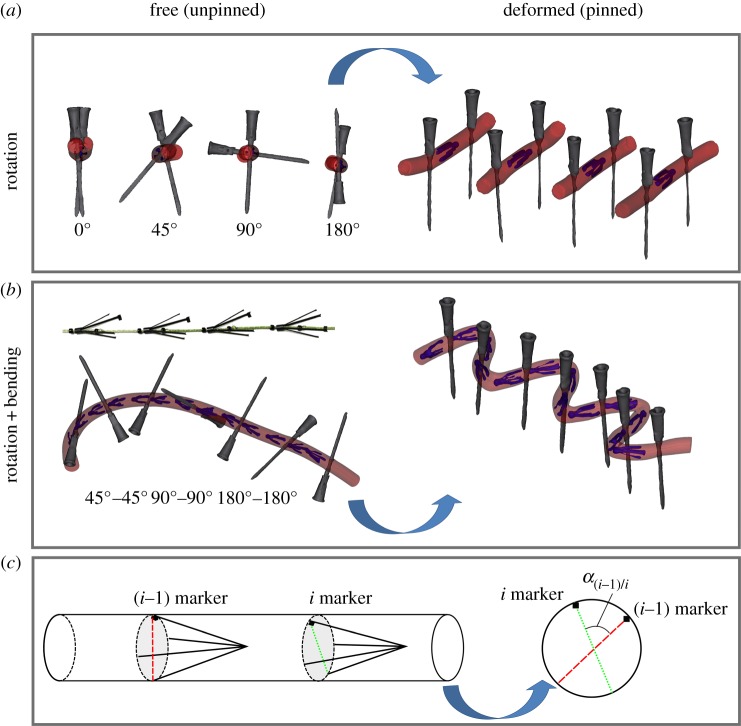
Custom-made four-pronged intra-arterial markers were laser cut from nitinol. One of the four prongs was made thicker at the end to allow tracking of marker spatial orientation on imaging. Markers were loaded into an 8-French plastic sheath and deployed into four silicone tubes twisted to 0°, 45°, 90° and 180°. The rotation was imposed by using hypodermic needles that penetrated the tube and fixed it to the Styrofoam board. Computed tomography (CT) images (GE Light Speed VCTXT scanner GE Healthcare, Waukesha, USA) of the unpinned and pinned tubes (figure 1a) were then acquired with 0.625 mm axial resolution. Three-dimensional reconstructions were obtained using Mimics (Materialize Co., Leuven, Belgium) software. A line connecting two opposing marker legs was obtained using two-dimensional cross-sectional views (figure 1c). Superimposition of this line and the lines representing hypodermic needles in the unpinned and pinned configurations allowed calculation of the angle of twist for each marker. These values were compared with the prescribed rotations imposed by the needles for each tube.
Figure 1.
(a) Three-dimensional reconstruction of a silicone tube in the free (unpinned, left) and deformed (pinned, right) configurations twisted to 0°, 45°, 90° and 180° using hypodermic needles. (b) Intra-arterial markers on a string separated by glass beads and assessment of torsion in a silicone tube bent and twisted to 45°, −45°, 90°, −90°, 180° and −180°. (c) Schematic of angle measurement using two consecutive markers. (Online version in colour.)
Since the FPA often experiences simultaneous torsional and bending deformations, the effects of combined twist and bending were studied using 13 markers in a silicon tube. The markers were placed on a string separated by fixed glass beads placed 2 cm apart to allow free axial movement of each marker. The string with markers was loaded into an 8-French sheath, and markers were deployed into a silicone tube that was then twisted to 45°, −45°, 90°, −90°, 180°, −180° assuming positive anti-clockwise rotation. Alternating twist angles ensured that the tube returned back to zero twist. Next, the tube was bent to various degrees of bending and pinned to the styrofoam board using hypodermic needles. CTA images of the tube in the free (unpinned) and deformed (pinned) configurations (figure 1b) were acquired, and three-dimensional reconstructions were used to create the tube centreline. Images orthogonal to this centreline were used to connect the ends of each marker using a line tool, and superimposition of these lines for each pair of consecutive markers in both unpinned and pinned configurations allowed calculation of the angle of twist for each tube segment (figure 1c).
2.2. Human cadaver model
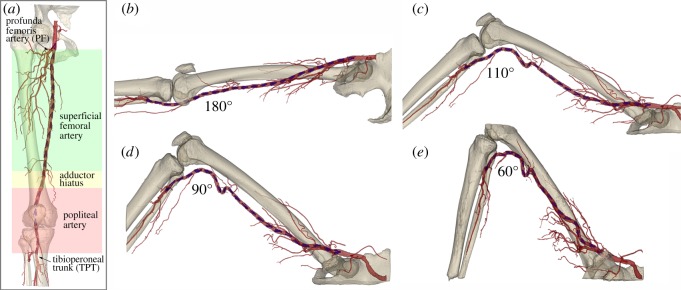
After validating the measurement method, intra-arterial markers were used to assess torsion of the FPA in human cadavers. The external iliac artery was exposed through a supra-inguinal retroperitoneal approach. Using fluoroscopic guidance (GE-OEC Medical Systems Series 9800 Cardiovascular mobile digital C-arm system) an 80 cm 8-French sheath (Cook Medical, Bloomington, IN, USA) was inserted from the access site to the tibioperoneal trunk over a 0.035″ diameter guidewire (Boston Scientific, Natick, MA, USA). Markers were then deployed approximately 2 cm apart within the in situ iliac, femoral and popliteal arteries using a plastic sheath. This method of intra-arterial marking maintained the integrity of the anatomical structures surrounding the FPA. The marker deployment procedure was performed in n = 28 legs of 14 lightly embalmed cadavers (eight male, six female, average 80 ± 12 years old, range 49–99 years) that died of causes unrelated to vascular disease. Use of lightly embalmed cadavers as opposed to those that are fully embalmed, allowed better preservation of natural tissue properties [14,20]. Arteries were pressurized (Harvard Apparatus Large Animal pump, Harvard Apparatus, Holliston, MA, USA) to 100 mmHg using a 37C radiopaque custom mixture fluid. The fluid was designed to avoid tissue swelling which can distort anatomical structures, and was made radio opaque to provide uniform opacification of the main arteries and their branches for image analysis. CT images of the limbs in the standing (180°), walking (110°), sitting (90°) and gardening (60°) postures were acquired with 0.625 mm axial resolution (figure 2).
Figure 2.
(a) Schematic of the three arterial segments and main anatomic markers used in this study. (b–e) CTA of the limb flexion states demonstrating (b) standing (180°), (c) walking (110°), (d) sitting (90°) and (e) gardening (60°) postures. Note severe deformations of the femoropopliteal artery at the AH and below the knee. Intra-arterial markers are blue.
2.3. Measurement of limb flexion-induced torsion
Three-dimensional volumetric reconstructions of the leg, artery and markers were performed with Mimics software using a variety of segmentation and region growing techniques [14,21]. Arterial volumes were created and used to construct luminal centrelines, and then images orthogonal to these centrelines were generated, allowing more robust assessments of marker positions in the acutely bent limbs.
Torsion was measured by comparing marker positions for each bent limb configuration to the straight (standing) posture. It was quantified as the angle of twist per unit length γ(i − 1)/i (° cm−1) between each pair of consecutive markers i − 1 and i in the bent ( ) and straight (
 ) limb postures divided by the distance between these markers in the straight posture (Li, centimetres):
 |
2.1 |
Orientation of each marker was identified by the largest and brightest of the four marker legs. A line connecting the opposite ends of each marker was created using the two-dimensional cross-sectional views re-sliced along the arterial centreline. Superimposition of these lines for the (i − 1)th and ith marker allowed calculation of the twist angles α for both straight and bent postures (figure 1c). Anti-clockwise rotation was deemed positive.
Length of each FPA was normalized to account for subject-specific limb lengths. Length of the SFA was normalized to the distance from the profunda femoris artery to the AH, and length of the PA was normalized to the distance from the AH to the tibioperoneal trunk. The AH region was set to occupy the last and first 10% of the SFA and PA lengths, respectively. The largest absolute value of rotation was then assessed within the SFA, AH and PA regions of each limb and results were reported as twist per centimetre (° cm−1) for each limb flexion posture.
2.4. Characterization of the femoropopliteal artery mechanical properties
After imaging, the FPAs were excised for mechanical characterization using planar biaxial extension [22–25] with CellScale Biotester (CellScale, Waterloo, Canada). Square samples 13 × 13 mm were cut from the arterial wall and attached using rake fixtures. Twenty-one stretch-controlled protocols ranging from 1 : 1 to 1 : 0.01 ratios on both axes were executed at 0.01 s−1 strain rate to obtain sufficient data density for constitutive parameter determination. Maximum stretch was selected at the force of 1 N to avoid tissue damage. Thickness of the sample was measured optically prior to mechanical testing.
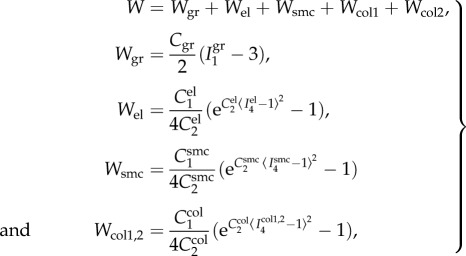
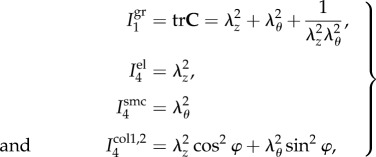
Experimental data were used to determine constitutive parameters for the four-fibre family invariant model. The model assumed incompressibility and was based on the expanded HGO formulation [26] adjusted to FPA histological structure [22,25,27] accounting for the passive elastic contributions of amorphous ground substance (Wgr), longitudinally oriented elastic fibres (Wel), circumferential smooth muscle cells (Wsmc) and two symmetrical families of collagen fibres (Wcol1,2) oriented at an angle ±φ to the longitudinal axis. This model was demonstrated to accurately portray the experimental response of the human FPA [25,28]. The strain energy density function was therefore:
 |
2.2 |
where the corresponding invariants of the right Cauchy–Green tensor C in the case of planar biaxial test are defined (enforcing incompressibility) as
 |
2.3 |
where λθ, λz are principal circumferential and longitudinal stretches, and  are constitutive parameters determined from the experimental data using Levenberg–Marquardt minimization and non-parametric bootstrapping [25,29]. Note the Macaulay brackets 〈(·)〉 = 1/2[(·) + |(·)|] in (2.2) that filter positive values such that fibres only contribute to the strain energy density during tension, but not during compression.
2.5. Mechanical stresses and strains associated with twist
2.5.1. Kinematics of the tube under extension, inflation and torsion
The FPA boundary value problem considered a finite extension, inflation and torsion of an incompressible thick-walled circular tube. Since the cadaver model that was used to measure torsion was lightly embalmed [20], we are not considering residual stresses and assume that the load-free configuration is also stress-free. Inner and outer FPA reference diameters Ri and Ro were measured using histological cross-sectional images for each artery and ranged Ri = 1.4–3.1 mm and Ro = 2.7–5.1 mm. An internal pressure of Pi = 100 mmHg was applied to mimic the in vivo-like conditions.
Consider [30] a material particle located at (R, Θ, Z) in the centre region of the unloaded stress-free intact configuration that is mapped to (r, θ, z) in the central region in a twisted configuration such that:
| 2.4 |
where γ is a uniform twist, and λz is a longitudinal stretch, both defined per unit unloaded length. Note that λz can include both longitudinal pre-stretch and stretch due to limb flexion-induced loading. However, in this study we are focusing on the effects of torsion and therefore assume λz = 1. The physical components of the deformation gradient F in cylindrical coordinates are
 |
2.5 |
After enforcing incompressibility (def F = 1), we obtain λr = (λθλz)−1 as well as the relation between unloaded and loaded radii:
| 2.6 |
where the outer radius of the deformed artery can be expressed as  , and
, and  is the circumferential stretch on the outer (adventitial) boundary that can be determined from the boundary conditions and material parameters. Inner radius and circumferential stretch at any point through thickness can be rewritten using
  as:
as:
 |
2.7 |
2.5.2. Equilibrium equation and boundary conditions
In the absence of body forces, the only non-zero local equilibrium equation in cylindrical coordinates is
| 2.8 |
Applying boundary conditions on the inner surface σrr(ri) = −Pi, and using stress decomposition into volumetric and isochoric parts  (here p is Lagrange multiplier), the radial Cauchy stress can be expressed as:
| 2.9 |
Assuming no pressure on the outer surface (i.e. σrr(ro) = −Po = 0), we can relate transmural pressure P = Pi − Po =Pi to the deformed state of the tube:
| 2.10 |
2.5.3. Constitutive relations
For the incompressible four-fibre family hyperelastic material described by equation (2.2), the Cauchy stress tensor can be expressed as:
| 2.11 |
where B is the left Cauchy–Green deformation tensor, I1 = tr C is a first invariant of the right Cauchy–Green tensor,  is a fourth invariant of C for ith fibre family (equation (2.12)), and mi = FMi is the push forward of fibre direction unit vector Mi to the deformed configuration. Invariants and derivative with respect to
  can be found from
 |
2.12 |
Combining equations (2.11) and (2.12), non-zero Cauchy stress components can be found as:
 |
2.13 |
The stress tensor in equations ((2.11) and (2.13)) is a function of λθ, λz, γ, r, Pi, Po, Ri, Ro and material parameters.
Assuming that λz = 1 (see §2.5.1), there is only one independent variable in equation (2.13), i.e. the circumferential stretch λθ that changes through thickness. At the outer wall  . Rewriting the integration limits ri, ro in equation (2.10) in terms of
  using equation (2.7.1) and relation for ro, and substituting λθ from equation (2.7.2) into the isochoric parts of the Cauchy stresses σrr, σθθ defined by equation (2.13), we can find
  from equation (2.10) numerically using the vpasolve function of MATLAB 2016b (MathWorks, Natick, MA, USA). Once
  is determined, the isochoric part of the Cauchy stress tensor in equation (2.13) is fully defined and radius-dependent Lagrange multiplier can be determined from equations ((2.9) and (2.13)) as:
| 2.14 |
Once the Lagrange multiplier is determined, each of the four unique stress tensor components (σrr, σθθ σzz, σθz) can be easily calculated. Though the presented framework can be used to obtain through thickness distribution of stresses, maximum principal and shear stresses were averaged through thickness of the deformed vessel for the sake of comparison between arterial segments and postures. In order to determine the effect of twist, calculations were first carried out incorporating both pressure and twist, and then with internal pressure only. In addition, the Green strain tensor was calculated as E = 1/2(FTF− I) , and the shear strain due to twist Eθz on the outer surface of the tube was reported.
3. Results
3.1. Accuracy of the twist measurement method
We did not observe any marker sliding along the tube wall during twisting or bending. Assessment of pure rotation using silicone tubes demonstrated an average difference between prescribed and measured torsion of 2.4 ± 1.6° cm−1. When twist was accompanied by bending, the average difference between the prescribed and measured values was 3.9 ± 2.5° cm−1.
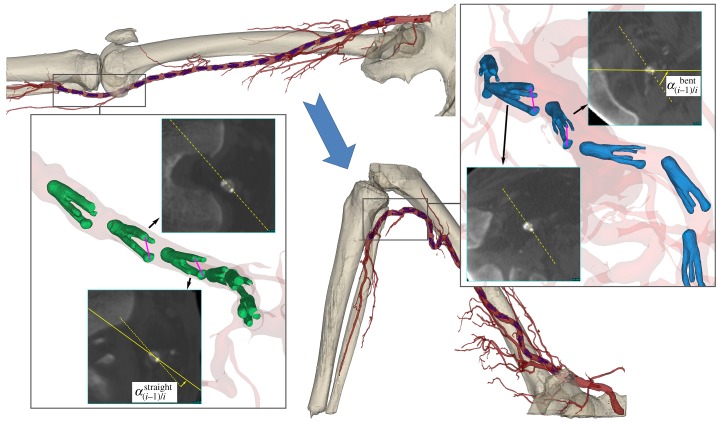
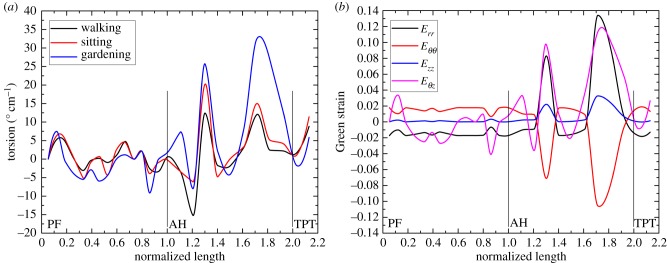
3.2. Limb flexion-induced torsion
Schematic of torsion measurement for the cadaver presented in figure 2 is demonstrated in figure 3. Left panel represents the straight limb posture, while the right panel represents the acutely bent limb posture. Two-dimensional CT images of the markers were obtained perpendicular to the arterial centreline using the reslice function of Mimics. A representative plot of torsion (° cm−1) along the normalized lengths of the SFA and PA is demonstrated in figure 4a for all three limb postures. Torsion gradually increased with increasing limb flexion, and its distribution along the FPA length was highly non-uniform with higher peaks occurring distally in the PA. Intersubject maximum absolute values of torsion for each of the SFA, AH and PA segments for each of the limb flexion states (110°, 90° and 60°) are summarized in figure 5. The central red mark of each box indicated the median, and the bottom and top edges of the box show 25th and 75th percentiles, respectively. Mean values are represented with blue dots inside the box. The whiskers extend to the most extreme data points not considered outliers, and the outliers are plotted using the red plus symbol and are found as q3 + 1.5 · (q3 − q1) < outlier < q1 − 1.5 · (q3 − q1), where q1, q3 are the 25th and 75th percentiles, respectively. Whiskers correspond to approximately ±2.7 s.d. or 99.3% coverage.
Figure 3.
Measurement of limb flexion-induced FPA torsion in a segment of the PA. Left panel represents the straight limb posture, while right panel represents the bent limb posture. Two-dimensional cross-sectional CT images of the markers are obtained along the arterial centreline. Note the change in orientations of the markers relative to each other in both postures.
Figure 4.
(a) A representative distribution of torsion along the normalized lengths of the SFA and PA in the walking (110°), sitting (90°) and gardening (60°) postures. (b) Distribution of Green shear strains along the normalized lengths of the SFA and PA in the gardening (60°) posture. SFA spans from the take off of the profunda femoris artery (PF) to the adductor hiatus (AH) segment. PA starts at the AH and continues to the tibial peroneal trunk (TPT). Note gradually higher torsion with increasing limb flexion and its non-uniform distribution along the length of the FPA. (Online version in colour.)
Figure 5.
Maximum twist in the superficial femoral artery (SFA), adductor hiatus segment (AH) and popliteal artery (PA) in the walking (110°), sitting (90°) and gardening (60°) postures. Box extends to 25th and 75th percentiles, median is marked with a red horizontal line and mean values are marked with a blue dot. (Online version in colour.)
The average largest twists in the SFA, AH and PA in the walking posture were 10.2° cm−1, 7.6° cm−1 and 14.2° cm−1, respectively. Compared with the walking position, average SFA torsion in the sitting and gardening postures increased 16% and 23%, respectively, with highest values occurring 0.6–0.7 of normalized length distal to the profunda femoris artery. Average torsion at the AH increased 28% and 104% in the sitting and gardening postures compared with the walking position, and increase in the PA was 39% and 82%, respectively. The PA experienced the highest torsion in all postures (p < 0.01), with peak values reaching as high as 42.5° cm−1 in the gardening position. Torsion between the SFA and AH was not statistically different in the sitting or gardening postures (p = 0.23, p = 0.09), but in the walking posture the SFA did experience significantly more torsion than at the AH (p = 0.048). Torsion did not correlate with gender or age for either of the FPA segments or postures.
3.3. Characterization of the mechanical properties of the femoropopliteal artery
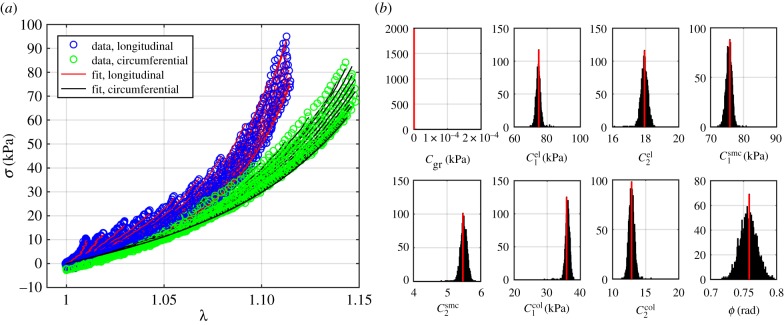
The FPA material parameters are summarized in table 1. Coefficient of determination R2 is included in the table to demonstrate the quality of fit to the experimental data. A representative graph of the experimental data containing multi-ratio stretch protocols and their corresponding constitutive model fit are presented in figure 6a. Results of the non-parametric bootstrapping for the same specimen are demonstrated in figure 6b.
Table 1.
Mechanical properties of the femoropopliteal artery used for analysis.
 |
 |
 |
 |
 |
 |
 |
γ (°) | R2 |
|---|---|---|---|---|---|---|---|---|
| 3.62 × 101 | 26.52 | 28.32 | 313.54 | 0.01 | 38.33 | 48.79 | 43.01 | 0.99 |
| 1.32 × 10⁻⁶ | 483.19 | 259.13 | 94.76 | 14.66 | 89.58 | 144.89 | 34.33 | 0.94 |
| 8.57 × 10⁻¹⁰ | 74.43 | 2.74 | 78.03 | 6.66 | 37.57 | 11.44 | 50.94 | 0.97 |
| 4.50 × 10⁻² | 658.02 | 84.70 | 124.16 | 8.85 | 147.27 | 63.96 | 51.22 | 0.99 |
| 9.55 × 10⁻¹⁰ | 71.55 | 17.46 | 12.15 | 2.50 | 10.50 | 8.29 | 46.84 | 0.98 |
| 3.99 × 10⁻² | 454.24 | 101.41 | 238.55 | 18.13 | 49.33 | 153.18 | 48.19 | 0.96 |
| 2.57 × 10⁻¹ | 393.09 | 2.35 | 191.94 | 61.52 | 708.17 | 0.03 | 37.04 | 0.82 |
| 4.50 × 10⁻¹⁰ | 110.79 | 64.64 | 52.25 | 13.27 | 7.34 | 54.77 | 44.26 | 0.99 |
| 1.32 × 10⁻⁵ | 295.66 | 98.45 | 203.23 | 9.84 | 93.86 | 72.47 | 45.40 | 0.98 |
| 1.28 × 10⁻¹ | 1035.27 | 400.32 | 323.29 | 0.41 | 20.73 | 741.12 | 28.11 | 0.93 |
| 4.59 × 10⁻⁶ | 510.60 | 69.01 | 95.37 | 4.10 | 78.01 | 88.20 | 27.51 | 0.98 |
| 7.17 × 10⁻⁷ | 74.85 | 17.94 | 75.88 | 5.47 | 35.84 | 12.89 | 43.47 | 0.99 |
| 1.07 × 10⁻¹ | 76.28 | 133.60 | 190.92 | 16.27 | 73.15 | 57.44 | 35.41 | 0.99 |
| 5.22 × 10⁻⁵ | 168.01 | 24.62 | 631.45 | 39.19 | 82.66 | 101.16 | 51.59 | 0.98 |
Figure 6.
(a) A representative graph of the biaxial experimental data and its constitutive model fit. (b) Results of the non-parametric bootstrapping demonstrating unimodal distribution of parameters. (Online version in colour.)
3.4. Mechanical stresses and strains associated with torsion
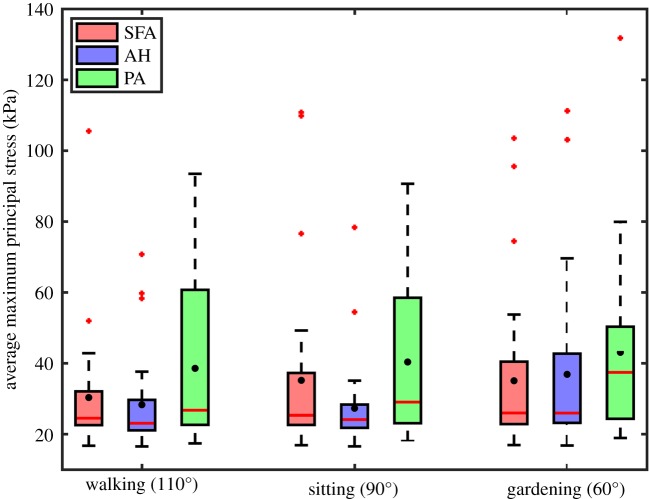
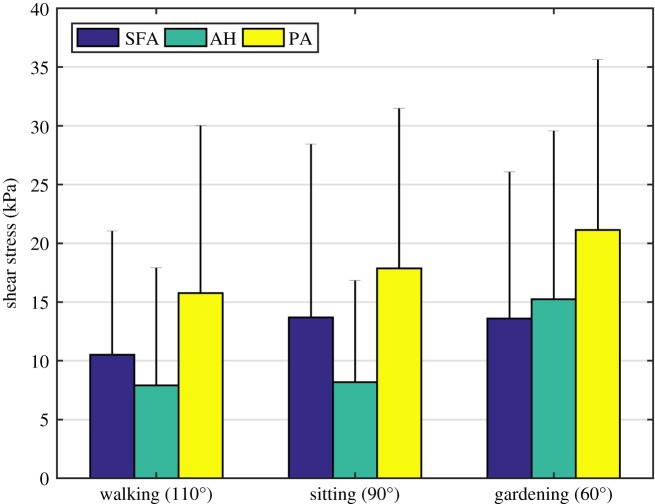
Maximum principal stresses associated with both internal pressure and limb flexion-induced torsion are summarized in figure 7 for the SFA, AH and PA. Stresses varied along the length of the FPA with highest values observed distally in all leg postures. In the walking posture, mean stresses were 30.3 kPa, 28.3 kPa and 38.6 kPa in the SFA, AH and PA, respectively. In the sitting and gardening postures principal stresses increased 16% and 15.6% in the SFA, decreased 3.5% and increased 30.3% at the AH, and increased 4.6% and 11.7% in the PA. To put these results in perspective, internal pressure without twist produced 16.5–28.8 kPa range of maximum principal stresses with an average value of 22.3 kPa. On average, twist increased the magnitude of maximum principal stress by 20–89%, and changed its direction from being purely circumferentially aligned to shifting 16.9–38.7° towards the longitudinal axis. Shear stresses due to torsion σθz are summarized in figure 8. On average, shear stress ranged 10.5–13.7 kPa in the SFA, 7.9–15.2 kPa at the AH and 15.8–21.1 kPa in the PA in different postures with maximum values reaching almost 45 kPa.
Figure 7.
Maximum principal stresses averaged through the thickness of the superficial femoral artery (SFA), adductor hiatus segment (AH) and popliteal artery (PA) during walking, sitting and gardening postures. Box extends to 25% and 75% confidence levels, whiskers depict data range excluding outliers, black dots correspond to mean values and horizontal bar represents median values. Outliers are marked with a plus symbol. (Online version in colour.)
Figure 8.
Shear stress due to twist σθz averaged through thickness in the superficial femoral artery (SFA), adductor hiatus segment (AH) and popliteal artery (PA) during walking, sitting and gardening postures. Bar graphs represent mean values of stress and error bars extend to 1 s.d. (Online version in colour.)
Shear strain on the outer surface of the FPA wall in different limb postures averaged Eθz = 0.045–0.055 for the SFA, Eθz = 0.033–0.065 for the AH and Eθz = 0.060–0.100 for the PA. Its distribution along the length of the FPA was very similar to the torsion distribution (figure 4a) with higher values shifted towards the PA and shear peaks increasing with the increase of the limb flexion. Twist also reduced circumferential stretch, and while the SFA and AH demonstrated mostly tensile stretches in all postures (mean  and
and  , respectively), stretches in the PA were mostly compressive in the sitting and gardening postures with an average of
  and
and  , respectively, in spite of internal pressure. The distribution of Green strains along the normalized FPA length in the gardening posture is demonstrated in figure 4b.
Unlike measurements of torsion, statistical differences in stresses among FPA segments were observed only for the AH and PA (all postures: p < 0.01, p < 0.01 and p = 0.03), and for the SFA and PA in the gardening posture (p < 0.01). Intramural stresses in the AH and PA increased with age in the walking and sitting postures (p < 0.01, p = 0.02), but there was no correlation in the gardening posture (p = 0.31). Stresses in the SFA did not correlate with age in either of the postures. After controlling for age, intramural stresses in the PA were higher in males in the sitting and gardening postures (p = 0.04, p = 0.01). Gender had no statistically significant effect on stresses in other FPA segments or postures.
4. Discussion
The FPA appears to be significantly different from other peripheral arteries, such as the carotid, renal and iliac arteries, possibly because of lower blood flow, but more importantly because the SFA and PA that comprise the FPA segment, undergo large deformations during flexion of the limb [9,14]. These severe deformations are reflected clinically by the frequency of disease development and the high incidence of stent fractures [2,31–33], and are believed to contribute to poor clinical outcomes of current open and endovascular PAD treatments [9].
Torsion is one of the main deformation modes, but is also the most challenging to measure in vivo due to lack of identifiable arterial markers that can be tracked with limb flexion. There are only four studies that measured torsion in the human FPA and those were performed by Cheng et al. [17,18], Klein et al. [19] and MacTaggart et al. [14]. Cheng et al. [17] was the first to measure limb flexion-induced torsion in 16 SFAs from eight human subjects 27 ± 5 years old. They used two arterial side branches as markers to track SFA deformations as the limb was flexed from the supine to the fetal positions producing 2.8 ± 1.7° cm−1 twist. Similar twists (1.7 ± 1.0° cm−1 and 3.5 ± 1.9° cm−1 for the SFA and PA, respectively) were reported by Klein et al. [19] who used a similar measurement technique based on three side branches of 10 FPAs (average age 57 ± 10 years old). In a later study, Cheng et al. [18] used as many side branches as they could identify on clinical MR (number varied from one patient to another) to measure torsion in 14 SFAs that were on average 56 ± 5 years old. The SFA was divided into three equally sized segments, and average torsion per segment was reported as 1.3 ± 0.8–2.1 ± 1.3° cm−1 with higher values occurring distally, i.e. closer to AH. Until recently, results of these three studies summarized by Ansari et al. [9] were used by most FPA stent manufacturers as boundary conditions for their torsional tests.
Though the side branch technique used by Cheng et al. and Klein et al. is likely the only option to measure torsion in vivo, it may significantly underestimate peak values that occur locally in areas where no branches can be identified. Furthermore, side branches may tether the artery to the surrounding tissues and dampen deformations. To resolve these limitations, MacTaggart et al. [14] proposed a new measurement technique using intra-arterial markers. Markers were deployed into the FPAs of cadavers without disturbing the surrounding tissues or constraining the artery, and the measurement technique allowed assessment of local deformations in 1–2 cm segments independent of side branches. Results demonstrated that though the length-average twist corresponded to that reported by Cheng et al. and Klein et al. (4° cm−1), distal FPA segments, particularly at the AH and PA below the knee, twisted significantly more—to as much as 77° cm−1. This study was performed to refine these values in a larger sample size (n = 28 limbs) using an expanded, refined and validated methodology with improved marker design, vessel perfusion and stress analysis.
Our current technique constituted several major improvements over the original method [14]. First, the markers were laser cut from nitinol instead of using a stainless steel wire. Superelasticity of the nitinol eliminated the occurrence of plastic deformations of the markers during loading into the catheter delivery system. The markers were designed to have four prongs instead of two to improve stability, and one prong was made thicker at its end for easier identification on CT images and more accurate assessment of torsion. In addition, a new string-based delivery system allowed more uniform placement of markers in all limbs. Use of a perfused cadaver model allowed physiologic pressures and temperature to be achieved during limb flexion while also providing uniform opacification of the main arteries and their branches for image analysis. These improvements over the original method [14] allowed us to achieve higher accuracy of measurements as demonstrated by validation experiments in a series of silicone tubes.
This study demonstrates that on average, the largest twist in the SFA varies 10.2–12.5° cm−1, at the AH 7.8–15.6° cm−1 and in the PA 14.2–25.8° cm−1 in the walking, sitting and gardening postures with peak values reaching as high as 42.5° cm−1. These values are significantly larger than those summarized by Ansari et al. [9] (2–4° cm−1), but more conservative than the 77° cm−1 average PA twist reported by MacTaggart et al. [14]. The discrepancy with the latter can be attributed to a larger sample size, better experimental technique, more uniform marker placement, and a different normalization scheme used in the current study. Here twist was normalized to the length of the arterial segment in the straight posture, whereas previously it was normalized to the length of the segment in the bent posture—a difference accounting for up to 21% higher values than those reported here.
Locally high torsion in the PA and at the AH can be attributed to different factors. The AH is a thick tendinous channel between the adductor magnus muscle and the femur that constrains the artery as it passes from the anterior to posterior thigh. The PA, on the other hand, is not constrained by the tendinous structures, but does have a high density of small side branches compared with the proximal SFA. Interestingly, in our study torsion did not change with age suggesting that the same physiologic level of twist is imposed by the surrounding tissues independent of ageing. While this result is intriguing, it should be verified using younger arteries as the average age of our cadavers was 80 ± 12 years old.
Severe FPA twists were associated with high mechanical stresses that ranged from 30.3 to 35.2 kPa in the SFA, 27.3–36.9 kPa at the AH and 38.6–43.1 kPa in the PA with 20–89% attributed to shear depending on the arterial segment and posture. Twist affected the direction of principal stresses, rotating them longitudinally. It also reduced vessel diameter, in some cases causing circumferential compression. Unlike twist, mechanical stresses in the distal FPA did increase with age in some postures, possibly reflecting stiffening of the FPA. Age-associated stiffening has previously been related to the degradation and fragmentation of longitudinal elastin and accumulation of collagen [22,25], both resulting in higher limb flexion-induced mechanical stresses in the FPA as demonstrated by computational modelling [28]. High mechanical stress can damage the arterial wall, initiating a cascade of remodelling responses that involve migration and proliferation of cells and exacerbating FPA pathology [10,34]. Interestingly, Watt [2] described common sites for FPA occlusions and indicated that AH and PA have the highest incidence of vascular disease, areas that here were reported to experience the highest mechanical stresses due to limb flexion-induced torsion.
Though our study was designed to inform device manufacturers of the torsional deformations and stresses in the SFA, AH and PA with limb flexion and extension, its results should be viewed in the context of limitations. First, axial stretch was kept constant (λz = 1) to investigate the effect of torsion alone, but additional considerations of axial shortening, in situ longitudinal pre-stretch, and bending would be beneficial for a refined analysis of the in vivo FPA stress state. Second, cadavers used in this study were lightly embalmed. Though lightly embalmed cadavers preserve many of the natural tissue properties when compared with fully embalmed cadavers [14,20], it is not known how close the arterial characteristics are to the in vivo properties, which may affect torsional measurements. Though subjectively lightly embalmed arteries are similar to the arteries of PAD patients, this question requires more investigation.
5. Conclusion
The human FPA experiences significant torsion during limb flexion, and arterial twist increases with more acute flexion angles. Torsion is distributed non-uniformly along the length of the artery achieving largest values distally. PA twists as much as 26° cm−1 in the gardening posture with highest values reaching 43° cm−1. These large twists are associated with significant principal stresses reaching 43 kPa, which is 89% higher than stresses stemming from internal pressure alone. Torsional deformations and the associated mechanical stresses summarized in this work may help better understand FPA pathophysiology and be instrumental in designing repair materials and devices for open and endovascular PAD treatments.
Authors' contributions
W.P., P.D., C.L., A.S., J.M.T., A.K. performed torsion measurements; A.D. performed analytical modelling; P.D. performed mechanical characterization; A.D., W.P., A.K., J.M.T., K.M. participated in data analysis and interpretation; A.D., W.P. drafted the manuscript; P.D., C.L., A.S., K.M., A.K. helped to revise the manuscript; A.K., J.M. conceived, designed and coordinated the study and helped draft the manuscript. All authors gave final approval for publication.
Competing interests
We have no competing interests.
Funding
Research reported in this publication was supported in part by National Heart, Lung, and Blood Institute of the National Institutes of Health (grant nos. R01 HL125736 and F32 HL124905). The authors also wish to acknowledge the Charles and Mary Heider Fund for Excellence in Vascular Surgery and the MARC U*STAR Program for their help and support.
References
- 1.Mahoney EM, Wang K, Keo HH, Duval S, Smolderen KG, Cohen DJ, Steg G, Bhatt DL, Hirsch AT. 2010. Vascular hospitalization rates and costs in patients with peripheral artery disease in the United States. Circ. Cardiovasc. Qual. Outcomes 3, 642–651. ( 10.1161/CIRCOUTCOMES.109.930735) [DOI] [PubMed] [Google Scholar]
- 2.Watt J. 1965. Origin of femoro-popliteal occlusions. Br. Med. J. 2, 1455–1459. ( 10.1136/bmj.2.5476.1455) [DOI] [PMC free article] [PubMed] [Google Scholar]
- 3.Mahoney EM, et al. 2008. One-year costs in patients with a history of or at risk for atherothrombosis in the United States. Circ. Cardiovasc. Qual. Outcomes 1, 38–45. ( 10.1161/CIRCOUTCOMES.108.775247) [DOI] [PubMed] [Google Scholar]
- 4.Adam DJ, et al. 2005. Bypass versus angioplasty in severe ischaemia of the leg (BASIL): multicentre, randomised controlled trial. Lancet 366, 1925–1934. ( 10.1016/S0140-6736(05)67704-5) [DOI] [PubMed] [Google Scholar]
- 5.Conte MS, et al. 2006. Results of PREVENT III: a multicenter, randomized trial of edifoligide for the prevention of vein graft failure in lower extremity bypass surgery. J. Vasc. Surg. 43, 742–751. ( 10.1016/j.jvs.2005.12.058) [DOI] [PubMed] [Google Scholar]
- 6.Schillinger M, et al. 2006. Balloon angioplasty versus implantation of nitinol stents in the superficial femoral artery. N. Engl. J. Med. 354, 1879–1888. ( 10.1056/NEJMoa051303) [DOI] [PubMed] [Google Scholar]
- 7.Schillinger M, et al. 2007. Sustained benefit at 2 years of primary femoropopliteal stenting compared with balloon angioplasty with optional stenting. Circulation 115, 2745–2749. ( 10.1161/CIRCULATIONAHA.107.688341) [DOI] [PubMed] [Google Scholar]
- 8.Siracuse JJ, Giles KA, Pomposelli FB, Hamdan AD, Wyers MC, Chaikof EL, Nedeau AE, Schermerhorn ML. 2012. Results for primary bypass versus primary angioplasty/stent for intermittent claudication due to superficial femoral artery occlusive disease. J. Vasc. Surg. 55, 1001–1007. ( 10.1016/j.jvs.2011.10.128) [DOI] [PMC free article] [PubMed] [Google Scholar]
- 9.Ansari F, Pack LK, Brooks SS, Morrison TM. 2013. Design considerations for studies of the biomechanical environment of the femoropopliteal arteries. J. Vasc. Surg. 58, 804–813. ( 10.1016/j.jvs.2013.03.052) [DOI] [PubMed] [Google Scholar]
- 10.Clowes AW, Reidy MA, Clowes MM. 1983. Mechanisms of stenosis after arterial injury. Lab. Investig. 49, 208–215. [PubMed] [Google Scholar]
- 11.Wensing PJW, Meiss L, Mali WPTM, Hillen B. 1998. Early atherosclerotic lesions spiraling through the femoral artery. Arterioscler. Thromb. Vasc. Biol. 18, 1554–1558. ( 10.1161/01.ATV.18.10.1554) [DOI] [PubMed] [Google Scholar]
- 12.Dunlop GR, Santos R. 1957. Adductor-canal thrombosis. N. Engl. J. Med. 256, 577–580. ( 10.1056/NEJM195703282561301) [DOI] [PubMed] [Google Scholar]
- 13.PALMA EC. 1959. Hemodynamic arteriopathy. Angiology 10, 134–143. ( 10.1177/000331975901000302) [DOI] [PubMed] [Google Scholar]
- 14.MacTaggart J, et al. 2014. Three-dimensional bending, torsion and axial compression of the femoropopliteal artery during limb flexion. J. Biomech. 47, 2249–2256. ( 10.1016/j.jbiomech.2014.04.053) [DOI] [PubMed] [Google Scholar]
- 15.Stents I, Services H. 2010. Guidance for industry and FDA staff non-clinical engineering tests and recommended labeling for intravascular stents and associated delivery systems. Time 2010.
- 16.Poulson W, Kamenskiy A, Seas A, Deegan P, Lomneth C, MacTaggart J. In press Limb flexion-induced axial compression and bending in the human femoropopliteal artery. J. Vasc. Surg. [DOI] [PMC free article] [PubMed] [Google Scholar]
- 17.Cheng C, Wilson N, Hallett R. 2006. In vivo MR angiographic quantification of axial and twisting deformations of the superficial femoral artery resulting from maximum hip and knee flexion. J. Vasc. Interv. Radiol. 17, 979–987. ( 10.1097/01.RVI.0000220367.62137.E8) [DOI] [PubMed] [Google Scholar]
- 18.Cheng CP, Choi G, Herfkens RJ, Taylor CA. 2010. The effect of aging on deformations of the superficial femoral artery resulting from hip and knee flexion: potential clinical implications. J. Vasc. Interv. Radiol. 21, 195–202. ( 10.1016/j.jvir.2009.08.027) [DOI] [PMC free article] [PubMed] [Google Scholar]
- 19.Klein AJ, Chen SJ, Messenger JC, Hansgen AR, Plomondon ME, Carroll JD, Casserly IP. 2009. Quantitative assessment of the conformational change in the femoropopliteal artery with leg movement. Catheter Cardiovasc. Interv. 74, 787–798. ( 10.1002/ccd.22124) [DOI] [PubMed] [Google Scholar]
- 20.Wadman MC, Lomneth CS, Hoffman LH, Zeger WG, Lander L, Walker RA. 2010. Assessment of a new model for femoral ultrasound-guided central venous access procedural training: a pilot study. Acad. Emerg. Med. 17, 88–92. ( 10.1111/j.1553-2712.2009.00626.x) [DOI] [PubMed] [Google Scholar]
- 21.Kamenskiy A, et al. 2015. Patient demographics and cardiovascular risk factors differentially influence geometric remodeling of the aorta compared with the peripheral arteries. Surgery 158, 1617–1627. ( 10.1016/j.surg.2015.05.013) [DOI] [PMC free article] [PubMed] [Google Scholar]
- 22.Kamenskiy AV, Pipinos II, Dzenis YA, Phillips NY, Desyatova AS, Kitson J, Bowen R, MacTaggart JN. 2015. Effects of age on the physiological and mechanical characteristics of human femoropopliteal arteries. Acta Biomater. 11, 304–313. ( 10.1016/j.actbio.2014.09.050) [DOI] [PubMed] [Google Scholar]
- 23.Kamenskiy A, et al. 2014. Biaxial mechanical properties of the human thoracic and abdominal aorta, common carotid, subclavian, renal and common iliac arteries. Biomech. Model Mechanobiol. 13, 1341–1359. ( 10.1007/s10237-014-0576-6) [DOI] [PubMed] [Google Scholar]
- 24.Kamenskiy AV, Pipinos II, Dzenis YA, Lomneth CS, Kazmi SAJ, Phillips NY, MacTaggart JN. 2014. Passive biaxial mechanical properties and in vivo axial pre-stretch of the diseased human femoropopliteal and tibial arteries. Acta Biomater. 10, 1301–1313. ( 10.1016/j.actbio.2013.12.027) [DOI] [PMC free article] [PubMed] [Google Scholar]
- 25.Kamenskiy A, Seas A, Deegan P, Poulson W, Anttila E, Sim S, Desyatova A, MacTaggart J. In press Constitutive description of human femoropopliteal artery aging. Biomech. Model Mechanobiol. ( 10.1007/s10237-016-0845-7) [DOI] [PMC free article] [PubMed] [Google Scholar]
- 26.Holzapfel GA, Gasser TC, Ogden RW. 2000. A new constitutive framework for arterial wall mechanics and a comparative study of material models. J. Elast. 61, 1–48. ( 10.1023/A:1010835316564) [DOI] [Google Scholar]
- 27.Kamenskiy A, Seas A, Bowen G, Deegan P, Desyatova A, Bohlim N, Poulson W, MacTaggart J. 2016. In situ longitudinal pre-stretch in the human femoropopliteal artery. Acta Biomater. 32, 231–237. ( 10.1016/j.actbio.2016.01.002) [DOI] [PMC free article] [PubMed] [Google Scholar]
- 28.Desyatova A, MacTaggart J, Poulson W, Deegan P, Lomneth C, Sandip A, Kamenskiy A. In press The choice of a constitutive formulation for modeling limb flexion-induced deformations and stresses in the human femoropopliteal arteries of different ages. Biomech. Model Mechanobiol. ( 10.1007/s10237-016-0852-8) [DOI] [PMC free article] [PubMed] [Google Scholar]
- 29.Ferruzzi J, Vorp DA, Humphrey JD. 2011. On constitutive descriptors of the biaxial mechanical behaviour of human abdominal aorta and aneurysms. J. R. Soc. Interface 8, 435–450. ( 10.1098/rsif.2010.0299) [DOI] [PMC free article] [PubMed] [Google Scholar]
- 30.Humphrey JD. 2002. Cardiovascular solid mechanics: cells, tissues, and organs. Berlin, Germany: Springer. [Google Scholar]
- 31.Scheinert D, Scheinert S, Sax J, Piorkowski C, Bräunlich S, Ulrich M, Biamino G, Schmidt A. 2005. Prevalence and clinical impact of stent fractures after femoropopliteal stenting. J. Am. Coll. Cardiol. 45, 312–315. ( 10.1016/j.jacc.2004.11.026) [DOI] [PubMed] [Google Scholar]
- 32.Laird JR, et al. 2012. Nitinol stent implantation vs. balloon angioplasty for lesions in the superficial femoral and proximal popliteal arteries of patients with claudication: three-year follow-up from the RESILIENT randomized trial. J. Endovasc. Ther. 19, 1–9. ( 10.1583/11-3627.1) [DOI] [PubMed] [Google Scholar]
- 33.Higashiura W, Kubota Y, Sakaguchi S, Kurumatani N, Nakamae M, Nishimine K, Kichikawa K. 2009. Prevalence, factors, and clinical impact of self-expanding stent fractures following iliac artery stenting. J. Vasc. Surg. 49, 645–652. ( 10.1016/j.jvs.2008.10.019) [DOI] [PubMed] [Google Scholar]
- 34.Ross R, Glomset JA. 1973. Atherosclerosis and the arterial smooth muscle cell. Science (80-) 180, 1332–1339. ( 10.1126/science.180.4093.1332) [DOI] [PubMed] [Google Scholar]


