

Abstract
Background
In the US, black infants remain more than twice as likely as white infants to die in the first year of life. Previous studies of geographic variation in infant mortality disparities have been limited to large metropolitan areas where stable estimates of infant mortality rates by race can be determined, leaving much of the US unexplored.
Methods
The objective of this analysis was to describe geographic variation in county-level racial disparities in infant mortality rates across the 48 contiguous US states and District of Columbia using national linked birth and infant death period files (2004–2011). We implemented Bayesian shared component models in OpenBUGS, borrowing strength across both spatial units and racial groups. We mapped posterior estimates of mortality rates for black and white infants as well as relative and absolute disparities.
Results
Black infants had higher infant mortality rates than white infants in all counties, but there was geographic variation in the magnitude of both relative and absolute disparities. The mean difference between black and white rates was 5.9 per 1,000 (median: 5.8, interquartile range: 5.2 to 6.6 per 1,000), while those for black infants were 2.2 times higher than for white infants (median: 2.1, interquartile range: 1.9–2.3). One quarter of the county-level variation in rates for black infants was shared with white infants.
Conclusions
Examining county-level variation in infant mortality rates among black and white infants and related racial disparities may inform efforts to redress inequities and reduce the burden of infant mortality in the US.
Although infant mortality rates have declined substantially in the US over the past several decades, large racial and ethnic disparities persist.1–6 Black infants are more than twice as likely to die in the first year of life as white infants.5 Many studies have examined potential determinants of these disparities, ranging from individual level-factors such as sociodemographic or economic characteristics and health behaviors to contextual factors such as county-level poverty, residential racial segregation, or availability of health services.3,4,7–17 A few prior studies have used spatial statistical methods to examine geographic variation in infant mortality in relation to factors, such as poverty, urban/rural classification, or residential racial segregation.18,19 However, these studies did not look at geographic variation in disparities.
Examining geographic variation in disparities poses challenges. Many counties in the US record small numbers of births or infant deaths for many racial and ethnic subpopulations, even when these counts are summed over several years. One consequence of this is that race-specific infant mortality rates are highly unstable in many areas. In addition, this problem is compounded when looking at disparities, as instability in the race-specific estimates can lead to highly inflated or deflated estimates of disparities on both the relative and absolute scales. This is more of a problem when disparities are assessed on the relative scale, as an infant mortality rate at or near zero in the denominator will lead to a county-level disparity estimate that is undefined or highly inflated. Small area estimation methods can be used to address these challenges. Specifically, Bayesian shared component models can be used to examine the spatial variation in two or more outcomes, borrowing strength across both spatial units and outcomes.20,21 These types of shared component models are used in disease mapping to account for spatial variation in risk and are readily extended to multivariate applications.22 These types of models have been used to map multiple diseases,23 examine spatial variation in health outcomes by gender,24–26 and to describe ethnic disparities in epilepsy,27 but have not yet been used to examine spatial variation in disparities in infant mortality.
An additional strength of shared component models is that they account for the spatially patterned latent risk factors that two or more outcomes may share by including a spatially structured shared random effect, which represents the area-level variation in risk common to both groups. In the case of black-white disparities in infant mortality, this “true underlying risk surface of interest” describes how black and white infant mortality rates exhibit the same “peaks” and “valleys” across the study region.20 This shared component represents the set of unobserved variables that might explain geographic variation in infant mortality for both race groups.20,21 To the extent that the underlying risk surface for black infants differs from that of white infants, this can also be quantified using shared component models. Subsequently, insight may be gained by decomposing how much of the geographic variation in infant mortality is specific to each race group and how much is shared.25,28 This kind of examination can facilitate understanding of the processes that might be driving differences and commonalities in infant mortality risk across groups and geographies.
The objective of this analysis was to examine spatial variation in the black and white infant mortality experience and related racial disparities across the contiguous US using Bayesian shared component models to distinguish between variation that is unique to black infants from variation that is shared by both black and white infants. Eliminating health disparities is an overarching goal of the US Healthy People initiative;29 a better understanding of how disparities in infant mortality vary geographically and what factors may be related to this spatial heterogeneity could contribute to future efforts to address inequities.
METHODS
Study Population
We obtained data from the Birth Period Linked Birth - Infant Death Data Files from US Vital Statistics for 2004 to 2011. These files contain data on 33,223,455 births and 214,441 deaths. We included all singleton births and infant deaths (<1 year old) occurring in the 48 contiguous states and District of Columbia. We excluded data for Alaska and Hawaii because most counties within these states reported zero non-Hispanic black infant deaths. These states also have island or isolated counties that lack a sufficient number of nearby counties to use in spatially dependent models. We also excluded births and deaths with missing information about mother’s state of residence or where residence was outside the US, leaving 31,800,163 births and 180,932 deaths. We used record weights to account for the small proportion of deaths that were unable to be linked to corresponding birth data; weights ensure that the number of infant deaths in the linked files is equivalent to the total number of infant deaths reported in the standard mortality files.
Although data are available for many different racial and ethnic subpopulations, the county-level population sizes of many of the groups are very small or zero in many cases. We therefore limit the analysis to non-Hispanic black (4,623,155 births and 52,075 deaths, weighted) and non-Hispanic white infants (17,210,653 births, and 81,866 deaths, weighted), hereafter referred to as “black” and “white.”30 The race categorizations were obtained from the maternal race reported on the birth certificate, consistent with how these racial groups are defined in national reports on infant mortality.31 Because not all states report multiple-race data, maternal race is bridged or imputed to a single race when multiple races are reported; these methods are described in the data documentation.32 Out of 3109 counties in the contiguous US, 2,868 counties had data on births of both black and white infants. Although 241 counties reported no births for black infants (and therefore the black infant mortality rate would be undefined), these counties were not excluded as they contribute information to the estimation of white infant mortality rates.
As this study used publicly available secondary data, institutional review board approval was not needed.
Statistical Analysis
We pooled data from 2004 to 2011 to reduce the number of counties with zero births or deaths. We calculated the race-specific number of births and deaths by county, and used small area estimation methods to produce stable county-level estimates of the race-specific infant mortality rates.
Rather than model the black and white infant mortality rates separately, we used Bayesian shared component models, which account for the association between black and white infant mortality rates through the inclusion of county-level shared random effects, and the race-specific variation through the inclusion of an independent random effect for a given race group. To account for spatial dependence, conditionally autoregressive priors were specified for both random effects.33,34 As such, the county-level variation in black and white infant mortality is partitioned into a shared component, and a component specific to black infants, both of which are spatially dependent.22,35 The black-specific component reflects the county-level variation in infant mortality for black infants, beyond the variation that is shared by both black and white infants.
The number of deaths at the county level for black and white infants ( and ) follow a Poisson distribution with means and , respectively. These means are defined as the product of the county-level race-specific excess or relative risks ( and ) and the expected death counts for black and white infants ( and ) which are calculated based on the race-specific number of births per county multiplied by the overall mean infant mortality rate, expressed as a proportion (i.e., 183,280 deaths [weighted]/31,800,163 births in the continental US = 0.0061). These latter values represent the background population effect under a scenario where all county and race-specific variation is purely a function of the size of the population at risk (i.e., number of black and white births for each county).
The black and white specific county-level infant mortality rates (IMR) can then be estimated from the model using and :
The black and white specific county-level relative risks ( and ), also termed standardized mortality ratios, are modeled using a log link, where αb and αw are the race-specific intercepts; vi is a shared random component; νi is an additional random component specific to black infants; and, δ is a scaling component required for identifiability. This term allows for the shared component to be scaled up or down for each race group such that while the “peaks” and “valleys” collocate, the magnitude of each might be multiplied or shrunk depending on the size of δ; if δ is equal to one, then the effect of the shared component term is equivalent in size for each race group.
In hierarchical Bayesian models, all parameters are considered stochastic and assigned prior distributions. The shared random component, vi, and the black-specific random component, νi, were assigned conditionally autoregressive priors33,34 where weights are assigned to each county according to adjacency; neighboring counties receive a weight of one while non-neighboring counties receive a weight of zero. This approach allows for spatial smoothing of estimates, where counties borrow strength from neighboring counties to provide stable small area estimates. Delaunay triangulation was used in this study to create spatial weights, which specifies natural neighbors for a set of counties by generating Voronoi triangles from county centroids.36 Nodes connected by a triangle edge are considered neighbors. A diagram of this weighting method can be found in eFigure 1; http://links.lww.com/EDE/B58. This method is appropriate when there are heterogeneous county sizes, and ensures that every county has at least one neighbor, but that the number of neighbors is determined by the distribution of the data.36 The log of the scaling component, log(δ), was assumed to follow an independent normal prior distribution with mean 0 and a small fixed variance of 0.17 consistent with previous studies.22,35 The standard deviations of the shared random component, vi, and the black-specific random component, νi were assigned uniform distributions, U(0,1000). The race-specific intercepts, αb and αw were assigned flat, noninformative priors.
The 241 counties with no births reported for black infants were assigned expected counts of zero, and initial values for were also set to zero, while the observed values for these 241 counties were set to missing. This specification allows for these counties to be retained in the analysis, and it does not make the assumption that the underlying latent risk of infant mortality in these counties is zero. Although data obtained from vital records are not subject to sampling error, it is subject to stochastic error, reporting/registration error and imputation error, in the case of bridged race/ethnicity. Thus, the estimation of infant mortality rates and corresponding disparities for these 241 counties is appropriate because we cannot assume that the population at risk in these locations was truly nonexistent.
Models were implemented in OpenBUGS.37 Code for the model can be found in the eAppendix, http://links.lww.com/EDE/B58.
We also examine models with nonspatial priors for comparison, to determine if accounting for the spatial dependence in infant mortality rates improved model fit. Convergence was monitored using the Brooks-Gelman-Rubin diagnostic tool,38 and model fit was examined using the Deviance Information Criterion.39 Additional fit statistics are described in the eAppendix, http://links.lww.com/EDE/B58.40–44 We assessed convergence for three chains of 60,000 iterations, with a burn-in of 20,000; chains were thinned to retain every 50th value to reduce autocorrelation. We obtained Bayesian posterior predictions for the mean risk difference, at the county-level following model convergence and evaluation. Posterior mean relative risks were also calculated and mapped for comparison. It can be seen that the county-level variation in relative risks between black and white infant mortality rates is attributable to the black-specific random effect, νi, when δ = 1. As δ moves away from 1, then the county-level variation in RRs is also driven in part by variation in the shared component, vi, and the differential scaling of this term across the race groups, indicated by δ.
Finally, we estimated the rankings of counties for four outcomes of interest: the black and white infant mortality rates, the risk differences, and the relative risks. Median rankings are presented in the eAppendix, http://links.lww.com/EDE/B58.
RESULTS
The crude infant mortality rates for black and white infants were 11.1 and 5.5 per 1,000 infants, respectively, for the period 2004–2011. Out of 3,109 counties in the contiguous US, 241 reported no black births throughout the time period 2004–2011; 1,577 counties (50%) reported no deaths to black infants and 200 (6%) reported no deaths to white infants.
There was very little overlap in the distribution of black and white infant mortality rates. Figure 1 illustrates the posterior predicted mean mortality rates at the county level for black and white infants from the spatial model. Posterior density plots of the mean county-level IMRs for black and white infants are shown in eFigures 3 and 4; http://links.lww.com/EDE/B58. The estimated black infant mortality rates ranged from 6.6 per 1,000 births to 16.2 per 1,000 births, with a mean of 11.3 per 1,000 births. By comparison, the estimated white infant mortality rates ranged from 1.9 per 1,000 births to 9.9 per 1,000 births, with a mean of 5.4 per 1,000 births. Despite the lack of overlap between the distributions of mortality rates for black and white infants, the county-level rankings were somewhat consistent (eFigure 5; http://links.lww.com/EDE/B58). Counties ranking in the top quintile for black infant mortality rates tended also to rank in the top quintile for white infant mortality rates; although there was more consolidation of the top quintiles for white infant mortality rates in the south and southeast, and more variability in the western half of the country, whereas counties in the regions around the great lakes (e.g., Michigan, parts of Wisconsin and New York) fell into the top quintile for black infant mortality rates.
FIGURE 1.
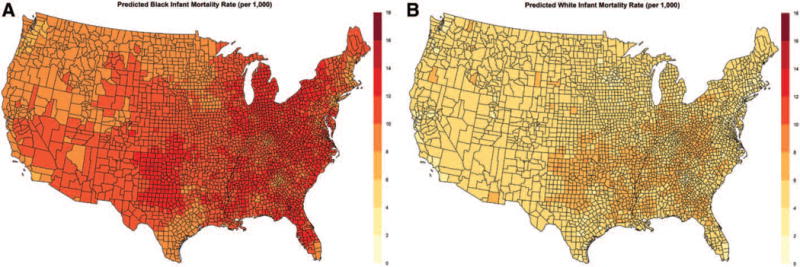
Posterior predicted black infant mortality rate (per 1,000) by county, 2004–2011 (A) and posterior predicted white infant mortality rate (per 1,000) by county, 2004–2011 (B) from the spatial shared component model, shown on the same scale.
In every county in the contiguous US, black infant mortality rates were higher than white infant mortality rates, although the magnitude of absolute and relative disparities exhibited substantial spatial variation. The estimated risk difference at the county level comparing black and white infants ranged from 2.9 per 1,000 births to 10.0 per 1,000 births (mean 5.9 per 1,000; median 5.8 per 1,000; interquartile range: 5.2–6.6 per 1,000), while the relative risk ranged from 1.5 to 4.8 (mean 2.2; median 2.1; interquartile range: 1.9–2.3). Thus, the smallest relative disparities at the county level suggested that black infant mortality rates were still approximately 50% higher than white infant mortality rates. Maps of the mean absolute and relative disparities are shown in Figure 2 (corresponding county rankings can be seen in eFigure 6; http://links.lww.com/EDE/B58). While absolute disparities did seem to be greatest along the eastern US, there were counties throughout the south and southwest that also exhibited high absolute disparities. Geographic patterns were largely similar for relative disparities, with the largest disparities seen in regions around the great lakes, in the northeast, the mid-Atlantic region, and parts of Florida. The correspondence between county rankings for black and white infant mortality rates, and absolute and relative disparities can be seen in a scatterplot in eFigure 7; http://links.lww.com/EDE/B58. Figure 3 illustrates the spatial variation in the shared component, vi, and the component specific to black infant mortality, νi.
FIGURE 2.
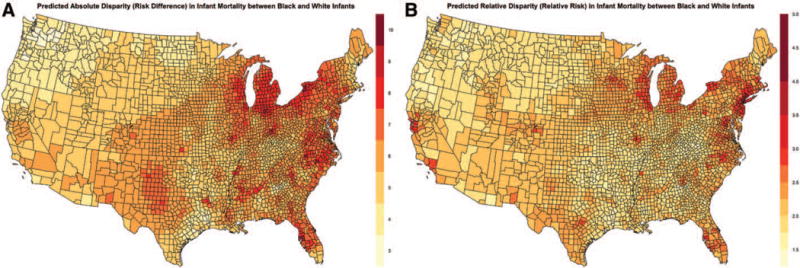
Posterior predicted absolute disparities (risk difference) by county in infant mortality rates (per 1,000) comparing black and white infants, 2004–2011 (A) and posterior predicted relative disparities (relative risk) by county in infant mortality rates comparing black and white infants, 2004–2011 (B) from the spatial shared component model.
FIGURE 3.
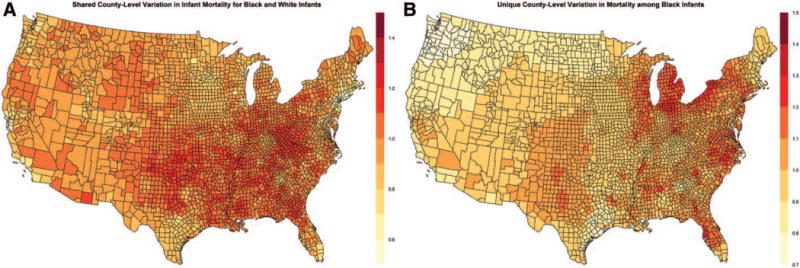
Shared risk (correlated heterogeneity) in infant mortality between black and white infants, 2004–2011 (A) and excess risk (uncorrelated heterogeneity) experienced by black infants (B) from the spatial shared component model.
The spatial and nonspatial model performed similarly in terms of convergence, with similar Brooks-Gelman-Rubin plots, autocorrelation plots, and trace plots. The spatial model provided better fit, with a deviance information criterion reduction of 1,728 points. These plots and additional fit statistics can be seen in eTable 1; http://links.lww.com/EDE/B58. Table 1 presents the results and evaluation of the spatial and nonspatial models. The variance of the standardized mortality ratios, and , was nearly three times larger for black infants than white infants, 0.12 (95% confidence interval: 0.10, 0.16) versus 0.04 (95% confidence interval: 0.04, 0.05), respectively. Looking at the random effects, of the total heterogeneity observed for black infant mortality across the counties, 24% of that heterogeneity was shared with white infants and 76% of the county-level variation seen for black infants was unique or unshared. Furthermore, it appears that much of the difference between black and white infant mortality rates at the county level is derived from the fixed intercepts for black and white rates. The intercept for black infant mortality was more than two-fold higher than the intercept for white infant mortality. In this case, since the models estimated the excess risk relative to the expected mortality rate for black and white infants (calculated as the product of the race-specific number of births for each county and the mean infant mortality rate for the entire US), the intercept for black infants indicates that on average, black infants have a 81% higher than expected mortality rate, while white infants have a 14% lower than expected mortality rate.
TABLE 1.
Comparison of Bayesian Shared Component Models with Spatial Conditionally Autoregressive Priors or Nonspatial Priors for the Random Effects Components
| Spatial | Nonspatial | |
|---|---|---|
| Fixed components | ||
| Exp(αb): intercept (black) | 1.8 (1.8–1.9) | 1.9 (1.8–1.9) |
| Exp(αw): intercept (white) | 0.86 (0.85–0.87) | 0.85 (0.83–0.86) |
| δ: scaling parametera | 0.62 (0.54–0.69) | 0.62 (0.57–0.67) |
| Random effects | ||
| : black-specific heterogeneity | 0.03 (0.02–0.04) | 0.02 (0.01–0.03) |
| : shared variation (black) | 0.01 (0.00–0.01) | 0.01 (0.00–0.01) |
| : shared variation (white) | 0.06 (0.05–0.06) | 0.07 (0.06–0.07) |
| Proportion shared variation (black) | 0.24 (0.14–0.36) | 0.32 (0.23–0.42) |
| Model deviance information criteria | 23900 | 25628 |
Values in parentheses represent the 95% credible intervals of the estimates. The OpenBUGS code to estimate the model parameters can be found in the eAppendix (http://links.lww.com/EDE/B58).
The differential scaling of the shared random effect, vi, for black and white infants is represented by δ.
As an additional check of the model performance, we compared model-based estimates aggregated to the state level to state-level direct estimates, which should largely not suffer from the problem of instability. These comparisons can be seen in eFigures 8 and 9; http://links.lww.com/EDE/B58. Model-based estimates of mortality rates for black infants corresponded closely to direct estimates, although infant mortality rates for Nebraska, Rhode Island, and the District of Columbia tended to be underestimated by the model and those for Iowa and West Virginia tended to be overestimated by the model. For white infant mortality rates, the model-based and direct estimates fell mostly along a line of equality, with estimates of rates being overestimated by the model for the District of Columbia and underestimated for Wyoming. Risk differences and relative risks were underestimated for the District of Columbia, and risk differences were overestimated for West Virginia.
Maps generated from the posterior predicted values from the nonspatial models are shown in eFigures 10–14; http://links.lww.com/EDE/B58. For all outcomes of interest, the nonspatial models produced maps that exhibited much less spatial variation than the spatial models. This would be expected because in the nonspatial models, the estimation of the black infant mortality rate is borrowing strength globally, as opposed to borrowing strength from only the neighboring counties in the spatially weighted models.
DISCUSSION
There is substantial spatial variation across the contiguous US in race-specific infant mortality rates and in black-white disparities. The small number of births and deaths for a given racial or ethnic subpopulation at the county level generally makes the direct estimation of disparities in infant mortality impossible due to the instability of the estimates. Bayesian shared component models offer a flexible solution by allowing for the borrowing of strength across geographic areas and populations (e.g., black and white infants) to stabilize county-level estimates of black and white infant mortality, as well as the estimates of disparities between these two groups.
Bayesian shared component models provide a description of both the shared heterogeneity in infant mortality that both black and white infants experience, as well as the spatial heterogeneity that is specific to black infants in the contiguous US. The shared component represents a set of latent or unobserved characteristics at the county level that influence both white and black infant mortality. Results of this analysis suggest that the variation across counties in infant mortality for black infants is partly driven by factors common to both white and black infants. These factors could include access to neonatal intensive care units, perinatal regionalization, as well as overall patterns in health care delivery or broader socioeconomic conditions.40,41 The excess risk experienced by black infants characterized by the black-specific component, νi, reflects a set of risk factors that are unique to black infants, which could include factors such as the black-specific experience of area-level poverty and other socioeconomic conditions, differential access to or utilization of pre- and perinatal care1,41–43 and other determinants that may vary by race, such as maternal age, obesity, and other health risks. In this analysis, the proportion of variation in black infant mortality rates at the county level shared with white infants was approximately 24%, while 76% of the heterogeneity in county-level black infant mortality rates was unique to black infants. This particular estimate is sensitive to the presence of excess zeros in the data, as well as to the magnitude of δ, and should thus be interpreted cautiously.
There are some limitations to note. Several studies have reported widening relative disparities between black and white infants in overall infant mortality rates over the past several decades,1–3,6,44 and declining infant mortality rates since 2005.45 These temporal patterns are masked by combining of several years of data. However, there is a tradeoff between capturing temporal patterns and minimizing the problem of data sparseness. We excluded data for other racial and ethnic sub-populations due to considerations about data sparsity and the geographic concentration of these subgroups; future study may examine multigroup disparities. It is possible that given the spatial sparseness of the data, particularly for black infants, that the spatial patterning of county-level infant mortality rates or related disparities may have been highly influenced by the conditionally autoregressive priors. It has been noted that data sparsity and an excess of zeros can also lead to bias in the posterior estimates, as well as high levels of uncertainty around the estimates.46 We present maps of the coefficients of variation (i.e., relative standard deviations) of the posterior estimates in the eAppendix, http://links.lww.com/EDE/B58; coefficients of variation were generally less than 20% for the vast majority of counties across all outcomes of interest. While zero-inflated models may mitigate the potential bias in posterior estimates due to over-dispersion resulting from excess zeros in the data; parameters from these models did not converge. The Bayesian P values, also presented in eTable 1 (http://links.lww.com/EDE/B58), lend some support to our model choice, as we would expect them to fall closer to zero or one had our models offered inadequate fit to the data, as in the case of zero inflation posing a substantial problem. The limitation remains, however, that our results may be sensitive to the distribution of zeros in the data, and therefore should be interpreted with caution. Finally, because of limitations of using vital statistics or other administrative data sources to examine causal pathways, the focus of this analysis was to provide an overall description of disparities, not to explain the geographic variation observed. Future research examining established determinants of infant mortality may shed light on some of the drivers of these geographic patterns. Additional methodological work on the performance of these models under different specifications (e.g., using proper conditional autoregressive priors), alternative neighboring or weighting schemes, or under varying degrees of zero inflation would be informative as it remains unclear how these different specifications may influence results.
This is, to our knowledge, the first study to provide a description of county-level disparities in infant mortality between black and white infants across the US. Infant mortality is a fundamental marker of general maternal and child health for the US,45 and describing county-level variation in infant mortality rates for black and white infants and related racial disparities may inform future research on the determinants of these disparities as well as efforts to redress inequalities and reduce the burden of infant mortality in the US.
Supplementary Material
Acknowledgments
The findings and conclusions in this article are those of the authors and do not necessarily represent the views of the National Center for Health Statistics, Centers for Disease Control and Prevention.
Footnotes
The authors report no conflicts of interest.
Supplemental digital content is available through direct URL citations in the HTML and PDF versions of this article (www.epidem.com).
References
- 1.Alexander GR, Wingate MS, Bader D, Kogan MD. The increasing racial disparity in infant mortality rates: composition and contributors to recent US trends. Am J Obstet Gynecol. 2008;198:51.e1–51.e9. doi: 10.1016/j.ajog.2007.06.006. [DOI] [PubMed] [Google Scholar]
- 2.Levine RS, Rust GS, Pisu M, et al. Increased Black-White disparities in mortality after the introduction of lifesaving innovations: a possible consequence of US federal laws. Am J Public Health. 2010;100:2176–2184. doi: 10.2105/AJPH.2009.170795. [DOI] [PMC free article] [PubMed] [Google Scholar]
- 3.MacDorman MF, Mathews TJ. The challenge of infant mortality: have we reached a plateau? Public Health Rep. 2009;124:670–681. doi: 10.1177/003335490912400509. [DOI] [PMC free article] [PubMed] [Google Scholar]
- 4.Hauck FR, Tanabe KO, Moon RY. Racial and ethnic disparities in infant mortality. Semin Perinatol. 2011;35:209–220. doi: 10.1053/j.semperi.2011.02.018. [DOI] [PubMed] [Google Scholar]
- 5.Matthews TJ, MacDorman MF. Infant mortality statistics from the 2010 period linked birth/infant death data set. Natl Vital Stat Rep. 2013;62:1–26. [PubMed] [Google Scholar]
- 6.Rossen LM, Schoendorf KC. Trends in racial and ethnic disparities in infant mortality rates in the United States, 1989–2006. Am J Public Health. 2014;104:1549–1556. doi: 10.2105/AJPH.2013.301272. [DOI] [PMC free article] [PubMed] [Google Scholar]
- 7.Anachebe NF. Racial and ethnic disparities in infant and maternal mortality. Ethn Dis. 2006;16(2 suppl 3):S3–71. [PubMed] [Google Scholar]
- 8.Centers for Disease Control and Prevention. Racial/ethnic disparities in infant mortality–United States, 1995–2002. MMWR Morbidity Mortality Weekly Report. 2005;54:553–556. [PubMed] [Google Scholar]
- 9.Collins JW, Jr, David RJ. Racial disparity in low birth weight and infant mortality. Clin Perinatol. 2009;36:63–73. doi: 10.1016/j.clp.2008.09.004. [DOI] [PubMed] [Google Scholar]
- 10.Kitsantas P, Gaffney KF. Racial/ethnic disparities in infant mortality. J Perinat Med. 2010;38:87–94. doi: 10.1515/jpm.2010.014. [DOI] [PubMed] [Google Scholar]
- 11.MacDorman MF, Mathews TJ. Understanding racial and ethnic disparities in U.S. infant mortality rates. NCHS Data Brief. 2011;74:1–8. [PubMed] [Google Scholar]
- 12.Schempf AH, Branum AM, Lukacs SL, Schoendorf KC. The contribution of preterm birth to the Black-White infant mortality gap, 1990 and 2000. Am J Public Health. 2007;97:1255–1260. doi: 10.2105/AJPH.2006.093708. [DOI] [PMC free article] [PubMed] [Google Scholar]
- 13.Schempf A, Kroelinger C, Guyer B. Rising infant mortality in Delaware: an examination of racial differences in secular trends. Matern Child Health J. 2007;11:475–483. doi: 10.1007/s10995-007-0198-z. [DOI] [PubMed] [Google Scholar]
- 14.Straney LD, Lim SS, Murray CJ. Disentangling the effects of risk factors and clinical care on subnational variation in early neonatal mortality in the United States. PLoS One. 2012;7:e49399. doi: 10.1371/journal.pone.0049399. [DOI] [PMC free article] [PubMed] [Google Scholar]
- 15.Singh GK, Kogan MD. Persistent socioeconomic disparities in infant, neonatal, and postneonatal mortality rates in the United States, 1969–2001. Pediatrics. 2007;119:e928–e939. doi: 10.1542/peds.2005-2181. [DOI] [PubMed] [Google Scholar]
- 16.Eudy RL. Infant mortality in the Lower Mississippi Delta: geography, poverty and race. Matern Child Health J. 2009;13:806–813. doi: 10.1007/s10995-008-0311-y. [DOI] [PubMed] [Google Scholar]
- 17.Sparks PJ, McLaughlin DK, Stokes CS. Differential neonatal and post-neonatal infant mortality rates across US counties: the role of socioeconomic conditions and rurality. J Rural Health. 2009;25:332–341. doi: 10.1111/j.1748-0361.2009.00241.x. [DOI] [PubMed] [Google Scholar]
- 18.Sparks PJ, Sparks CS, Campbell JJA. An application of Bayesian spatial statistical methods to the study of racial and poverty segregation and infant mortality rates in the US. GeoJournal. 2013;78:389–405. [Google Scholar]
- 19.Yao N, Matthews SA, Hillemeier MM. White infant mortality in Appalachian states, 1976–1980 and 1996–2000: changing patterns and persistent disparities. J Rural Health. 2012;28:174–182. doi: 10.1111/j.1748-0361.2011.00385.x. [DOI] [PMC free article] [PubMed] [Google Scholar]
- 20.Ancelet S, Abellan JJ, Del Rio Vilas VJ, Birch C, Richardson S. Bayesian shared spatial-component models to combine and borrow strength across sparse disease surveillance sources. Biom J. 2012;54:385–404. doi: 10.1002/bimj.201000106. [DOI] [PubMed] [Google Scholar]
- 21.Best N, Hansell AL. Geographic variations in risk: adjusting for unmeasured confounders through joint modeling of multiple diseases. Epidemiology. 2009;20:400–410. doi: 10.1097/EDE.0b013e31819d90f9. [DOI] [PMC free article] [PubMed] [Google Scholar]
- 22.Lawson AB. Bayesian Disease Mapping: Hierarchical Modeling in Spatial Epidemiology. Boca Raton, FL: Taylor and Francis Group; 2009. [Google Scholar]
- 23.Mahaki B, Mehrabi Y, Kavousi A, et al. Multivariate disease mapping of seven prevalent cancers in Iran using a shared component model. Asian Pac J Cancer Prev. 2011;12:2353–2358. [PubMed] [Google Scholar]
- 24.MacNab YC. On Bayesian shared component disease mapping and ecological regression with errors in covariates. Stat Med. 2010;29:1239–1249. doi: 10.1002/sim.3875. [DOI] [PubMed] [Google Scholar]
- 25.Ibáñez-Beroiz B, Librero-López J, Peiró-Moreno S, Bernal-Delgado E. Shared component modelling as an alternative to assess geographical variations in medical practice: gender inequalities in hospital admissions for chronic diseases. BMC Med Res Methodol. 2011;11:172. doi: 10.1186/1471-2288-11-172. [DOI] [PMC free article] [PubMed] [Google Scholar]
- 26.Richardson S, Abellan JJ, Best N. Bayesian spatio-temporal analysis of joint patterns of male and female lung cancer risks in Yorkshire (UK) Stat Methods Med Res. 2006;15:385–407. doi: 10.1191/0962280206sm458oa. [DOI] [PubMed] [Google Scholar]
- 27.Wheeler DC, Waller LA, Elliott JO. Modeling epilepsy disparities among ethnic groups in Philadelphia, PA. Stat Med. 2008;27:4069–4085. doi: 10.1002/sim.3261. [DOI] [PMC free article] [PubMed] [Google Scholar]
- 28.Ibañez-Beroiz B, Librero J, Bernal-Delgado E, García-Armesto S, Villanueva-Ferragud S, Peiró S. Joint spatial modeling to identify shared patterns among chronic related potentially preventable hospitalizations. BMC Med Res Methodol. 2014;14:74. doi: 10.1186/1471-2288-14-74. [DOI] [PMC free article] [PubMed] [Google Scholar]
- 29.US Department of Health and Human Services. Healthy People 2020. Washington, DC: Government Printing Office; 2010. [Google Scholar]
- 30.Division of Vital Statistics, National Center for Health Statistics, Centers for Disease Control and Prevention, Department of Health and Human Services. User Guide to the 2011 Period Linked Birth/Infant Death Public Use File. Available at: ftp://ftp.cdc.gov/pub/Health_Statistics/NCHS/Dataset_Documentation/DVS/periodlinked/LinkPE11Guide.pdf. Accessed June 2, 2015.
- 31.Matthews TJ, MacDorman MF, Thoma ME. Infant mortality statistics from the 2013 period linked birth/infant death data set. Natl Vital Stat Rep. 2015;64:1–30. [PubMed] [Google Scholar]
- 32.Division of Vital Statistics, National Center for Health Statistics, Centers for Disease Control and Prevention, Department of Health and Human Services. User Guide to the 2011 Natality Public Use File. 2011. 2015 Oct 21; Available at: ftp://ftp.cdc.gov/pub/Health_Statistics/NCHS/Dataset_Documentation/DVS/natality/UserGuide2011.pdf. Accessed October 30, 2015.
- 33.Besag J, Kooperberg C. On conditional and intrinsic autoregressions. Biometrika. 1995;82:733–746. [Google Scholar]
- 34.Besag J, York J, Mollie A. Bayesian image restoration, with two applications in spatial statistics. Annals Institute Stat Math. 1991;43:1–20. [Google Scholar]
- 35.Knorr-Held L, Best NG. A shared component model for detecting joint and selective clustering of two diseases. J R Stat Soc A Stat. 2001;164:73–85. [Google Scholar]
- 36.ESRI. ArcGIS Desktop: Release 10. Redlands, CA: Environmental Systems Research Institute; 2011. [Google Scholar]
- 37.Lunn D, Spiegelhalter D, Thomas A, Best N. The BUGS project: evolution, critique and future directions (with discussion) Stat Med. 2009;28:3049–3082. doi: 10.1002/sim.3680. [DOI] [PubMed] [Google Scholar]
- 38.Brooks SP, Gelman A. General methods for monitoring convergence of iterative simulations. J Comput Graph Stat. 1998;7:434–455. [Google Scholar]
- 39.Spiegelhalter DJ, Best NG, Carlin BP, van der Linde A. Bayesian measures of model complexity and fit. J R Stat Soci Series B. 2002;64:583–639. [Google Scholar]
- 40.Howell EM, Richardson D, Ginsburg P, Foot B. Deregionalization of neonatal intensive care in urban areas. Am J Public Health. 2002;92:119–124. doi: 10.2105/ajph.92.1.119. [DOI] [PMC free article] [PubMed] [Google Scholar]
- 41.Krieger N, Rehkopf DH, Chen JT, Waterman PD, Marcelli E, Kennedy M. The fall and rise of US inequities in premature mortality: 1960–2002. PLoS Med. 2008;5:e46. doi: 10.1371/journal.pmed.0050046. [DOI] [PMC free article] [PubMed] [Google Scholar]
- 42.Allen MC, Alexander GR, Tompkins ME, Hulsey TC. Racial differences in temporal changes in newborn viability and survival by gestational age. Paediatr Perinat Epidemiol. 2000;14:152–158. doi: 10.1046/j.1365-3016.2000.00255.x. [DOI] [PubMed] [Google Scholar]
- 43.Ananth CV, Joseph KS, Oyelese Y, Demissie K, Vintzileos AM. Trends in preterm birth and perinatal mortality among singletons: United States, 1989 through 2000. Obstet Gynecol. 2005;105(5 pt 1):1084–1091. doi: 10.1097/01.AOG.0000158124.96300.c7. [DOI] [PubMed] [Google Scholar]
- 44.Demissie K, Rhoads GG, Ananth CV, et al. Trends in preterm birth and neonatal mortality among blacks and whites in the United States from 1989 to 1997. Am J Epidemiol. 2001;154:307–315. doi: 10.1093/aje/154.4.307. [DOI] [PubMed] [Google Scholar]
- 45.MacDorman MF, Matthews TJ, Mohangoo AD, Zeitlin J. International comparisons of infant mortality and related factors: United States and Europe, 2010. National Vital Statistics Reports, National Center for Health Statistics, National Vital Statistics System. 2014;63:1–6. [PubMed] [Google Scholar]
- 46.MacNab YC. On identification in Bayesian disease mapping and ecological-spatial regression models. Stat Methods Med Res. 2014;23:134–155. doi: 10.1177/0962280212447152. [DOI] [PubMed] [Google Scholar]
Associated Data
This section collects any data citations, data availability statements, or supplementary materials included in this article.