

Abstract
Few studies have been conducted to understand post-zygotic accumulation of mutations in cells of the healthy human body. We reprogrammed 32 skin fibroblast cells from families of donors into human induced pluripotent stem cell (hiPSC) lines. The clonal nature of hiPSC lines allows a high-resolution analysis of the genomes of the founder fibroblast cells without being confounded by the artifacts of single-cell whole-genome amplification. We estimate that on average a fibroblast cell in children has 1035 mostly benign mosaic SNVs. On average, 235 SNVs could be directly confirmed in the original fibroblast population by ultradeep sequencing, down to an allele frequency (AF) of 0.1%. More sensitive droplet digital PCR experiments confirmed more SNVs as mosaic with AF as low as 0.01%, suggesting that 1035 mosaic SNVs per fibroblast cell is the true average. Similar analyses in adults revealed no significant increase in the number of SNVs per cell, suggesting that a major fraction of mosaic SNVs in fibroblasts arises during development. Mosaic SNVs were distributed uniformly across the genome and were enriched in a mutational signature previously observed in cancers and in de novo variants and which, we hypothesize, is a hallmark of normal cell proliferation. Finally, AF distribution of mosaic SNVs had distinct narrow peaks, which could be a characteristic of clonal cell selection, clonal expansion, or both. These findings reveal a large degree of somatic mosaicism in healthy human tissues, link de novo and cancer mutations to somatic mosaicism, and couple somatic mosaicism with cell proliferation.
Genomic sequence variants may either be inherited (i.e., having arisen in the germline) or caused by mutations in somatic tissues. Somatic mosaicism, or the emergence of variation in the sequence or structure of the genome of somatic cells, has been detected in both normal and diseased cells (Youssoufian and Pyeritz 2002; De 2011; Frank 2014; Freed et al. 2014) and is believed to be the main cause of cancer (Failla 1958; Jacobs et al. 2012; Laurie et al. 2012; Fernández et al. 2016). However, the full extent and nature of somatic mosaicism in normal tissues is yet to be determined.
Emerging evidence suggests widespread genomic mosaicism in somatic cell lineages. Instances of somatic mosaicism have been shown to be present in the blood of monozygotic twins (Bruder et al. 2008) and throughout different tissues within an individual (Piotrowski et al. 2008; O'Huallachain et al. 2012). Moreover, 1%–5% of de novo variants were shown to be mosaic either in newborns or their parents (Campbell et al. 2014). A single mosaic SNV, when generating a constitutive active form of the gene AKT2 only in the brain, causes a severe form of megalencephaly with epilepsy (Poduri et al. 2012). Deep sequencing revealed somatic mosaic mutations in the blood of patients with developmental disabilities (King et al. 2015), and in general the existing studies point toward the amount of mosaic variations increasing with age (Vijg 2000; Jacobs et al. 2012; Laurie et al. 2012; Blokzijl et al. 2016). In our previous study, mosaic copy number variants (CNVs) in fibroblasts were discovered by comparing the genomes of clonal human induced pluripotent stem cell (hiPSC) lines and fibroblasts of origin (Abyzov et al. 2012). We estimated that ∼30% of skin fibroblast cells carry mosaic CNVs of various frequencies, ranging from 0.3% to 14.6% (Abyzov et al. 2012). Independently, mosaic CNVs were also observed in neurons (McConnell et al. 2013). However, systematic and comprehensive studies of mosaic SNVs are lagging behind, due to greater technical challenges associated with the detection of SNVs, such as sequencing errors often taking the form of single nucleotide changes, and the difficulty in distinguishing infrequent mosaic SNVs from germline SNPs. A study interrogating the genomes of single cells from adult human brains estimated approximately 2000 mosaic SNVs per neuron (when corrected for false discovery rate and sensitivity) (Lodato et al. 2015), but only a few dozen of such SNVs could be directly observed in brain tissue. Because that study relied on enzymatic amplification of genomic DNA (whole-genome amplification, WGA), which is known to introduce errors into the resulting amplified DNA (Leung et al. 2015), such estimation requires cross-validation with independent experimental approaches.
Here, we describe discovery and analysis of mosaic SNVs in fibroblast cells in four families, including two family trios (i.e., mother, father, and child), one family quartet (i.e., mother, father, and two children), and one family duo (i.e., father and child). With the aim of avoiding enzymatic genome amplification, we produced induced pluripotent stem cell (iPSC) lines—immortal cell lines clonally derived from single fibroblast cells. Thus, whole-genome sequencing (WGS) of each iPSC line provided sensitive insights into single fibroblast cell genomes, free of WGA artifacts. Further, the availability of parental genomes enabled us to exclude virtually all germline variants (except those mosaic variants in parents that are passed on to children), ensuring greater precision in our analysis of the frequency, signature, and distribution of mosaic variants in the fibroblast genome.
Genomes of human and mouse iPSCs have been previously compared multiple times to genomes of parental cells, and hundreds of genomic differences have been noted (Cheng et al. 2012; Young et al. 2012; Bhutani et al. 2016). Similarly, studies of mosaic mutations in various cell types by clonal expansion in mice identified hundreds of candidate mosaic variants (Behjati et al. 2014; Hazen et al. 2016). However, all of those studies provided no or only limited experimental evidence that some of the observed variants are mosaic in the population of original cells. The study by Gore et al. performed experimental validations for a number of variants but limited their discovery to the exome (Gore et al. 2011). In the present study, we not only discover candidate mosaic variants at the level of the whole genome but also conduct extensive validation experiments, demonstrating that the majority of discovered candidates represent genuine mosaic variants in the original fibroblast cells.
Results
Approach
For each person in the families included in this study we obtained skin fibroblast samples from the area of the upper inner arm (i.e., not exposed to the sun) and, using the canonical retroviral as well as episomal vectors, reprogrammed the fibroblast cells to produce three hiPSC lines per person (Fig. 1). In STAGE 1 (Fig. 1), we collected WGS data from hiPSCs and bulk fibroblasts and conducted analyses aimed at discovering mosaic variants present in fibroblasts and manifested in each hiPSC line. Comparing a given hiPSC genome with the germline genome of the matching individual allowed us to discover nongermline and putatively mosaic variants present in the founder fibroblast cell and, consequently, in all cells of the derived hiPSC line, irrespective of their presence in other fibroblast cells (Abyzov et al. 2012). A critical step during this comparative analysis is identifying and filtering out germline variants. Germline variants can be approximated by those variants shared by all or at least most fibroblast cells of the individual. Alternatively, as almost all germline variants in children (except for a small number of de novo variants) are inherited from parents, we used parental genomes for efficient recognition of germline variants. In fact, for finding mosaic variants, utilization of parental genomes is advantageous over comparing genomes of hiPSC lines against genomes of their fibroblasts of origin, as such a comparison would preclude the detection of mosaic variants that exist in fibroblasts at high tissue allele frequency (TAF). Additionally, germline variants can be recognized if found in the catalog of known germline variants such as the catalog produced by the 1000 Genomes Project (The 1000 Genomes Project Consortium 2015).
Figure 1.
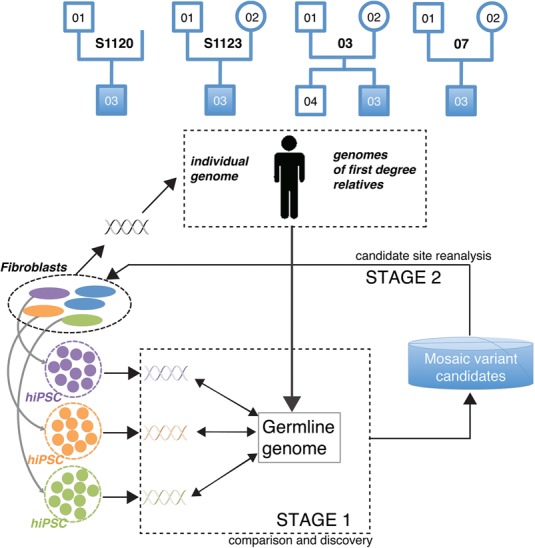
Conceptual diagram of our approach. Our cohort consisted of four families, each having a proband with autism, while the other family members were phenotypically normal. Family 03 includes a normal male sibling. Three hiPSC lines were generated from the fibroblast samples of each person in the cohort. As hiPSC lines are clonally derived from single cells, comparison (STAGE 1) of their genomes to the germline genome uncovers mosaic variants present in the founder fibroblast cells of hiPSC colonies (green, orange, and purple variants). Germline variants for children were inferred from corresponding parents and those for parents from corresponding children and fibroblast samples. Analysis at STAGE 1 yields a list of putative mosaic variants manifested in hiPSC lines. In STAGE 2, the mosaic candidates are scrutinized by additional experiments in founder fibroblasts to confirm their presence and to determine their tissue allele frequency (TAF). Naming pattern for hiPSC lines is as follows: family-person#hiPSC, e.g., S1120-01#2.
Besides mosaic variants, the genome of hiPSC lines may harbor genomic alterations generated during reprogramming or subsequent culturing. Additionally, there can be false positive calls. Therefore, all genomic differences observed between a given hiPSC line and the corresponding germline genomes must be considered to be putative mosaic variants only. We call these putative mosaic variants “line manifested variants” (LMVs) with “line manifested single nucleotide variants” (LM-SNVs) being a subset. We then applied orthogonal experimental techniques to estimate the false positive discovery rate in the source tissue (hiPSC lines) and found it to be low (see below). Following that, to confirm that LM-SNVs are indeed mosaic variants, in STAGE 2 (Fig. 1), we conducted in-depth reanalysis of candidate sites in fibroblast cells. Data collection and analyses in STAGE 2 aimed at finding the presence and precise TAF for only the LM-SNVs rather than for the whole genome.
LM-SNV discovery in children with data for both parents
To discover mosaic LM-SNVs in fibroblasts, we compared the genomes of hiPSC from four children to genomes of the corresponding parents (Supplemental Fig. S1, step 1). For one of the five children (1120-03) we had only data from one parent available, and it was therefore not included in this initial analysis. Next, we filtered out known germline SNVs by comparative analysis against the catalog of variants from the 1000 Genomes Project (Supplemental Fig. S1, step 2). Considering that SNVs present in the founder cells of hiPSC colonies should have 50% allele frequency in the hiPSC clones, we removed LM-SNVs that had <35% TAF for the alternative allele, as those are likely to be generated during culturing. One of the hiPSC lines from the proband of family 07 (i.e., 07-03#9) had a very large number of LM-SNV calls (Table 1) with a high false positive rate; these calls were excluded from further analyses. In the remaining nine hiPSCs analyzed, we discovered from 364 to 566 LM-SNVs (median 475 per hiPSC line) (Table 1; Supplemental Table S1), with sensitivity for heterozygous SNV discovery varying from 26% to 59% (median 37%). These LM-SNV sets were divided into high and low frequency subsets (yellow and orange bars in Fig. 2A) depending on whether we did or did not, respectively, find supporting evidence for them in the fibroblast sequence data (Supplemental Fig. S1, step 3).
Table 1.
Summary of discovered and projected germline SNPs and mosaic SNVs
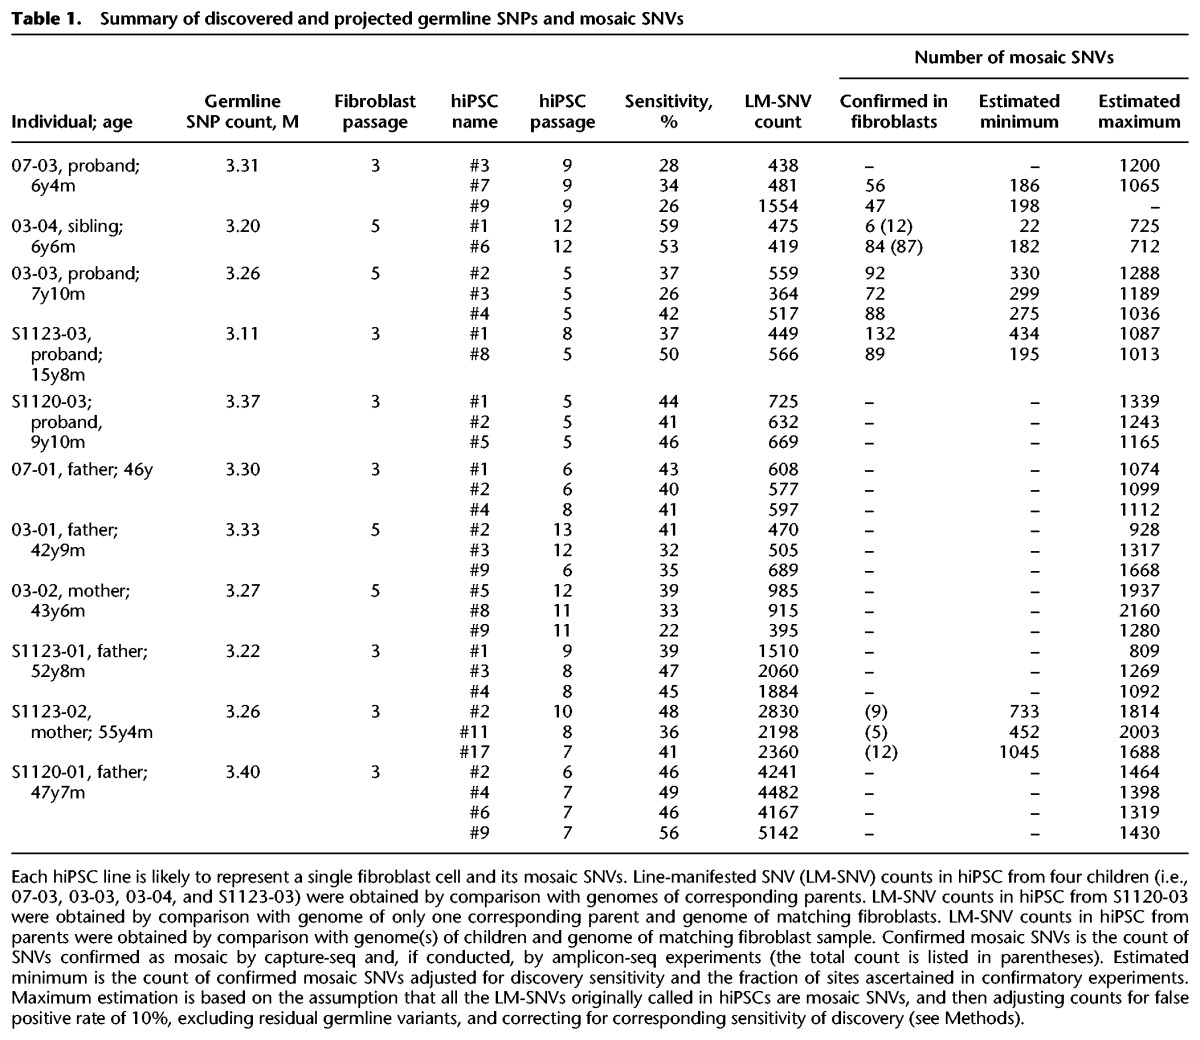
Figure 2.

Discovery and confirmation of LM-SNVs in children. (A) Discovered LM-SNVs in hiPSC lines were divided into two groups: low tissue allele frequency (with no evidence in fibroblasts, orange bars), and high TAF (with some evidence, yellow bars). Site reanalysis in fibroblasts with DNA capture and deep sequencing confirmed that, on average, 74 LM-SNVs in each hiPSC line are mosaic SNVs in fibroblasts (green bars) or 235 when adjusted for discovery sensitivity and ascertained fraction (light blue bars). (B) Virtually all LM-SNVs were present at around 50% AF in hiPSC lines as detected by amplicon-seq experiments. (C) Capture-seq experiment in fibroblasts revealed that mosaic SNVs were present in the fibroblast tissue with TAF ranging from 0.25% to 35%. Distributions of TAF have clear peaks. (D) Amplicon-seq experiment for 57 LM-SNVs sites results in better sensitivity and confirms an additional six LM-SNVs with low TAF as mosaic (black dots), including two with no supporting read in the data from capture (shown with TAF of 10−4 for capture). Germline and confirmed mosaic SNVs by capture experiments are in red and green circles, respectively. (E) ddPCR reactions revealed excellent concordance in TAF estimates with the capture-seq and amplicon-seq experiments. Dashed green bars show SNV sites for which capture experiments were conducted, but support for the alternative allele was consistent with background sequencing noise. Additional ddPCR assays confirmed mosaic SNV at even lower TAFs that could not be accessed by the other two experiments.
By validating >70 LM-SNV predictions in hiPSC with (1) target site amplification and resequencing (i.e., amplicon-seq) and (2) PCR amplification and Sanger sequencing of the PCR band (Supplemental Fig. S1, step 4), we estimated that SNV call sets have, in general, 10% false positive calls due to sequencing errors. Moreover, almost all LM-SNVs validated by amplicon-seq (i.e., 90%) had at least 100× coverage and nearly 50% allele frequency in hiPSC (Fig. 2B), strongly suggesting that they are not the result of hiPSC line culturing but rather were present in the founder cells of hiPSC colonies and thus represent mosaic SNVs in fibroblasts.
To confirm that LM-SNV calls were indeed mosaic and to accurately determine their TAFs, we conducted a comprehensive LM-SNV site re-evaluation in the fibroblast samples (Fig. 1, stage 2; Supplemental Fig. S1, step 5; Supplemental Fig. S2). For this, we designed capture oligomers for 6280 candidate LM-SNV sites discovered in the nine hiPSC lines, captured DNA from the four corresponding children's fibroblasts, and sequenced the captured DNA to a high depth of coverage, typically from 100× to 2000× (Supplemental Fig. S3). Based on these experiments, one of four conclusions was rendered for each LM-SNV: insufficient data, germline variant (likely de novo), mosaic variant, or inconclusive (these could still be mosaic variants with TAF below the detection limit) (see Fig. 2; Supplemental Methods). Except for hiPSC line 03-04#1, which has very few confirmed mosaic variants (Fig. 2A; Table 1), the final counts of confirmed mosaic sites were comparable across the cell lines: from 47 to 132 (median of 84 and average of 74) and (when adjusted for discovery sensitivity and the fraction of ascertained sites) from 182 to 434 (median of 198 and average of 235) (Table 1). The TAF of the mosaic variants ranged from 0.25% to 33.5% (Supplementary Fig. S4). Interestingly, in all four individuals the distribution of variants across the range of TAF was not continuous and had distinct narrow peaks (Fig. 2C). The peaks are likely to reflect clonal mitotic expansion of fibroblast cells, resulting in subpopulations of cells carrying SNVs with high values of TAF. Strong support for this interpretation comes from the fact that each of the two peaks in the TAF spectrum of the S1123-03 (offspring) fibroblasts represent SNVs found in separate and different hiPSC colonies, i.e., originating in different fibroblast cells (Supplemental Fig. S5).
In order to demonstrate that more sensitive assays would confirm more LM-SNVs as mosaic but with low TAF, we performed amplicon-seq experiments in fibroblasts of 03-04 for 57 LM-SNVs, which had passed the amplicon-seq validation in the hiPSC lines derived from these fibroblasts. Amplicon-seq (Supplemental Fig. S1, step 6) achieves very high sequencing coverage for the selected loci, typically ranging from 20,000× to 200,000× (Supplemental Fig. S6A). Additionally, the combination of longer reads and relatively short amplicons provides a means to reduce the substitution-dependent sequencing error rate to precisely determine mosaic variants (see Supplemental Methods; Supplemental Fig. S6B). We observed excellent agreement in TAF values derived from capture-seq and amplicon-seq (Fig. 2D). Notably, due to higher coverage, the latter confirmed an additional six SNVs as mosaic, including two with no reads supporting them in the data from capture. The TAFs of these SNVs were from 0.1% to 0.29%, indicating a roughly three times higher sensitivity for the amplicon-seq experiment.
Finally, we selected 28 SNVs and determined their TAF with digital droplet PCR (ddPCR)—a low-throughput but very sensitive and sequencing-independent technique. Nine SNVs were selected to establish concordance with capture and amplicon experiments, and 19 SNVs (five with predicted high TAF and 14 with predicted low TAF) not confirmed by capture experiment were selected randomly. We observed excellent agreement in TAF values measured by capture, amplicon, and ddPCR experiments, including for four SNVs which were deemed mosaic from amplicon data alone (Fig. 2E). Out of the 19 randomly selected SNVs tested by ddPCR, 12 were confirmed as mosaic; nine (64%) and three (60%) were among the low and high TAF sites, respectively, with TAF as small as 0.01%. Therefore, both amplicon and ddPCR experiments revealed that additional SNVs with smaller TAF can be confirmed as mosaic, suggesting that at least 60% of LM-SNVs represent mosaic SNVs in fibroblasts with TAF beyond the detection limit of the capture experiment.
These validations further strengthen our previous statement that all the LM-SNVs are likely to represent mosaic SNVs in fibroblasts. Based on this assumption, we estimated the maximum number of true mosaic SNVs in fibroblasts (see Methods). The maximum numbers ranged from 712 to 1288, with an average of 1035 and a median of 1065 of mosaic SNVs per cell (Table 1).
LM-SNV discovery in parents
Germline genomes of parents cannot be reconstructed from the genomes of their children alone, as not all variants are passed on to children. Thus, to call LM-SNVs, hiPSC lines from parents were compared against the genomes of their children and against matching fibroblasts, with filtering steps similar to those used in the children (see Supplemental Methods; Supplemental Table S2). The estimate of the maximum count of mosaic SNVs was also done in a similar way. These maximum counts ranged from 809 to 2160 per cell, with an average of 1413, which is 37% higher than the average maximum of mosaic SNVs in children (Table 1). However, this increase was comparable to the measurement error of 20% for SNV counts (see Supplemental Methods; Supplemental Tables S3, S4), suggesting that fibroblast cells from parents carry similar numbers of mosaic SNVs as fibroblasts from children do. As we compared six adults against four children, the average increase in SNV counts in parents may just be due to sampling. In fact, drastically higher SNV counts were observed for hiPSC lines from two mothers (03-02 and S1123-02). With their data excluded, the maximum SNV counts for hiPSCs from parents were within the expected overestimate, i.e., on average, 19% higher in parents.
With regard to confirmation experiments in the original fibroblast population, amplicon-seq in fibroblasts of S1123-02 confirmed 26 (out of 147) LM-SNVs as mosaic, a rate of 18%, which is within one standard deviation of the rate of 23% for fibroblast amplicon-seq confirmation for the previously analyzed child 03-04 (16 out of 69). In fact, the rates were almost the same (26% and 23%) when removing germline SNPs from the tested sets of SNVs. This suggests that the sensitivity of confirmation of mosaic SNVs by amplicon-seq is similar in children and parents. Furthermore, examination of confirmed mosaic SNVs in S1123-02 showed a similar TAF spectrum in children and parents, characterized by distinct narrow peaks (Supplemental Fig. S7), demonstrating that high TAF true mosaic SNVs are also present in parents.
Properties of mosaic SNV
For most of the following analyses we used SNV call sets for hiPSCs from children with both parents, as such sets are free of germline variants. First, we checked the reciprocal distance and distribution in the genome for confirmed mosaic SNVs and all mosaic SNVs. For both sets, the distribution of neighboring mosaic SNVs was consistent with uniform random placement across the genome, except for an increase in the occurrence of very closely spaced SNVs (separated by <20 bp) in both the set of confirmed and the set of all mosaic SNVs (P-value < 10−33 and < 0.02, respectively) (Fig. 3A). Subsets of dinucleotide substitutions account for most of the closely spaced SNVs in each set: 46% (93 out of 204) in the entire set and 78% (six out of eight) in the confirmed set. At least one dinucleotide substitution was confirmed with capture-seq in each child. As the TAFs of each SNV in confirmed dinucleotide substitutions were almost identical (different by, at most, 5%), it is likely that each dinucleotide substitution is a single mutational event. Moreover, four out of six confirmed dinucleotide substitutions were CC to TT (or GG to AA), which could be attributed to repair of DNA damage caused by UV radiation or oxygen free radicals (Reid and Loeb 1993). Interestingly, hiPSCs from parents typically revealed higher counts of such dinucleotide substitutions, with individual S1120-01 having 500–600 of them per hiPSC (Supplemental Fig. S8), partially explaining the larger LM-SNV call set for these lines. A majority of the dinucleotide sites for S1120-01 (71%, 684 of 969) were shared between at least two hiPSC lines, perhaps reflecting local clonality of fibroblasts in the skin biopsy from this individual. Across children, no mosaic SNV hotspots with genome-wide statistical significance (i.e., mutation hot spots) were found.
Figure 3.

(A) On a large scale, the distance between neighboring SNVs is distributed according to the power law, i.e., frequency decreases exponentially with increasing distance. This is consistent with a uniform distribution of SNVs across the genome (such simulated distributions are shown by dashed lines). There is an enrichment of short (i.e., <20 bp) distances (see inset). All data pertain to four children. (B) Distribution of trinucleotide motifs of the reference genome around SNVs defines mutational signature. The signature of mosaic SNVs is similar to signature 5 and signature 8 observed in cancers (Alexandrov et al. 2013). (C) Comparison of mutational signature in this study (solid bars) with signature 5 from cancers (empty bars).
Annotation of all mosaic SNV sets with the Variant Effect Predictor (VEP) (McLaren et al. 2010) based on the RefSeq annotation showed that 83% are likely benign SNVs located in intergenic and intron regions. An additional 11% of SNVs, which were intronic and intragenic variants, were predicted as having potential regulatory roles. The remaining 6% were located in coding and noncoding transcripts. Based on analysis of coding sequence and known splice sites, 32 SNVs of the mosaic exonic SNVs were predicted to have a high or moderate effect on genome function: four stop codon gains, two donor splice site mutations, and 26 missense SNVs (Supplemental Table S5). One stop mutation (in the SPON1 gene), one splice site SNV (in the PIGN gene), and four missense SNVs (in the ANO1, DSCAML1, SRGAP1, and SAMD9 genes) were confirmed by capture-seq with TAF ranging from 0.5% to 19.7%. Subsequently, we used FunSeq (Fu et al. 2014) to predict the effect of 4041 noncoding SNVs. Fourteen SNVs (three confirmed) were annotated as having an effect on regulation. The only recurrent gene affected by coding and noncoding SNVs was Rho GTPase activating protein 5 (ARHGAP5), with one missense, one stop, and one regulatory SNV. This gene is consistently expressed with an average high expression level of 6 RPKM in the analyzed fibroblasts, suggesting that either the identified mutations may give selective advantage to the affected cells or that the locus may constitute a mutational hotspot. We then asked more generally whether the LM-SNVs from the entire LM-SNV set are particularly associated with expressed genes and observed a marginally significant association (see Methods). Taken together, these analyses showed no significant enrichment of mosaic SNVs in coding, regulatory, or expressed regions.
The distribution of trinucleotide motifs around SNVs, i.e., the mutational signature, has been extensively analyzed in cancer (Alexandrov et al. 2013; Lawrence et al. 2013). Some of these mutational signatures are known to reflect mutational processes that exist in both normal and cancerous cells. We compared the mutation spectrum of mosaic SNVs in our fibroblast data sets to cancer mutational signatures. The largest Pearson's correlation was observed with mutational signatures 5 and 8 (correlation coefficients 0.7 and 0.66, respectively) (Fig. 3B), both of which have unknown underlying mutation mechanisms. When considering comprehensive combinations of two signatures, the largest correlation was 0.85 for the pair consisting of signature 5 (contributing 83%) and 18 (contributing 17%). Signature 5 provides the major contribution to the correlation (77%) when exhaustively considering combinations of three signatures. When considering the set of confirmed mosaic SNVs, the largest correlation (0.78) was with signature 7. However, for pairs and trios of signatures, the major contribution was again from signature 5 (76% and 47%, respectively), with signature 7 being the second contributor (24% and 22%, respectively). Therefore, we consistently observed signature 5 as the major contributor to the mutation spectrum of SNVs in fibroblasts (Fig. 3C). Finally, the observed enrichment of dinucleotide mutations in the spectrum supports the association with signature 5, which was described as having dinucleotide substitutions (Alexandrov et al. 2013).
Somatic SNVs in various cancers were shown to have strong negative correlation with prominent epigenomic marks, such that histone modifications and DNase hypersensitive sites can be used as good predictors of SNV density (Polak et al. 2015). Using published primary data, we replicated such correlations when comparing somatic SNVs in liver cancer with histone marks from primary liver cells and from hepatocellular carcinoma cells (Fig. 4A; Roadmap Epigenomics Consortium et al. 2015). Mosaic SNVs detected in our study exhibit the same correlation trend, i.e., negative correlations with the histone marks from skin fibroblasts (Roadmap Epigenomics Consortium et al. 2015). However, the absolute values of correlations are much lower (Fig. 4A). The only exception to this negative correlation is the H4K20me1 mark. Assuming that mosaic SNVs originated in fibroblast cells, this suggests that their properties resemble the properties of somatic SNVs found in cancers. In contrast, correlations of mosaic SNVs in fibroblasts with epigenetic marks from ESCs and hiPSCs were positive, albeit low in absolute values (Fig. 4; Supplemental Fig. S9). If mosaic SNVs occur in the blastocyst (i.e., in stem cells), this would imply that they possess properties different from somatic SNVs found in cancer cells.
Figure 4.

(A) Mosaic SNVs in fibroblasts (detected in this study) exhibit negative correlations (except for the H4K20me1 mark) with histone marks from skin fibroblasts (blue bars). This is similar to what was observed for somatic SNVs in liver cancer (external data set) with histone marks from hepatocytes (green) and hepatocellular carcinoma cell line (cyan). However, the absolute values of correlations are lower. Data for certain histone marks are not available, and the corresponding bars are not shown. In contrast, mosaic SNVs in fibroblasts correlate positively with histone marks in stem cells. Correlations for the H1 cell line are shown in red (see also Supplemental Fig. S9). (B) Example of correlation between density of mosaic SNVs in fibroblasts and two histone marks in fibroblasts.
Discussion
Somatic mutations in various cancers have been extensively studied, but little is known about somatic mosaic mutations in normal human tissues despite the essential need to study the latter in order to understand the former (Alexandrov et al. 2015). We estimate that a single fibroblast cell in children carries roughly 1000 mosaic SNVs, a number that is smaller but comparable to the estimate done by others for neurons (Lodato et al. 2015). However, radically different from what has been reported for neurons, mosaic SNVs in fibroblasts were not dominated by C > T transitions, were uniformly distributed across the genome and annotated genomic elements, were only marginally associated with transcribed genes, and exhibited opposite correlation values with histone marks in normal fibroblast tissue. Validation experiments demonstrated that variants created during culture are not likely to affect our estimate. We cannot completely rule out the possibility that some of the SNVs manifested in hiPSC colonies are derived from the reprogramming process, and thus the actual mosaic SNV count per cell is an overestimate. However, we demonstrated that typically 200 SNVs from each hiPSC colony could be directly observed in primary fibroblasts at low TAFs (<1%), and, using more sensitive confirmation methods, roughly an additional 60% of the remaining ones can also be observed in fibroblasts with even lower TAFs. Therefore, even if SNVs were created during reprogramming, they are unlikely to have a major effect on our estimate. These two direct estimates (ours and the one for neurons) are also comparable to the indirect estimate made from deep sequencing of cancer-related genes in skin (Martincorena et al. 2015). Our estimates are also consistent with the observed counts of genomic differences between clonally expanded lines and parental cells in other studies (Cheng et al. 2012; Young et al. 2012; Behjati et al. 2014; Bhutani et al. 2016; Hazen et al. 2016; Saini et al. 2016). The consistency in estimates also suggests that the use of hiPSCs from subjects with autism, as in our study, does not compromise the estimation of mutation counts. Based on the similarity of our experimental design with that in those studies, we suggest that all or most of variants identified by these earlier studies represent genuine mosaic variants. The much larger degree of mosaic SNVs as compared to de novo mutations suggests that their effect on health and disease could be higher than that of de novo variants.
Comparison between children and parents showed that cells in adults carry comparable numbers of SNVs, i.e., the variation is within experimental error. This likely reflects the fact that fibroblasts divide only rarely in adults except in situations of injury. Nevertheless, certain adults can have up to twofold more SNVs per cell, perhaps reflecting an environmental contribution to mutagenesis in fibroblasts. In support of this explanation, we found that adults, on average, had larger counts of dinucleotide CC > TT substitutions, likely resulting from UV damage, as has also been previously observed in skin exposed to sun radiation (Martincorena et al. 2015). The observed small amount of UV-associated DNA damage in the analyzed fibroblasts is expected, as fibroblast biopsies were collected from an area of the skin normally unexposed to the sun. Based on the finding that counts of mosaic SNVs per cell do not increase dramatically with age, we hypothesize that the majority of mosaic SNVs in fibroblasts are of a developmental origin, which is also supported by indirect evidence that they might occur during cell proliferation (see below).
We observed that the spectrum of mosaic SNVs was most similar to mutational signature 5, observed in de novo SNVs (Rahbari et al. 2016) and in virtually all cancers (Alexandrov et al. 2013) and observed to increase monotonically with subject age (Alexandrov et al. 2015). Such coincidence may not be surprising given that some de novo SNVs are actually mosaic variants in somatic tissues (Campbell et al. 2014; Rahbari et al. 2016). Convergence of mutation spectra in cancer, normal cells, and germline de novo variants confirms previous suggestions that normal background mutagenesis commonly occurring in somatic cells contributes to mutations leading to cancer (Tomasetti and Vogelstein 2015). Resemblance of mosaic SNVs to somatic cancer SNVs is also reflected by the negative correlation of the density of SNVs with histone marks in the cell of origin.
Based on the above, we propose that mutational signature 5 reflects normal cell proliferation. This signature was etiologically linked to deficiency in the ERCC2 gene and the nucleotide excision repair (NER) pathway in general (Kim et al. 2016). As a key gene in one of the major DNA repair pathways, ERCC2 is expressed in all tissues while its expression is altered throughout the cell cycle. The highest expression is reached in the middle of G1 phase, with very low expression observed in the beginning of G1 phase, middle of S phase, and middle of M phase (Gauthier et al. 2010). We therefore propose that fast-proliferating cells, having overall lower expression of ERCC2, are depleted in NER and tend to accumulate more NER-related mosaic SNVs as compared to post-mitotic cells. This is consistent with the observation that NER is maximally efficient in nondividing cells (Branzei and Foiani 2008) and with our observation that adults accumulate little additional SNVs in fibroblasts compared to children. Other signatures contributing to the spectrum of mosaic SNVs are signatures 8 and 18, which, in turn, are similar to signature 5. We speculate that all these signatures could represent different aspects of normal background mutations, perhaps influenced by the pace of cell division, endogenous epigenetic alterations (Perera et al. 2016; Sabarinathan et al. 2016), and accessibility of the genome to DNA damaging agents.
Unexpectedly, we discovered that many SNVs are present in fibroblast cell populations at high TAFs, up to 25%, already in cells from children; this phenomenon was not observed in previous studies (Lodato et al. 2015; Martincorena et al. 2015). This can be explained by SNVs occurring very early in development (e.g., during the first few cell divisions of the fertilized egg), by later local clonal expansion of fibroblast cells in the sampled skin, as was observed for multiple cell types (Blanpain and Simons 2013), or clonal expansion during fibroblast culture. While we do have strong evidence for fibroblasts clonal expansion (Supplemental Fig. S4A), the latter scenario is unlikely, as most clones were passaged only three times (Table 1). This leaves clonal expansion of fibroblast cells in the sampled skin as the most likely explanation. The resemblance of mosaic SNVs to somatic cancer SNVs and the correlation of SNV density with histone marks are consistent with the fibroblasts being the cells of origin for mosaic SNVs rather than early embryonic stem cells, supporting the theory of local in vivo clonal expansion. Such fine-grained analysis of the spectrum of mutational frequency was enabled by our strategy of analyzing single cells rather than sequencing bulk tissues (Martincorena et al. 2015) and by using familial trios rather than conducting cell-to-tissue comparison (Lodato et al. 2015), powering us to find mosaic variants at high frequency. We propose this design as an approach worth considering for future genomic mosaicism studies.
It is also crucial to note that we applied three different approaches for the confirmation of candidate mosaic variants in the primary tissue, allowing us to ascertain the advantages and disadvantages of each of the three methods. Capture-seq is the technique with the highest throughput and also is the most cost-effective on a per-site basis. However, while quite sensitive, it is not the most sensitive of the options at hand. ddPCR is the most sensitive but has the lowest throughput and the highest cost per site tested. Amplicon-seq's characteristics place it in between these two options. We suggest that a combination of ddPCR with either capture-seq or amplicon-seq is optimal for future studies.
Methods
Derivation of primary fibroblasts from skin biopsies and generation of hiPSC
We obtained a <3-mm-diameter skin punch biopsy from the inner area of the upper arm from each member of four families using standard techniques. Informed consent was obtained from each subject according to the regulations of the Institutional Review Board and Yale Center for Clinical Investigation at Yale University. Primary cultures of fibroblasts were derived using standard explant procedures (Park et al. 2008). hiPSCs were generated using the original retroviral approach (Takahashi et al. 2007) or by a viral-free episomal reprogramming method (Okita et al. 2011). hiPSC line derivation and characterization, as well as WGS data generation used in this study, have been previously described (Abyzov et al. 2012; Mariani et al. 2015).
Calling SNVs per sample and per person
Genome-wide coverage per line typically varied from 3× to 11×, but a few lines were sequenced to a coverage >20×. To estimate the sensitivities of our discovery effort, we combined data for all samples from the same person (i.e., for all hiPSC lines and fibroblasts), which yielded an individual genome coverage of 20× to 40×, allowing for efficient discovery of personal germline variants.
Illumina HiSeq reads for each sample were aligned to GRCh37 reference with BWA 0.5.9-r16 (Li and Durbin 2010). Duplicated reads were removed with SAMtools (Li et al. 2009). To call SNVs, GATK 2.6-4 (McKenna et al. 2010) was used to realign reads around likely indel locations, recalibrate base quality scores, and call SNVs in UnifiedGenotyper mode. Finally, we filtered SNVs by training on known SNPs from HapMap, dbSNP, and the 1000 Genomes Project. Alignment of reads to GRCh38 is not likely to change results as we estimated sensitivities of our discoveries and experimentally measured false positive rates of variant calling.
To call germline SNPs for each person, we combined sequencing coverage data for each derived hiPSC and fibroblast sample. With this pipeline, we discovered 3.1–3.4 million SNPs per person. Using these germline variants, we estimated the sensitivity of heterozygous germline variants discovery using only data for each individual hiPSC line. Since true mosaic variants manifested in an hiPSC clone will have, on average, the same allele frequency (i.e., 50% in cells of the clone) and coverage as heterozygous germline variants, this sensitivity estimate was projected to the discovery of mosaic SNV in each clone. The sensitivity varied from 22% to 59%, with a median of 41% (Table 1).
Calling LM-SNVs
We attempted calling of LM-SNVs in twelve hiPSC lines from four children (i.e., for 03-03, 03-04, 07-03, and S1123-03) by comparing their genomes with the genomes of both their corresponding parents. As reasoned above, such a strategy offers the advantage of filtering out germline SNPs while not missing high-frequency mosaic SNVs in children's fibroblasts (Supplemental Fig. S1, step 1). However, the large number of germline SNPs, together with the less than ideal sensitivity (i.e., below 100%), can impair the detection of several parental germline SNPs. The subset of such (undetected) SNPs inherited by the child can potentially be introduced as false positives in the candidate LM-SNV sets. Therefore, we used the catalog of known germline variants from the 1000 Genomes Project to additionally filter out germline SNPs to arrive at the final sets of LM-SNVs calls (Supplemental Fig. S1, step 2). Data for one cell line did not match the genome of the corresponding child and was not included in the analysis. One more line had insufficient coverage to call SNVs and was also excluded. Further details are given in the Supplemental Methods.
LM-SNV validation in hiPSCs of children
LM-SNVs were validated with target site amplification and resequencing (amplicon-seq) and with PCR and Sanger band sequencing in hiPSC lines where they were originally discovered. For the amplicon-seq experiment, we randomly selected 69 LM-SNVs found in hiPSC lines #1 and #6 from 03-04. For each site, we designed primers with MacVector such that primers flanked the sites and amplified a region up to 450 bp around it. After amplification around the sites, pooled DNA for all sites was sequenced with Illumina MiSeq using 2 × 300-bp reads. Further details are given in the Supplemental Methods.
Confirmation with targeted capture and resequencing in children fibroblasts
For 6280 candidate LM-SNVs sites (which included 5203 of the final set after filtering out germline variants in the catalog of the 1000 Genomes Project) discovered in the nine hiPSC lines: S1123-03#1, S1123-03#8, 03-03#2, 03-03#3, 03-03#4, 03-04#1, 03-04#6, 07-03#7, 07-03#9, we designed an Agilent SureSelectXT Custom 0.5- to 2.9-Mb library with standard array software provided by the company. For each of four fibroblast samples (S1123-03, 03-03, 03-04, and 07-03), we performed capture and library construction four times, then barcoded the libraries with a unique barcode for each person, pooled the DNA, and sequenced it with HiSeq. All the samples were processed in one batch, thus minimizing systematic inter-sample experimental variability. Reads for each sample were differentiated by barcode and aligned to the reference genome with BWA (Li and Durbin 2010). Further details are given in the Supplemental Methods.
Confirmation with target site amplification and resequencing in children's fibroblasts
The same 57 sites that were validated with amplicon-seq in hiPSC lines #1 and #6 from 03-04 were amplified using the same primers in the fibroblasts of 03-04. Amplified DNA was pooled and sequenced with MiSeq using 2 × 300-bp reads. As PCR primers were designed such that amplicons are never longer than 450 bp, paired reads coming from them will overlap in their 3′ end, allowing constructing one single genomic fragment, where sequencing errors in the overlapping parts can be corrected. Seventy-five percent of the target sites fell into such areas of overlap. Further details are given in the Supplemental Methods.
Confirmation with target site amplification and resequencing in parents’ fibroblasts
We randomly selected 147 LM-SNVs sites from call sets for three hiPSC lines from individual S1123-02. Primers were designed as for amplicon-seq experiment in children. Amplicon lengths were typically from 130 to 450 bp but never above 550 bp. Data generation and analysis were done exactly the same way as for the amplicon-seq experiment in children. Further details are given in the Supplemental Methods.
Confirmation with ddPCR
All ddPCR assays were prepared following the protocol as described in Hindson et al. (2013). For two SNVs, we were not able to optimize the assay. For all the 28 SNVs with an optimized assay, no signal was observed in the negative control, and the expected signal was observed in the positive control (Supplemental Figs. S10–S37). Further details are given in the Supplemental Methods.
Estimating the fraction of germline SNPs in LM-SNV
Let Ng be the number of germline SNPs in a person such that they are not present in the catalog of germline variants from the 1000 Genomes Project and have no supporting evidence in compared relative(s) (e.g., dropped out during sequencing) and no supporting evidence in fibroblasts. We will call it a set of hidden SNPs. Some of these SNPs will be discovered in hiPSC lines derived from the child's parent. Let S1, S2, and S3 be sensitivity of SNV discovery in the three hiPSC lines from the parent. Then, the chance of not finding a hidden SNP in any of the three hiPSC lines is P0 = (1 − S1)(1 − S2)(1 − S3). Similarly, the chance of finding a hidden SNP in only one of the three hiPSC lines is P1 = S1(1 − S2)(1 − S3) + (1 − S1) S2(1 − S3) + (1 − S1)(1 − S2) S3. Consequently, the chance of finding a hidden SNP in at least two hiPSC lines is P2,3 = 1 − P0 − P1 = 1 − (1 − S1)(1 − S2)(1 − S3)(S1/(1 − S1) + S2/(1 − S2) + S3/(1 − S3) + 1). By knowing the number N2,3 of SNPs found in at least two hiPSC lines, we can estimate Ng as N2,3/P2,3. Assuming the absence of high TAF mosaic SNVs in fibroblasts, we can estimate N2,3 by counting LM-SNV identical in at least two hiPSC lines. The presence of high TAF SNVs will lead to overestimation of N2,3 and, consequently, overestimation of Ng. However, the overestimate will typically be small, as we don't see a large number of high TAFs per individual, and even 25% TAF SNVs have only a 50% chance of being present in two or more hiPSC lines. The number of hidden SNPs in the set of LM-SNVs for the ith hiPSC line is then estimated as Si*N2,3/P2,3.
Estimating maximum and minimum numbers of mosaic SNVs per hiPSC
For hiPSC lines from children with two parents, the maximum number was estimated as where is the count of LM-SNVs per hiPSC line I, and 0.9 reflects a fraction of true calls in the LM-SNV call set inferred from validation. For all other hiPSC lines (for which comparison was done against only one relative, and counts of hidden germline SNPs are higher), the formula was The minimum number was estimated as where is the number of confirmed mosaic variants, and Di is the fraction of SNVs with sufficient data, i.e., the sum of confirmed, inconclusive, and germline.
Running VEP
We ran VEP (McLaren et al. 2016) using online tools with RefSeq transcripts as input and with selection of only one functional annotation per SNV. SNVs with predicted “MODERATE” and “HIGH” impact were selected as variants potentially having a functional effect.
Running FunSeq2
We ran FunSeq2 (Fu et al. 2014) using an online server with default options. Noncoding SNVs with impact score >2 (default is >1.5) were selected as variants potentially having a functional effect.
Comparing association of LM-SNVs with gene expression
Gene expression data for the fibroblasts originating from the same individuals were generated as a part of previous studies (Abyzov et al. 2012; Mariani et al. 2015). For each gene, the median expression level, across all the available individuals, was considered. Gene length data were estimated from the GENCODE v7 annotation, used for the expression data. LM-SNVs were associated with genes using FunSeq2 (Fu et al. 2014). A logistic regression analysis was then used to test for association between the LM-SNVs and the gene expression, considering gene length as a covariate. First, a full model including the interaction term between gene expression and gene length was tested. Then, where the interaction term was deemed as nonsignificant, a reduced model was tested.
Calculating correlations with mutational signatures
Mutational signatures were downloaded from ftp://ftp.sanger.ac.uk/pub/cancer/AlexandrovEtAl, and only those reported previously (Alexandrov et al. 2013) were utilized for analysis here. A custom Perl script was used to calculate frequencies of mosaic SNVs in all possible trinucleotide motifs surrounding the SNVs (Supplemental Scripts). Pearson's correlation coefficients between the normalized frequencies and the downloaded signatures were calculated using data analysis package ROOT (Brun and Rademakers 1997). Combinations of two and three signatures were constructed by exhaustive selection of all signature pairs and triplets, with exhaustive selections of contributions for each signature ranging from 0% to 100%.
Data access
The primary sequencing and validation amplicon-seq and capture-seq data from this study have been submitted to the NIH NIMH Data Archives (https://data-archive.nimh.nih.gov) under DOI 10.15154/1342749.
Supplementary Material
Acknowledgments
We thank the New York Genome Center and the Yale Genome Center for generating sequencing data. We also thank the Yale University Biomedical High Performance Computing Center and its support team (in particular, Robert Bjornson and Nicholas Carriero). We acknowledge funding from the National Institutes of Health (National Institute of Mental Health grant numbers R01MH100914, U01MH106876, R01MH089176, R21MH087879 to F.M.V. and National Cancer Institute grant number R03CA191421-01A1 to A.A.), the Simons Foundation, and the Center for Individualized Medicine at the Mayo Clinic.
Footnotes
[Supplemental material is available for this article.]
Article published online before print. Article, supplemental material, and publication date are at http://www.genome.org/cgi/doi/10.1101/gr.215517.116.
References
- The 1000 Genomes Project Consortium. 2015. A global reference for human genetic variation. Nature 526: 68–74. [DOI] [PMC free article] [PubMed] [Google Scholar]
- Abyzov A, Mariani J, Palejev D, Zhang Y, Haney MS, Tomasini L, Ferrandino AF, Rosenberg Belmaker LA, Szekely A, Wilson M, et al. 2012. Somatic copy number mosaicism in human skin revealed by induced pluripotent stem cells. Nature 492: 438–442. [DOI] [PMC free article] [PubMed] [Google Scholar]
- Alexandrov LB, Nik-Zainal S, Wedge DC, Aparicio SAJR, Behjati S, Biankin AV, Bignell GR, Bolli N, Borg A, Børresen-Dale A-L, et al. 2013. Signatures of mutational processes in human cancer. Nature 500: 415–421. [DOI] [PMC free article] [PubMed] [Google Scholar]
- Alexandrov LB, Jones PH, Wedge DC, Sale JE, Campbell PJ, Nik-Zainal S, Stratton MR. 2015. Clock-like mutational processes in human somatic cells. Nat Genet 47: 1402–1407. [DOI] [PMC free article] [PubMed] [Google Scholar]
- Behjati S, Huch M, van Boxtel R, Karthaus W, Wedge DC, Tamuri AU, Martincorena I, Petljak M, Alexandrov LB, Gundem G, et al. 2014. Genome sequencing of normal cells reveals developmental lineages and mutational processes. Nature 513: 422–425. [DOI] [PMC free article] [PubMed] [Google Scholar]
- Bhutani K, Nazor KL, Williams R, Tran H, Dai H, Džakula Ž, Cho EH, Pang AWC, Rao M, Cao H, et al. 2016. Whole-genome mutational burden analysis of three pluripotency induction methods. Nat Commun 7: 10536. [DOI] [PMC free article] [PubMed] [Google Scholar]
- Blanpain C, Simons BD. 2013. Unravelling stem cell dynamics by lineage tracing. Nat Rev Mol Cell Biol 14: 489–502. [DOI] [PubMed] [Google Scholar]
- Blokzijl F, de Ligt J, Jager M, Sasselli V, Roerink S, Sasaki N, Huch M, Boymans S, Kuijk E, Prins P, et al. 2016. Tissue-specific mutation accumulation in human adult stem cells during life. Nature 538: 260–264. [DOI] [PMC free article] [PubMed] [Google Scholar]
- Branzei D, Foiani M. 2008. Regulation of DNA repair throughout the cell cycle. Nat Rev Mol Cell Biol 9: 297–308. [DOI] [PubMed] [Google Scholar]
- Bruder CEG, Piotrowski A, Gijsbers AACJ, Andersson R, Erickson S, Diaz de Ståhl T, Menzel U, Sandgren J, Tell von D, Poplawski A, et al. 2008. Phenotypically concordant and discordant monozygotic twins display different DNA copy-number-variation profiles. Am J Hum Genet 82: 763–771. [DOI] [PMC free article] [PubMed] [Google Scholar]
- Brun R, Rademakers F. 1997. ROOT—an object oriented data analysis framework. Nucl Instrum Methods Phys Res A 389: 81–86. [Google Scholar]
- Campbell IM, Yuan B, Robberecht C, Pfundt R, Szafranski P, McEntagart ME, Nagamani SCS, Erez A, Bartnik M, Wiśniowiecka-Kowalnik B, et al. 2014. Parental somatic mosaicism is underrecognized and influences recurrence risk of genomic disorders. Am J Hum Genet 95: 173–182. [DOI] [PMC free article] [PubMed] [Google Scholar]
- Cheng L, Hansen NF, Zhao L, Du Y, Zou C, Donovan FX, Chou B-K, Zhou G, Li S, Dowey SN, et al. 2012. Low incidence of DNA sequence variation in human induced pluripotent stem cells generated by nonintegrating plasmid expression. Cell Stem Cell 10: 337–344. [DOI] [PMC free article] [PubMed] [Google Scholar]
- De S. 2011. Somatic mosaicism in healthy human tissues. Trends Genet 27: 217–223. [DOI] [PubMed] [Google Scholar]
- Failla G. 1958. The aging process and cancerogenesis. Ann N Y Acad Sci 71: 1124–1140. [DOI] [PubMed] [Google Scholar]
- Fernández LC, Torres M, Real FX. 2016. Somatic mosaicism: on the road to cancer. Nat Rev Cancer 16: 43–55. [DOI] [PubMed] [Google Scholar]
- Frank SA. 2014. Somatic mosaicism and disease. Curr Biol 24: R577–R581. [DOI] [PubMed] [Google Scholar]
- Freed D, Stevens EL, Pevsner J. 2014. Somatic mosaicism in the human genome. Genes (Basel) 5: 1064–1094. [DOI] [PMC free article] [PubMed] [Google Scholar]
- Fu Y, Liu Z, Lou S, Bedford J, Mu XJ, Yip KY, Khurana E, Gerstein M. 2014. FunSeq2: a framework for prioritizing noncoding regulatory variants in cancer. Genome Biol 15: 480. [DOI] [PMC free article] [PubMed] [Google Scholar]
- Gauthier NP, Jensen LJ, Wernersson R, Brunak S, Jensen TS. 2010. Cyclebase.org: version 2.0, an updated comprehensive, multi-species repository of cell cycle experiments and derived analysis results. Nucleic Acids Res 38: D699–D702. [DOI] [PMC free article] [PubMed] [Google Scholar]
- Gore A, Li Z, Fung H-L, Young JE, Agarwal S, Antosiewicz-Bourget J, Canto I, Giorgetti A, Israel MA, Kiskinis E, et al. 2011. Somatic coding mutations in human induced pluripotent stem cells. Nature 471: 63–67. [DOI] [PMC free article] [PubMed] [Google Scholar]
- Hazen JL, Faust GG, Rodriguez AR, Ferguson WC, Shumilina S, Clark RA, Boland MJ, Martin G, Chubukov P, Tsunemoto RK, et al. 2016. The complete genome sequences, unique mutational spectra, and developmental potency of adult neurons revealed by cloning. Neuron 89: 1223–1236. [DOI] [PMC free article] [PubMed] [Google Scholar]
- Hindson CM, Chevillet JR, Briggs HA, Gallichotte EN, Ruf IK, Hindson BJ, Vessella RL, Tewari M. 2013. Absolute quantification by droplet digital PCR versus analog real-time PCR. Nat Methods 10: 1003–1005. [DOI] [PMC free article] [PubMed] [Google Scholar]
- Jacobs KB, Yeager M, Zhou W, Wacholder S, Wang Z, Rodríguez-Santiago B, Hutchinson A, Deng X, Liu C, Horner M-J, et al. 2012. Detectable clonal mosaicism and its relationship to aging and cancer. Nat Genet 44: 651–658. [DOI] [PMC free article] [PubMed] [Google Scholar]
- Kim J, Mouw KW, Polak P, Braunstein LZ, Kamburov A, Tiao G, Kwiatkowski DJ, Rosenberg JE, Van Allen EM, D'Andrea AD, et al. 2016. Somatic ERCC2 mutations are associated with a distinct genomic signature in urothelial tumors. Nat Genet 48: 600–606. [DOI] [PMC free article] [PubMed] [Google Scholar]
- King DA, Jones WD, Crow YJ, Dominiczak AF, Foster NA, Gaunt TR, Harris J, Hellens SW, Homfray T, Innes J, et al. 2015. Mosaic structural variation in children with developmental disorders. Hum Mol Genet 24: 2733–2745. [DOI] [PMC free article] [PubMed] [Google Scholar]
- Laurie CC, Laurie CA, Rice K, Doheny KF, Zelnick LR, McHugh CP, Ling H, Hetrick KN, Pugh EW, Amos C, et al. 2012. Detectable clonal mosaicism from birth to old age and its relationship to cancer. Nat Genet 44: 642–650. [DOI] [PMC free article] [PubMed] [Google Scholar]
- Lawrence MS, Stojanov P, Polak P, Kryukov GV, Cibulskis K, Sivachenko A, Carter SL, Stewart C, Mermel CH, Roberts SA, et al. 2013. Mutational heterogeneity in cancer and the search for new cancer-associated genes. Nature 499: 214–218. [DOI] [PMC free article] [PubMed] [Google Scholar]
- Leung ML, Wang Y, Waters J, Navin NE. 2015. SNES: single nucleus exome sequencing. Genome Biol 16: 55. [DOI] [PMC free article] [PubMed] [Google Scholar]
- Li H, Durbin R. 2010. Fast and accurate long read alignment with Burrows–Wheeler transform. Bioinformatics 26: 589–595. [DOI] [PMC free article] [PubMed] [Google Scholar]
- Li H, Handsaker B, Wysoker A, Fennell T, Ruan J, Homer N, Marth G, Abecasis G, Durbin R, 1000 Genome Project Data Processing Subgroup. 2009. The Sequence Alignment/Map format and SAMtools. Bioinformatics 25: 2078–2079. [DOI] [PMC free article] [PubMed] [Google Scholar]
- Lodato MA, Woodworth MB, Lee S, Evrony GD, Mehta BK, Karger A, Lee S, Chittenden TW, D'Gama AM, Cai X, et al. 2015. Somatic mutation in single human neurons tracks developmental and transcriptional history. Science 350: 94–98. [DOI] [PMC free article] [PubMed] [Google Scholar]
- Mariani J, Coppola G, Zhang P, Abyzov A, Provini L, Tomasini L, Amenduni M, Szekely A, Palejev D, Wilson M, et al. 2015. FOXG1-dependent dysregulation of GABA/glutamate neuron differentiation in autism spectrum disorders. Cell 162: 375–390. [DOI] [PMC free article] [PubMed] [Google Scholar]
- Martincorena I, Roshan A, Gerstung M, Ellis P, Van Loo P, McLaren S, Wedge DC, Fullam A, Alexandrov LB, Tubio JM, et al. 2015. Tumor evolution. High burden and pervasive positive selection of somatic mutations in normal human skin. Science 348: 880–886. [DOI] [PMC free article] [PubMed] [Google Scholar]
- McConnell MJ, Lindberg MR, Brennand KJ, Piper JC, Voet T, Cowing-Zitron C, Shumilina S, Lasken RS, Vermeesch JR, Hall IM, et al. 2013. Mosaic copy number variation in human neurons. Science 342: 632–637. [DOI] [PMC free article] [PubMed] [Google Scholar]
- McKenna A, Hanna M, Banks E, Sivachenko A, Cibulskis K, Kernytsky A, Garimella K, Altshuler D, Gabriel S, Daly M, et al. 2010. The Genome Analysis Toolkit: a MapReduce framework for analyzing next-generation DNA sequencing data. Genome Res 20: 1297–1303. [DOI] [PMC free article] [PubMed] [Google Scholar]
- McLaren W, Pritchard B, Rios D, Chen Y, Flicek P, Cunningham F. 2010. Deriving the consequences of genomic variants with the Ensembl API and SNP Effect Predictor. Bioinformatics 26: 2069–2070. [DOI] [PMC free article] [PubMed] [Google Scholar]
- McLaren W, Gil L, Hunt SE, Riat HS, Ritchie GRS, Thormann A, Flicek P, Cunningham F. 2016. The Ensembl Variant Effect Predictor. Genome Biol 17: 122. [DOI] [PMC free article] [PubMed] [Google Scholar]
- O'Huallachain M, Karczewski KJ, Weissman SM, Urban AE, Snyder MP. 2012. Extensive genetic variation in somatic human tissues. Proc Natl Acad Sci 109: 18018–18023. [DOI] [PMC free article] [PubMed] [Google Scholar]
- Okita K, Matsumura Y, Sato Y, Okada A, Morizane A, Okamoto S, Hong H, Nakagawa M, Tanabe K, Tezuka K-I, et al. 2011. A more efficient method to generate integration-free human iPS cells. Nat Methods 8: 409–412. [DOI] [PubMed] [Google Scholar]
- Park I-H, Lerou PH, Zhao R, Huo H, Daley GQ. 2008. Generation of human-induced pluripotent stem cells. Nat Protoc 3: 1180–1186. [DOI] [PubMed] [Google Scholar]
- Perera D, Poulos RC, Shah A, Beck D, Pimanda JE, Wong JWH. 2016. Differential DNA repair underlies mutation hotspots at active promoters in cancer genomes. Nature 532: 259–263. [DOI] [PubMed] [Google Scholar]
- Piotrowski A, Bruder CEG, Andersson R, Diaz de Ståhl T, Menzel U, Sandgren J, Poplawski A, Tell von D, Crasto C, Bogdan A, et al. 2008. Somatic mosaicism for copy number variation in differentiated human tissues. Hum Mutat 29: 1118–1124. [DOI] [PubMed] [Google Scholar]
- Poduri A, Evrony GD, Cai X, Elhosary PC, Beroukhim R, Lehtinen MK, Hills LB, Heinzen EL, Hill A, Hill RS, et al. 2012. Somatic activation of AKT3 causes hemispheric developmental brain malformations. Neuron 74: 41–48. [DOI] [PMC free article] [PubMed] [Google Scholar]
- Polak P, Karlić R, Koren A, Thurman R, Sandstrom R, Lawrence MS, Reynolds A, Rynes E, Vlahovicek K, Stamatoyannopoulos JA, et al. 2015. Cell-of-origin chromatin organization shapes the mutational landscape of cancer. Nature 518: 360–364. [DOI] [PMC free article] [PubMed] [Google Scholar]
- Rahbari R, Wuster A, Lindsay SJ, Hardwick RJ, Alexandrov LB, Turki Al S, Dominiczak A, Morris A, Porteous D, Smith B, et al. 2016. Timing, rates and spectra of human germline mutation. Nat Genet 48: 126–133. [DOI] [PMC free article] [PubMed] [Google Scholar]
- Reid TM, Loeb LA. 1993. Tandem double CC→TT mutations are produced by reactive oxygen species. Proc Natl Acad Sci 90: 3904–3907. [DOI] [PMC free article] [PubMed] [Google Scholar]
- Roadmap Epigenomics Consortium, Kundaje A, Meuleman W, Ernst J, Bilenky M, Yen A, Heravi-Moussavi A, Kheradpour P, Zhang Z, Wang J, et al. 2015. Integrative analysis of 111 reference human epigenomes. Nature 518: 317–330. [DOI] [PMC free article] [PubMed] [Google Scholar]
- Sabarinathan R, Mularoni L, Deu-Pons J, Gonzalez-Perez A, Lopez-Bigas N. 2016. Nucleotide excision repair is impaired by binding of transcription factors to DNA. Nature 532: 264–267. [DOI] [PubMed] [Google Scholar]
- Saini N, Roberts SA, Klimczak LJ, Chan K, Grimm SA, Dai S, Fargo DC, Boyer JC, Kaufmann WK, Taylor JA, et al. 2016. The impact of environmental and endogenous damage on somatic mutation load in human skin fibroblasts. PLoS Genet 12: e1006385. [DOI] [PMC free article] [PubMed] [Google Scholar]
- Takahashi K, Tanabe K, Ohnuki M, Narita M, Ichisaka T, Tomoda K, Yamanaka S. 2007. Induction of pluripotent stem cells from adult human fibroblasts by defined factors. Cell 131: 861–872. [DOI] [PubMed] [Google Scholar]
- Tomasetti C, Vogelstein B. 2015. Cancer etiology. Variation in cancer risk among tissues can be explained by the number of stem cell divisions. Science 347: 78–81. [DOI] [PMC free article] [PubMed] [Google Scholar]
- Vijg J. 2000. Somatic mutations and aging: a re-evaluation. Mutat Res 447: 117–135. [DOI] [PubMed] [Google Scholar]
- Young MA, Larson DE, Sun C-W, George DR, Ding L, Miller CA, Lin L, Pawlik KM, Chen K, Fan X, et al. 2012. Background mutations in parental cells account for most of the genetic heterogeneity of induced pluripotent stem cells. Cell Stem Cell 10: 570–582. [DOI] [PMC free article] [PubMed] [Google Scholar]
- Youssoufian H, Pyeritz RE. 2002. Mechanisms and consequences of somatic mosaicism in humans. Nat Rev Genet 3: 748–758. [DOI] [PubMed] [Google Scholar]
Associated Data
This section collects any data citations, data availability statements, or supplementary materials included in this article.