

Abstract
Gene expression is dependent on genetic and environmental factors. In the last decade, a large body of research has significantly improved our understanding of the genetic architecture of gene expression. However, it remains unclear whether genetic effects on gene expression remain stable over time. Here, we show, using longitudinal whole-blood gene expression data from a twin cohort, that the genetic architecture of a subset of genes is unstable over time. In addition, we identified 2213 genes differentially expressed across time points that we linked with aging within and across studies. Interestingly, we discovered that most differentially expressed genes were affected by a subset of 77 putative causal genes. Finally, we observed that putative causal genes and down-regulated genes were affected by a loss of genetic control between time points. Taken together, our data suggest that instability in the genetic architecture of a subset of genes could lead to widespread effects on the transcriptome with an aging signature.
Gene expression is regulated by genetic effects and environmental factors (Brem et al. 2002; Cheung et al. 2003; Morley et al. 2004; Grundberg et al. 2012). A large number of studies have investigated the effect of genetics on gene expression (expression quantitative trait loci studies, eQTLs) and discovered that most genes are affected by at least one eQTL in at least one tissue (Albert and Kruglyak 2015; The GTEx Consortium 2015). However, eQTLs’ effects are not always consistent across tissues, as some eQTLs can be present in one tissue but absent in another tissue, while other eQTLs might be active in several tissues but have different effect sizes (Dimas et al. 2009; Grundberg et al. 2012; The GTEx Consortium 2015; Gutierrez-Arcelus et al. 2015). Variability in eQTL effects was also observed within the same tissue upon environmental challenges, such as addition of proinflammatory oxidized phospholipids to the cell culture medium (Romanoski et al. 2010) or of interferon-gamma and endotoxins (Fairfax et al. 2014). Furthermore, the effect of different drugs was found to elicit genotype-specific response on gene expression for a small number of genes (Grundberg et al. 2011; Maranville et al. 2011). Altogether, the emerging picture is that a large number of genetic variants have conditional effects on gene expression, which depend on the tissue, the environment, and the presence of other genetic variants (Brown et al. 2014; Buil et al. 2015).
As individuals age, they are subject to many environmental challenges, as well as to not well-understood molecular processes (López-Otín et al. 2013), which ultimately leads to an increase in the probability of death. A few cross-sectional studies have investigated the effect of age on the genetic regulation of gene expression and discovered that some cis-eQTLs have age-dependent effects in human (Kent et al. 2012; Glass et al. 2013; Yao et al. 2014), as well as in Caenorhabditis elegans (Viñuela et al. 2010). However, a complete picture of the effect of time on the genetic architecture of gene expression is still lacking. Here, we show, using longitudinal RNA-seq data in a twin cohort, that a small fraction of genes is affected by unstable genetic effects over two time points, which leads to a widespread transcriptomic effect with an aging signature.
Results
Study design
We used RNA-seq to measure whole-blood gene expression longitudinally at two time points separated, on average, by 22 months (Supplemental Fig. S1B). We obtained gene expression quantifications for 22 monozygotic (MZ) twin pairs at time point 1 (22 at time point 2), 26 (28) dizygotic (DZ) twin pairs, and 18 (18) unrelated individuals, resulting in a total of ∼18,000 genes quantified in 232 samples. We used CIBERSORT (Newman et al. 2015) to estimate the relative proportions of 22 immune cell types in our 232 samples. After multiple-testing correction, we did not observe any differences in cell-type proportions between the two time points (Supplemental Fig. S2). Furthermore, principal component analysis on the normalized gene expression matrix did not identify any systematic bias between the two time points (Supplemental Fig. S3). Samples were also genotyped and imputed to the 1000 Genomes Project Phase 1 reference panel (The 1000 Genomes Project Consortium 2012), resulting in information on 4 million single nucleotide polymorphisms (SNPs) in 217 samples.
Differential gene expression over time
We found that 2213 genes (1% false discovery rate, FDR) were differentially expressed between the two time points (1253 down-regulated and 960 up-regulated) (Supplemental Table S1). Interestingly, we observed that 84% of the differentially expressed genes were affected by age in the same direction (jointly modeled) (P value < 2.2 × 10⁻¹⁶) (Supplemental Fig. S4). In addition, we estimated that at least 79% of our differentially expressed genes were associated with aging using summary statistics from a recent large-scale cross-sectional study of age-related effect on gene expression in human peripheral blood (Supplemental Fig. S5; Peters et al. 2015). Although we observed substantial overlap in genes affected by time and age across studies, only 61.3% of the time differentially expressed genes also associated with age in the Peters et al. (2015) study (5% FDR) were affected in the same direction (P value = 2.7 × 10⁻¹⁴). Another interesting observation was that genes located on the mitochondrial genome were five times more likely to be differentially expressed than autosomal genes (FDR < 5%). We then aimed to identify a subset of differentially expressed genes at the core of the differences between the two time points. We used Bayesian networks to detect temporal regulatory relationships between all pairs of differentially expressed genes. This analysis resulted in the detection of 216 genes (181 down-regulated and 35 up-regulated) having a putative causal effect on the expression of a total of 2053 unique genes. Moreover, 77 genes (63 down-regulated and 14 up-regulated) were primary putative causal, as any other differentially expressed gene did not have a putative causal effect on their expression. These 77 genes affected a large number of genes, with a median of 655 genes affected per gene (Supplemental Fig. S6). Altogether, we found that a large number of genes were differentially expressed between the two time points and that they were largely affected in the same direction by age and have identified genes at the core of the observed differences.
Stability of the components of gene expression
In order to quantify the stability of gene expression levels among individuals, we measured the correlation of gene expression for each gene between the two time points. We found that gene expression was moderately correlated with a mean correlation of 0.33 (Fig. 1A). We then aimed to disentangle the role of additive genetic effects, the common environment (nongenetic effects which are shared by family members), and the unique environment (nongenetic effects specific to an individual) on the correlation of gene expression. As expected, we observed that additive genetic effects on gene expression were extremely stable between the two time points (median genetic correlation = 1, 95% confidence interval = [1; 1]) (Fig. 1B). However, we found that 273 genes had a genetic correlation significantly different from 1, indicating that genetic effects changed for those genes (Supplemental Table S1). As expected, given the large genetic correlation of most genes, we found that the most significant cis-eQTLs per gene (801/794 at the first/second time point, FDR = 5%) were highly shared between the two time points (π1 = 92%–100%). The effect of the common environment was moderately positively correlated between the two time points (median = 0.53, 95% confidence interval = [0.25; 0.87]) (Fig. 1C), while the effect of the unique environment was weakly correlated (median = 0.15, 95% confidence interval = [0.08; 0.24]) (Fig. 1D). Interestingly, genes with a high correlation of the unique environment (ρE > 0.5) were enriched in immune-related GO terms (Supplemental Table S2). Overall, we found that genome-wide genetic effects on gene expression were much more stable than environmental effects and that a subset of genes was affected by different genetic effects between the two time points.
Figure 1.
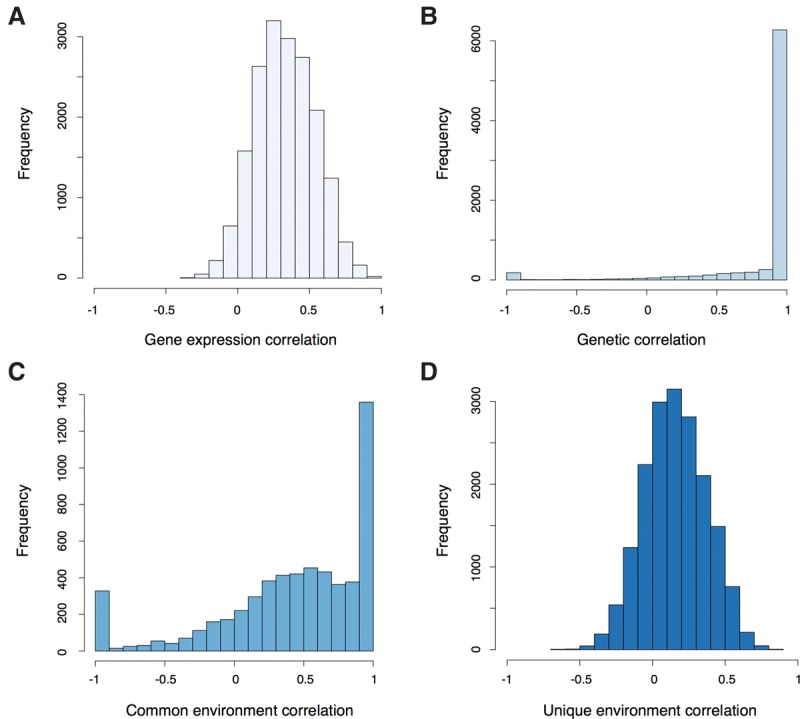
(A) Gene expression correlations between the first and second time points (unrelated individuals). (B) Genetic correlations between the first and second time points (genes with heritability >10%). (C) Common environment correlations between the first and second time points (genes with a proportion of the total variance due to the common environment >10%). (D) Unique environment correlations between the first and second time points.
Differences in heritability between time points
The expression of the majority of the genes is heritable (Gaffney 2013). As heritability is the ratio of genetic variance over the total variance, any changes in genetic and environmental variance can affect the heritability of a gene (Visscher et al. 2008). In order to assess whether heritability was stable between the two time points, we measured heritability at the first and second time point. We found a mean heritability of gene expression of 0.22 at the first time point (95% confidence interval = [0.17; 0.29]) (Supplemental Fig. S7A) and that 1858 genes had heritability significantly different from 0. We found, on average, lower heritability at the second time point, with a mean heritability of 0.15 (95% confidence interval = [0.10; 0.25]) (Supplemental Fig. S7B) and 981 genes with heritability significantly different from 0. However, the difference in mean heritability between the second and first time point was not statistically significant (−0.07, 95% confidence interval = [−0.12; 0.05]). At the single gene level, we found that 68 genes had significantly higher heritability at the second time point and 393 had significantly lower heritability (Supplemental Fig. S7C). Interestingly, we observed a significant decrease in heritability for genes that we detected as primary putative causal in the differential expression analysis (77 genes; mean of the difference in h2 = −0.25, 95% confidence interval = [−0.02; −0.33]) and for down-regulated genes (1253 genes; mean of the difference in h2 = −0.25, 95% confidence interval = [−0.06; −0.29]) (Fig. 2A), indicating a decrease in the relative contribution of genetics on the variance in gene expression for these genes. A decrease in heritability could be due to an increase in environmental variance (leading to more total variance), a decrease in the genetic variance (leading to less total variance), or a combination of both (leading to a decrease or an increase in total variance). We observed that the total variance was, on average, lower at the second time point (Supplemental Fig. S8), suggesting that the lower heritability at the second time point is not due to an increase in environmental (technical) variability.
Figure 2.

(A) Difference in heritability between the first and second time point for up-regulated genes, down-regulated genes, primary putative causal genes, and not differentially expressed genes. (B) Heritability of the change for up-regulated genes, down-regulated genes, primary putative causal genes, and not differentially expressed genes.
Heritability of the change in gene expression
We then asked whether the change in gene expression (cG) between the two time points was heritable. A significant heritability of the change indicates that genetic variants play a role in the cG and implies that additive genetic effects changed between the two time points. Therefore, the heritability of the change is related to the genetic correlation but answers a slightly different question—“How much of the variance in the cG is due to a change in genetic effects?”—compared to the question for the genetic correlation: “Are genetic effects the same between the two time points?” We found a mean heritability of the change of 0.07 (95% confidence interval = [0.06; 0.15]) (Supplemental Fig. S7D) and that 122 genes had a significant heritability of the change in gene expression. We observed that primary putative causal genes and down-regulated genes had higher heritability of the change than genes not differentially expressed or up-regulated genes (Fig. 2B), indicating that the change in expression of putative causal and down-regulated genes was, on average, genome-dependent. On the other hand, we found that up-regulated genes had lower heritability of the change than stable, putative causal or down-regulated genes (Fig. 2B), indicating that the change in gene expression for those genes was not genetic in origin.
Time-dependent cis-eQTLs
In order to map the heritability of the change in gene expression, we looked for SNPs with a different effect on gene expression between the two time points. In order to prevent potential issues due to heteroscedasticity, we only tested SNPs with a minor allele frequency >10% and transformed gene expression to a standard normal distribution. We found that two genes (5% FDR) were affected by a time-dependent cis-eQTL. The gene with the most significant time-dependent cis-eQTL (Bonferonni corrected P value = 0.0027) was PFN1, an actin binding protein that inhibits androgen receptor and huntingtin aggregation (Shao et al. 2008) and is mutated in familial amyotrophic lateral sclerosis (Wu et al. 2012). We observed that the allelic effect of rs76194250 on PFN1 expression was reversed between the two time points (Supplemental Fig. S9). Two potential explanations could explain this phenomenon: rs76194250 might be a proxy of two independent variants, bound by different factors, and the expression of these factors could change over time (Wen et al. 2015). Alternatively, changes in the relative abundance of two transcription factors with preferential binding affinity for the opposite allele of rs76194250 could result in an opposite allelic effect. As expected, the heritability of the change of the 1000 genes with the strongest evidence of being affected by a time-dependent cis-eQTL was significantly higher than for the 1000 genes with the least evidence (Supplemental Fig. S10A). In addition, the genetic correlation of the top 1000 genes was significantly lower than for the bottom 1000 genes (Supplemental Fig. S10B), indicating that more time-dependent cis-eQTLs could be discovered with a larger sample size. The genetic variants associated with the top 1000 genes were also significantly enriched in many functional regions of the human genome, such as transcription factor binding sites and open chromatin (Supplemental Fig. S11). In summary, we found examples of regulatory variants with a different effect on gene expression between the two time points and evidence that a larger sample size would allow the detection of more time-dependent cis-eQTLs.
Functional enrichment of differentially regulated genes
We then aimed to better understand which biological pathways were involved in the differences observed between the two time points. We found that down-regulated genes were highly enriched in the ribosome, oxidative phophorylation, neurodegenerative diseases, cardiac muscle contraction, RNA transport, protein export, and the proteasome (Supplemental Table S3). In contrast, up-regulated genes were mainly enriched in the lysosome, spliceosome, the regulation of the actin cytoskeleton, immune related pathways, protein processing, and the phagosome (Supplemental Table S3). Strikingly, these pathways were affected in a manner consistent with results of aging studies performed in human (Valdes et al. 2013; Peters et al. 2015) and model organisms (de Magalhaes et al. 2009; Houtkooper et al. 2013). Interestingly, putative causal genes were functionally enriched in terms related to cellular metabolism among differentially expressed genes, suggesting that this set of genes is functional and that changes in cellular metabolism could be driving the differences between the two time points. Moreover, genes with genetic correlation smaller than 1, genes that lost heritability, and genes with significant heritability of the change were all enriched in pathways related to oxidative phosphorylation or the ribosome (Supplemental Table S3). Altogether, these results show that genes differentially regulated between the two time points are functionally enriched in pathways involved in cellular metabolism.
Discussion
We observed that putative causal genes and down-regulated genes were mainly enriched in biological pathways related to cellular metabolism (Supplemental Table S3) and that they were affected by a loss in genetic control between the two time points (Fig. 2). Therefore, our results suggest that a loss of genetic control in genes involved in cellular metabolism could be central to the differences that we observed between the two time points. A loss of genetic control could be due to several factors, such as the diminution of the level of expression of transcription factors (less binding to a regulatory element would reduce the difference between the different genotypes), epigenetic modification, or genomic instability. Indeed, MZ twins share the same genome while DZ twins share, on average, half of their genome. If we assume that the rate of instability is the same in all individuals, the gene expression correlation of MZ twins should decay twice as fast as for DZ twins, leading to a decrease in heritability over time. Importantly, we note that down-regulation, loss of heritability, and large heritability of the change are expected to occur together if the effect of some regulatory variants decreases between the two time points (Fig. 3). Because the sample size of this study is small for heritability estimation, it remains unclear if the effect that we observed is part of a continuous trend, where the genetic regulation of some genes becomes progressively weaker over time, or whether the genomic region surrounding some genes is unstable, leading to a sudden loss of heritability (which might then recover).
Figure 3.

Hypothetical examples of two genes regulated by a single SNP mirroring our observations for (A) down-regulated (putative causal genes) and (B) up-regulated genes. The effect size of the regulatory variant decreases over time, which leads to the down-regulation of gene expression (dashed green and blue lines). The lower effect size implies that the variance explained by the regulatory variant decreased over time, which leads to a loss of heritability (assuming constant environmental variance). Due to the change in effect size of the regulatory variant, the change in gene expression is genotype-dependent (red bars with arrows) (A). The effect size of the regulatory variant is stable over time, but the mean environmental effect on gene expression increases, which implies that gene expression is up-regulated. Assuming that the environmental variance is not changing, the heritability of gene expression remains stable and the heritability of the change is low (red bars with arrows) (B).
We showed that time differentially regulated genes were linked to aging within and across studies. It remains unclear why the directionality of the effect of time and age was consistent for 84% of the differentially expressed genes within our study but only for 61.3% of the genes across studies. A potential explanation could be that differences in the prevalence of age-related diseases confound the effect of age on gene expression in a different manner in the two studies (Yang et al. 2015). Although, the relationship between our observations and the process of aging is unclear, our results are consistent with previous aging studies. For example, down-regulated genes in the aging brain in human were previously found to be involved in mitochondrial functions and to be affected by an increase in DNA damage (Lu et al. 2004). Furthermore, genomic instability of ribosomal DNA was causally linked to aging in Saccharomyce cerevisiae (Johnson et al. 1999). Nevertheless, it will be necessary to perform larger longitudinal studies with multiple time points in order to better understand the relationship between time-dependent genetic effects on gene expression and aging.
Methods
Study sample
All samples were obtained from female twins of the UK Adult Twin Registry (TwinsUK) (Moayyeri et al. 2013). The TwinsUK cohort is composed of healthy volunteers representative of the UK. The age of the individuals ranged from 45 to 80 yr at the first time point (median = 63 yr). The individuals were 1 to 2.7 yr older (median = 1.8 yr) at the second time point. Peripheral blood samples were collected from fasted individuals, on the same day for individuals from the same twin pair, at each time point. We excluded any individuals who did not fast from the study, which covered all diabetics (type 1 and 2).
Genotype
Samples were genotyped on a combination of the HumanHap300, HumanHap610Q, 1M-Duo, and 1.2MDuo Illumina arrays. Samples were imputed into the 1000 Genomes Project Phase 1 reference panel (data freeze 10 November 2010) (The 1000 Genomes Project Consortium 2012) using IMPUTE2 (Howie et al. 2009). SNPs with MAF < 5%, >5% missing genotype, IMPUTE info value <0.8, or that failed Hardy-Weinberg equilibrium at P value <5 × 10⁻⁷ were excluded.
RNA isolation, sequencing, and normalization
Samples were processed for sequencing with the Illumina TruSeq sample preparation kit and were then sequenced on a HiSeq 2000 machine according to the manufacturer's instructions. Paired-end reads (49 bp) were mapped to the GRCh37 reference human genome using GEM (Marco-Sola et al. 2012). Only reads with a mapping quality >150 were kept, corresponding to reads with unique matches in the reference genome with or without lower score matches. Exon quantification was performed using GENCODE 15 annotation (Harrow et al. 2012). All overlapping exons of a gene were merged into meta-exons with an identifier of the form “geneID_start.pos_end.pos”. We counted a read as mapping to a meta-exon if either its start or end coordinate overlapped a meta-exon. Gene quantifications were obtained by summing meta-exon counts for each gene. The total number of reads per sample was scaled to the median number of total reads of all samples (40 million reads). Exons or genes were removed if not expressed in at least 90% of the samples. In order to detect technical covariates affecting gene expression, we performed linear mixed model regressions of 211 measured variables (e.g., date of sequencing, lane, date of library preparation, plate, operator, GC content, size of the library, quantity of DNA in library, etc.) on the expression of all genes using the lme4 R package (Bates et al. 2015). We used the π1 statistic (Storey and Tibshirani 2003) to detect technical covariates affecting a large number of genes. We selected four uncorrelated technical covariates with an effect on a large number of genes (GC content, lane, insert size mode, and library preparation date) and corrected scaled read counts for their effect using a linear mixed model (Bates et al. 2015). Samples with monoallelic expression at more than 15% of their expressed heterozygous sites or that did not cluster with others using hierarchical clustering were excluded, resulting in 232 total sequenced samples (114 at the first time point and 118 at the second time point).
Differential expression analysis
We fitted a linear mixed model using all 232 individuals in order to find differentially expressed genes over time. We used the following mixed model: standard normal expression (of scaled read counts) ∼ age0 (fixed) + time (fixed) + GC content (fixed) + zygosity (random) + family (random) + individual (random) + lane (random) + library preparation date (random) + insert size mode (random) using the lme4 R package (Bates et al. 2015). Age0 is the age of the individuals at the first time point; time was coded as 0 for the first time point and as a continuous variable for the time difference between the two time points. Zygosity was coded with the same id for monozygotic twin pairs and different id for heterozygotic twin pairs. Family was coded with the same id for individuals of the same family. P values were obtained using an ANOVA between a model with the time variable and a model without the time variable. Significance of the results was assessed using the qvalue R package (Storey and Tibshirani 2003). We did not add season, the hour at sampling time, and RNA quality as covariates in the model as these variables had negligible effects (Supplemental Methods).
Chromosome enrichment in differentially expressed genes
For each chromosome, we tested whether the number of genes differentially expressed was significantly different from the number of genes expected to be differentially expressed given the number of genes tested on the chromosome using Fisher's exact test.
Bayesian networks
Bayesian networks (BNs) are directed acyclic graphs where nodes represent random variables and edges represent conditional dependencies among nodes. The direction of the edges between two nodes can be interpreted as causal relationships and previously allowed inference of causality in genetic studies (Schadt et al. 2005; Zhu et al. 2008; Gutierrez-Arcelus et al. 2013; Waszak et al. 2015). As time is unidirectional, BNs allow testing whether the change in expression of differentially expressed genes is conditionally dependent on other differentially expressed genes, which can be interpreted as temporal causality.
Using as input the observed data and predefined BN structures, likelihood methods are commonly used to detect the most likely network (i.e., the structure of the network that better agrees with the data). We used the R package bnlearn (Scutari 2010) to assess the likelihood of all three possible networks for all pairs of differentially expressed genes using time as an anchor. The first possible network (T → G1 → G2) states that time first affects a differentially expressed gene (G1), which then affects a second differentially expressed gene (G2); the second network (T → G2 → G1) states that time first affects G2 which then affects G1; and the last network (G1 ← T → G2) states that time affects G1 and G2 independently. Since different networks usually have different complexities, it is common to use a score, such as the Akaike Information Criterion (AIC), that takes into account the network complexity instead of the raw likelihood to compare different networks. We obtained the AIC score, which is equal to 2k−2ln(L), where k is the number of parameters (five for all the networks tested) and L is the maximum likelihood of the network for each network tested. The relative likelihood of two networks is then defined as: e(AICmin − AICmax)/2. We computed the relative likelihood of the best network compared to the two other networks for each pair of differentially expressed genes and kept only the putative causal relationships where the best network was at least 100 times more likely than the second best network. Gene expression was standard normalized prior to the estimation of the likelihood of the networks.
Potential limitations of Bayesian networks are that they do not allow modeling of feedback mechanisms and that they tend to perform poorly on very small data sets. Furthermore, Bayesian networks can be computationally intensive if used to learn the structure of large networks (instead of assessing the likelihoods of predefined network structures as used here).
Correlation of gene expression over time
We used Spearman rank correlation for each gene between the first and the second time point in 60 unrelated individuals. Given the wide range in sampling time between the two time points (12 mo to 33 mo), we corrected gene expression at the second time point for the time difference between the two time points, resulting in comparable gene expression data for the second time point.
Variance components models
Variance components models (also called linear mixed models) accommodate the nonindependence of family-related individuals and allow partitioning of the variance of a quantitative trait (like gene expression of a gene) in several genetic and environmental components. Let Y = (y1, y2) be the phenotype for the individuals in a family (twin pair); we assume normality of Y and
where μ is the mean, a is a random effect capturing the polygenic additive effects, c is a random effect capturing the environment shared between the members of the family, and e is the residual random effect that includes individual environmental effects. Such a model is typically referred to as an ACE model as it models the phenotype as a sum of additive genetic effects (A), common environment effects (C), and unique environment effects (E). We can express the covariance between relatives as
where 2Φ is the matrix of kinship coefficients between pairs of relatives (1 for MZ twin pairs, 1/2 for DZ twin pairs, and 0 otherwise), C is the matrix capturing the shared environment between twin pairs (1 for both MZ and DZ twin pairs and 0 otherwise), I is the identity matrix (dimension 2 for a pair of individuals), and is the variance due to polygenetic additive effects (a), environmental effects shared between the two twins (c), and individual environmental effects (e). Intuitively, if a phenotype is genetically regulated, the covariance between individuals at the phenotypical level should reflect the genetic relatedness (and therefore should be estimated to be greater than 0). We estimated the parameters using maximum likelihood methods as implemented in SOLAR (Almasy and Blangero 1998, 2010). The narrow-sense heritability is easily obtained from the estimated parameters as
Bivariate variance components models
This model is a straightforward extension of the univariate model described above. Let X = (x1, x2)′ and Y = (y1, y2)′ be the twin pair trait vectors for two phenotypes. We assume that X and Y are normally distributed as in the univariate case
and have covariance matrices
Then, we can express the bivariate phenotype as
The covariance matrix for Z has the partition structure
where ΩX and ΩY are the univariate covariance matrices described above, and the matrix ΩXY = ΩYX of cross covariances is given by
We can reparametrize the covariances in terms of correlations by writing
where ρXY is the correlation between traits X and Y. The complete covariance matrix for Z can be written as
where ⊗ is the Kronecker product operator. For two traits in a twin pair (two individuals), matrices A, C′, and E are 2 × 2 matrices, Φ, C, and I are 2 × 2, and ΩZ is 4 × 4. The matrices A, C′, and E of polygenic, common environment, and unique environmental variance components, respectively, each have the partition form
where ρδXY is the correlation between X and Y due to the effect of δ, and δ is a, c, or e.
We then have a model with 11 parameters: the averages of the two traits (μX and μY), the three variance components of the two traits for δ in a, c, or e, and the three correlations for genetic and environment components (ρaXY, ρcXY, ρeXY). As in the univariate case, we estimated the parameters using maximum likelihood methods as implemented in SOLAR (Almasy and Blangero 1998, 2010).
We note that the relationship between the phenotypical correlation and the correlation of its components is
where h2 is the narrow-sense heritability, c2 is the proportion of the variance of the phenotype due to the common environment, and e2 is the proportion of the variance of the phenotype due to the unique environment.
Genetic and environmental correlations
We used a bivariate (ACE) variance component model that jointly models gene expression at the first and second time point using SOLAR (Almasy and Blangero 1998, 2010). Given the wide range in sampling time between the two time points (12 mo to 33 mo), we corrected gene expression at the second time point for the time difference between the two time points, resulting in comparable gene expression data for the second time point. Gene expression was also standard normalized prior to estimation of genetic and environmental correlations. The median genetic correlation, common environment correlation, and unique environment correlation across genes was computed for genes where the proportion of the total variance of the genetics, common environment, and unique environment was >10% at both time points, respectively. The confidence intervals of the median genetic, common environment, and unique environment correlations were obtained using 100 bootstraps performed by randomly sampling twin pairs with replacement.
eQTL analysis
Expression QTL analysis was performed in 2-Mb windows surrounding the transcription start site of each gene on 61 unrelated individuals at the first time point and 63 unrelated individuals at the second time point using fastQTL (Ongen et al. 2016). Exon expression was standard normalized prior to association. Significance of the results was assessed using the qvalue R package (Storey and Tibshirani 2003). Sharing of cis-eQTLs over time was estimated using the π1 statistic on the P value distribution of one time point corresponding to significant cis-eQTLs at the other time point (Storey and Tibshirani 2003).
Heritability of gene expression
Heritability of gene expression was estimated with a variance component model (ACE) implemented in SOLAR (Almasy and Blangero 1998, 2010). Normalized gene expression was transformed to a standard normal distribution prior to the heritability estimation. Genes were called significant if the 95% confidence interval of 100 bootstraps (performed by randomly sampling twin pairs with replacement) was larger than 0. We assessed whether genes had a significant gain/loss in heritability if the 95% confidence interval of the difference in heritability (from the bootstrap data) did not overlap 0. Heritability of gene expression was estimated using 22 (22) monozygotic pairs, 26 (28) dizygotic twin pairs, and 18 (18) unrelated individuals at the first (second) time point.
Heritability of the change in gene expression
The heritability of the change is the proportion of the variance of the change in gene expression that is due to a change in additive genetic effects (Equation 1), where A1 represents the sum of additive genetic effects at the first time point, A2 represents the sum of additive genetic effects at the second time point, Y1 is the expression of the gene at the first time point, and Y2 is the expression of the gene at the second time point.
| (1) |
Under the null hypothesis (h2 change = 0), the numerator of Equation 1 has to be equal to 0. Therefore, the null hypothesis implicitly assumes that the sum of additive genetic effects on gene expression is equal between the two time points (for centered additive genetic effects). The heritability of the change in gene expression was estimated using a variance component model (ACE) implemented in SOLAR (Almasy and Blangero 1998, 2010) using the standard normalized difference in gene expression between the two time points. Genes were called significant if the 95% confidence interval of a 100 bootstrap (performed by randomly sampling twin pairs with replacement) was larger than 0. Heritability of the change in gene expression was estimated using 19 monozygotic twin pairs, 21 dizygotic twin pairs, and 25 unrelated individuals.
Time-dependent cis-eQTLs
We looked for interaction between SNPs and time on gene expression in a 2-Mb window surrounding the transcription start in a sample size of 217 individuals (individuals with genotype and gene expression) using SOLAR (Almasy and Blangero 1998, 2010). Gene expression was standard normalized, and only SNPs with minor allele frequency >10% were tested in order to prevent potential issues due to heteroscedasticity. The additive mixed model we fitted to the data was: standard normal expression ∼Age0 (fixed) + time (fixed) + SNP (fixed) + SNP × time (fixed) + family (random) + individual (random). Age0 is the age of the individuals at the first time point; time is coded as 0 for the first time point and as a continuous variable for the time difference between the two time points. Family ID and individual ID were treated as random effects. P values were obtained using a Wald test. We estimated the number of independent tests performed for each gene using eigenMT (Davis et al. 2016) on the matrix of genotype corresponding to unrelated individuals (more conservative than using related individuals) (Supplemental Methods). At the gene level, we corrected P values using the mean estimated number of independent tests using eigenMT between the two time points. At the genome-wide level, we used the Benjamini and Hochberg procedure to correct for multiple testing.
Functional location enrichment
Each selected SNP was matched to a SNP with the same minor allele frequency and with similar distance to the closest transcription start site. Functional annotations were obtained from the ENCODE Project in lymphoblastoid cell lines (The ENCODE Project Consortium 2012). A Fisher's exact test was used to test for enrichment of significant SNPs in each functional element compared to matched SNPs.
Pathway analysis enrichment
All pathway enrichment analyses were performed using WebGestalt with the set of tested genes as background (Wang et al. 2013).
Age-related effect of differentially expressed genes
The proportion of differentially expressed genes associated with aging was estimated using the π1 statistic (Storey and Tibshirani 2003) on the P value distribution obtained from a cross-sectional study of aging in human peripheral blood (Peters et al. 2015) matching our differentially expressed genes.
Data access
RNA sequencing data generated in this study have been submitted to the European Genome-phenome Archive (EGA; https://www.ebi.ac.uk/ega/) under accession number EGAS00001001763.
Supplementary Material
Acknowledgments
We thank Halit Ongen, Olivier Delaneau, and Cédric Howald for technical help and useful discussions. The computations were performed at the Vital-IT (http://www.vital-it.ch) Center for high-performance computing of the SIB Swiss Institute of Bioinformatics. This research was specifically funded by the Swiss National Foundation (SNF), the Louis-Jeantet Foundation, and the University of Geneva. The TwinsUK study was funded by the Wellcome Trust, European Community's Seventh Framework Programme (FP7/2007-2013). The study also receives support from the National Institute for Health Research (NIHR)-funded BioResource, Clinical Research Facility and Biomedical Research Centre based at Guy's and St. Thomas’ NHS Foundation Trust, in partnership with King's College London. SNP Genotyping was performed by The Wellcome Trust Sanger Institute and National Eye Institute via NIH/CIDR.
Footnotes
[Supplemental material is available for this article.]
Article published online before print. Article, supplemental material, and publication date are at http://www.genome.org/cgi/doi/10.1101/gr.207688.116.
References
- The 1000 Genomes Project Consortium. 2012. An integrated map of genetic variation from 1,092 human genomes. Nature 491: 56–65. [DOI] [PMC free article] [PubMed] [Google Scholar]
- Albert FW, Kruglyak L. 2015. The role of regulatory variation in complex traits and disease. Nat Rev Genet 16: 197–212. [DOI] [PubMed] [Google Scholar]
- Almasy L, Blangero J. 1998. Multipoint quantitative-trait linkage analysis in general pedigrees. Am J Hum Genet 62: 1198–1211. [DOI] [PMC free article] [PubMed] [Google Scholar]
- Almasy L, Blangero J. 2010. Variance component methods for analysis of complex phenotypes. Cold Spring Harbor Protocols 2010: pdb.top77. [DOI] [PMC free article] [PubMed] [Google Scholar]
- Bates D, Mächler M, Bolker B, Walker S. 2015. Fitting linear mixed-effects models using lme4. J Stat Software 10.18637/jss.v067.i01. [DOI] [Google Scholar]
- Brem RB, Yvert G, Clinton R, Kruglyak L. 2002. Genetic dissection of transcriptional regulation in budding yeast. Science 296: 752–755. [DOI] [PubMed] [Google Scholar]
- Brown AA, Buil A, Vinuela A, Lappalainen T, Zheng HF, Richards JB, Small KS, Spector TD, Dermitzakis ET, Durbin R. 2014. Genetic interactions affecting human gene expression identified by variance association mapping. eLife 3: e01381. [DOI] [PMC free article] [PubMed] [Google Scholar]
- Buil A, Brown AA, Lappalainen T, Vinuela A, Davies MN, Zheng H-F, Richards JB, Glass D, Small KS, Durbin R, et al. 2015. Gene-gene and gene-environment interactions detected by transcriptome sequence analysis in twins. Nat Genet 47: 88–91. [DOI] [PMC free article] [PubMed] [Google Scholar]
- Cheung VG, Conlin LK, Weber TM, Arcaro M, Jen KY, Morley M, Spielman RS. 2003. Natural variation in human gene expression assessed in lymphoblastoid cells. Nat Genet 33: 422–425. [DOI] [PubMed] [Google Scholar]
- Davis JR, Fresard L, Knowles DA, Pala M, Bustamante CD, Battle A, Montgomery SB. 2016. An efficient multiple-testing adjustment for eQTL studies that accounts for linkage disequilibrium between variants. Am J Hum Genet 98: 216–224. [DOI] [PMC free article] [PubMed] [Google Scholar]
- de Magalhaes JP, Curado J, Church GM. 2009. Meta-analysis of age-related gene expression profiles identifies common signatures of aging. Bioinformatics 25: 875–881. [DOI] [PMC free article] [PubMed] [Google Scholar]
- Dimas AS, Deutsch S, Stranger BE, Montgomery SB, Borel C, Attar-Cohen H, Ingle C, Beazley C, Gutierrez Arcelus M, Sekowska M, et al. 2009. Common regulatory variation impacts gene expression in a cell type–dependent manner. Science 325: 1246–1250. [DOI] [PMC free article] [PubMed] [Google Scholar]
- The ENCODE Project Consortium. 2012. An integrated encyclopedia of DNA elements in the human genome. Nature 489: 57–74. [DOI] [PMC free article] [PubMed] [Google Scholar]
- Fairfax BP, Humburg P, Makino S, Naranbhai V, Wong D, Lau E, Jostins L, Plant K, Andrews R, Mcgee C, et al. 2014. Innate immune activity conditions the effect of regulatory variants upon monocyte gene expression. Science 343: 1246949. [DOI] [PMC free article] [PubMed] [Google Scholar]
- Gaffney DJ. 2013. Global properties and functional complexity of human gene regulatory variation. PLoS Genet 9: e1003501. [DOI] [PMC free article] [PubMed] [Google Scholar]
- Glass D, Vinuela A, Davies MN, Ramasamy A, Parts L, Knowles D, Brown AA, Hedman AK, Small KS, Buil A, et al. 2013. Gene expression changes with age in skin, adipose tissue, blood and brain. Genome Biol 14: R75. [DOI] [PMC free article] [PubMed] [Google Scholar]
- Grundberg E, Adoue V, Kwan T, Ge B, Duan QL, Lam KCL, Koka V, Kindmark A, Weiss ST, Tantisira K, et al. 2011. Global analysis of the impact of environmental perturbation on cis-regulation of gene expression. PLoS Genet 7: e1001279. [DOI] [PMC free article] [PubMed] [Google Scholar]
- Grundberg E, Small KS, Hedman AK, Nica AC, Buil A, Keildson S, Bell JT, Yang T-P, Meduri E, Barrett A, et al. 2012. Mapping cis- and trans-regulatory effects across multiple tissues in twins. Nat Genet 44: 1084–1089. [DOI] [PMC free article] [PubMed] [Google Scholar]
- The GTEx Consortium. 2015. The Genotype-Tissue Expression (GTEx) pilot analysis: multitissue gene regulation in humans. Science 348: 648–660. [DOI] [PMC free article] [PubMed] [Google Scholar]
- Gutierrez-Arcelus M, Lappalainen T, Montgomery SB, Buil A, Ongen H, Yurovsky A, Bryois J, Giger T, Romano L, Planchon A, et al. 2013. Passive and active DNA methylation and the interplay with genetic variation in gene regulation. eLife 2: e00523. [DOI] [PMC free article] [PubMed] [Google Scholar]
- Gutierrez-Arcelus M, Ongen H, Lappalainen T, Montgomery SB, Buil A, Yurovsky A, Bryois J, Padioleau I, Romano L, Planchon A, et al. 2015. Tissue-specific effects of genetic and epigenetic variation on gene regulation and splicing. PLoS Genet 11: e1004958. [DOI] [PMC free article] [PubMed] [Google Scholar]
- Harrow J, Frankish A, Gonzalez JM, Tapanari E, Diekhans M, Kokocinski F, Aken BL, Barrell D, Zadissa A, Searle S, et al. 2012. GENCODE: the reference human genome annotation for The ENCODE Project. Genome Res 22: 1760–1774. [DOI] [PMC free article] [PubMed] [Google Scholar]
- Houtkooper RH, Mouchiroud L, Ryu D, Moullan N, Katsyuba E, Knott G, Williams RW, Auwerx J. 2013. Mitonuclear protein imbalance as a conserved longevity mechanism. Nature 497: 451–457. [DOI] [PMC free article] [PubMed] [Google Scholar]
- Howie BN, Donnelly P, Marchini J. 2009. A flexible and accurate genotype imputation method for the next generation of genome-wide association studies. PLoS Genet 5: e1000529. [DOI] [PMC free article] [PubMed] [Google Scholar]
- Johnson FB, Sinclair DA, Guarente L. 1999. Molecular biology of aging. Cell 96: 291–302. [DOI] [PubMed] [Google Scholar]
- Kent JW Jr, Goring HH, Charlesworth JC, Drigalenko E, Diego VP, Curran JE, Johnson MP, Dyer TD, Cole SA, Jowett JB, et al. 2012. Genotype × age interaction in human transcriptional ageing. Mech Ageing Dev 133: 581–590. [DOI] [PMC free article] [PubMed] [Google Scholar]
- López-Otín C, Blasco MA, Partridge L, Serrano M, Kroemer G. 2013. The hallmarks of aging. Cell 153: 1194–1217. [DOI] [PMC free article] [PubMed] [Google Scholar]
- Lu T, Pan Y, Kao S-Y, Li C, Kohane I, Chan J, Yankner BA. 2004. Gene regulation and DNA damage in the ageing human brain. Nature 429: 883–891. [DOI] [PubMed] [Google Scholar]
- Maranville JC, Luca F, Richards AL, Wen XQ, Witonsky DB, Baxter S, Stephens M, Di Rienzo A. 2011. Interactions between glucocorticoid treatment and cis-regulatory polymorphisms contribute to cellular response phenotypes. PLoS Genet 7: e1002162. [DOI] [PMC free article] [PubMed] [Google Scholar]
- Marco-Sola S, Sammeth M, Guigo R, Ribeca P. 2012. The GEM mapper: fast, accurate and versatile alignment by filtration. Nat Methods 9: 1185–1188. [DOI] [PubMed] [Google Scholar]
- Moayyeri A, Hammond CJ, Hart DJ, Spector TD. 2013. The UK Adult Twin Registry (TwinsUK Resource). Twin Res Hum Genet 16: 144–149. [DOI] [PMC free article] [PubMed] [Google Scholar]
- Morley M, Molony CM, Weber TM, Devlin JL, Ewens KG, Spielman RS, Cheung VG. 2004. Genetic analysis of genome-wide variation in human gene expression. Nature 430: 743–747. [DOI] [PMC free article] [PubMed] [Google Scholar]
- Newman AM, Liu CL, Green MR, Gentles AJ, Feng W, Xu Y, Hoang CD, Diehn M, Alizadeh AA. 2015. Robust enumeration of cell subsets from tissue expression profiles. Nat Methods 12: 453–457. [DOI] [PMC free article] [PubMed] [Google Scholar]
- Ongen H, Buil A, Brown AA, Dermitzakis ET, Delaneau O. 2016. Fast and efficient QTL mapper for thousands of molecular phenotypes. Bioinformatics 32: 1479–1485. [DOI] [PMC free article] [PubMed] [Google Scholar]
- Peters MJ, Joehanes R, Pilling LC, Schurmann C, Conneely KN, Powell J, Reinmaa E, Sutphin GL, Zhernakova A, Schramm K, et al. 2015. The transcriptional landscape of age in human peripheral blood. Nat Commun 6: 8570. [DOI] [PMC free article] [PubMed] [Google Scholar]
- Romanoski CE, Lee S, Kim MJ, Ingram-Drake L, Plaisier CL, Yordanova R, Tilford C, Guan B, He AQ, Gargalovic PS, et al. 2010. Systems genetics analysis of gene-by-environment interactions in human cells. Am J Hum Genet 86: 399–410. [DOI] [PMC free article] [PubMed] [Google Scholar]
- Schadt EE, Lamb J, Yang X, Zhu J, Edwards S, Guhathakurta D, Sieberts SK, Monks S, Reitman M, Zhang C, et al. 2005. An integrative genomics approach to infer causal associations between gene expression and disease. Nat Genet 37: 710–717. [DOI] [PMC free article] [PubMed] [Google Scholar]
- Scutari M. 2010. Learning Bayesian networks with the bnlearn R package. J Stat Softw 35: 1–22. 10.18637/jss.v035.i03.21603108 [DOI] [Google Scholar]
- Shao J, Welch WJ, Diprospero NA, Diamond MI. 2008. Phosphorylation of profilin by ROCK1 regulates polyglutamine aggregation. Mol Cell Biol 28: 5196–5208. [DOI] [PMC free article] [PubMed] [Google Scholar]
- Storey JD, Tibshirani R. 2003. Statistical significance for genomewide studies. Proc Natl Acad Sci 100: 9440–9445. [DOI] [PMC free article] [PubMed] [Google Scholar]
- Valdes AM, Glass D, Spector TD. 2013. Omics technologies and the study of human ageing. Nat Rev Genet 14: 601–607. [DOI] [PubMed] [Google Scholar]
- Viñuela A, Snoek LB, Riksen JAG, Kammenga JE. 2010. Genome-wide gene expression regulation as a function of genotype and age in C. elegans. Genome Res 20: 929–937. [DOI] [PMC free article] [PubMed] [Google Scholar]
- Visscher PM, Hill WG, Wray NR. 2008. Heritability in the genomics era—concepts and misconceptions. Nat Rev Genet 9: 255–266. [DOI] [PubMed] [Google Scholar]
- Wang J, Duncan D, Shi Z, Zhang B. 2013. WEB-based GEne SeT AnaLysis Toolkit (WebGestalt): update 2013. Nucleic Acids Res 41: W77–W83. [DOI] [PMC free article] [PubMed] [Google Scholar]
- Waszak SM, Delaneau O, Gschwind AR, Kilpinen H, Raghav SK, Witwicki RM, Orioli A, Wiederkehr M, Panousis NI, Yurovsky A, et al. 2015. Population variation and genetic control of modular chromatin architecture in humans. Cell 162: 1039–1050. [DOI] [PubMed] [Google Scholar]
- Wen X, Luca F, Pique-Regi R. 2015. Cross-population joint analysis of eQTLs: fine mapping and functional annotation. PLoS Genet 11: e1005176. [DOI] [PMC free article] [PubMed] [Google Scholar]
- Wu CH, Fallini C, Ticozzi N, Keagle PJ, Sapp PC, Piotrowska K, Lowe P, Koppers M, McKenna-Yasek D, Baron DM, et al. 2012. Mutations in the profilin 1 gene cause familial amyotrophic lateral sclerosis. Nature 488: 499–503. [DOI] [PMC free article] [PubMed] [Google Scholar]
- Yang J, Yu L, Gaiteri C, Srivastava GP, Chibnik LB, Leurgans SE, Schneider JA, Meissner A, De Jager PL, Bennett DA. 2015. Association of DNA methylation in the brain with age in older persons is confounded by common neuropathologies. Int J Biochem Cell Biol 67: 58–64. [DOI] [PMC free article] [PubMed] [Google Scholar]
- Yao C, Joehanes R, Johnson AD, Huan T, Esko T, Ying S, Freedman JE, Murabito J, Lunetta KL, Metspalu A, et al. 2014. Sex- and age-interacting eQTLs in human complex diseases. Hum Mol Genet 23: 1947–1956. [DOI] [PMC free article] [PubMed] [Google Scholar]
- Zhu J, Zhang B, Smith EN, Drees B, Brem RB, Kruglyak L, Bumgarner RE, Schadt EE. 2008. Integrating large-scale functional genomic data to dissect the complexity of yeast regulatory networks. Nat Genet 40: 854–861. [DOI] [PMC free article] [PubMed] [Google Scholar]
Associated Data
This section collects any data citations, data availability statements, or supplementary materials included in this article.