Abstract
Chronic bacterial infections of the lung are the leading cause of morbidity and mortality in cystic fibrosis patients. Tracking bacterial evolution during chronic infections can provide insights into how host selection pressures—including immune responses and therapeutic interventions—shape bacterial genomes. We carried out genomic and phenotypic analyses of 215 serially collected Burkholderia cenocepacia isolates from 16 cystic fibrosis patients, spanning a period of 2–20 yr and a broad range of epidemic lineages. Systematic phenotypic tests identified longitudinal bacterial series that manifested progressive changes in liquid media growth, motility, biofilm formation, and acute insect virulence, but not in mucoidy. The results suggest that distinct lineages follow distinct evolutionary trajectories during lung infection. Pan-genome analysis identified 10,110 homologous gene clusters present only in a subset of strains, including genes restricted to different molecular types. Our phylogenetic analysis based on 2148 orthologous gene clusters from all isolates is consistent with patient-specific clades. This suggests that initial colonization of patients was likely by individual strains, followed by subsequent diversification. Evidence of clonal lineages shared by some patients was observed, suggesting inter-patient transmission. We observed recurrent gene losses in multiple independent longitudinal series, including complete loss of Chromosome III and deletions on other chromosomes. Recurrently observed loss-of-function mutations were associated with decreases in motility and biofilm formation. Together, our study provides the first comprehensive genome-phenome analyses of B. cenocepacia infection in cystic fibrosis lungs and serves as a valuable resource for understanding the genomic and phenotypic underpinnings of bacterial evolution.
Cystic fibrosis (CF) is the most common fatal genetic disorder, arising due to mutations within the cystic fibrosis transmembrane conductance regulator (CFTR) gene, which alters ion fluxes in mucosal membranes, including the lung airways (Riordan et al. 1989; Cant et al. 2014). The thick mucus covering the CF airway is an ideal environment for a polymicrobial community, including pathogens such as Pseudomonas aeruginosa, Staphylococcus aureus, and the Burkholderia cepacia species complex (Bcc) (Filkins and O'Toole 2015; Parkins and Floto 2015; Huang and LiPuma 2016). The ecological diversity and the dynamics of this community complicate diagnosis and treatment (Rau et al. 2012). Aggressive antimicrobial therapies are typically used to treat recurrent infections (Bhatt 2013; Biller 2015), and while effective at relieving symptoms, they encourage evolutionary adaptation of bacterial populations, including the development of antimicrobial resistance (Griesenbach and Alton 2015). B. cenocepacia infection is a risk factor for CF patients (Lipuma 2010), and because it is both highly transmissible and often antibiotic resistant, its presence can exclude patients from lung transplantation (Murray et al. 2008; Lobo et al. 2015).
The unpredictable infection trajectory of B. cenocepacia infection in CF patients poses treatment challenges; some patients colonized by B. cenocepacia are asymptomatic, while others develop cepacia syndrome, which can be fatal (Isles et al. 1984). CF patients infected with genotypically similar Burkholderia strains can have drastically different clinical outcomes. While useful for tracking Bcc epidemics, current genotyping methods—such as pulse-field gel electrophoresis (PFGE), multilocus sequence typing (MLST), and PCR-based methods with randomly amplified polymorphic DNA (RAPD) or BOX-PCR (Govan et al. 1993; Jones et al. 2004)—are not sufficient to define the scope of genetic diversity in infectious B. cenocepacia strains or to identify the underlying genetic differences responsible for variation in bacterial phenotypes that influence clinical outcomes (Mahenthiralingam et al. 2000; Speert et al. 2002a; Vonberg et al. 2006; Pretto et al. 2013). These low-resolution genotyping methods have shown that long-term sequential isolates from one patient typically belong to the same clonal type but nevertheless show phenotypic diversity (Cunha et al. 2003; Coutinho et al. 2011a,b).
Whole-genome sequencing provides single-base resolution of bacterial evolution in CF lung infections (Didelot et al. 2016). Similar approaches in P. aeruginosa, Burkholderia dolosa, and Burkholderia multivorans have shown that mutations accumulate in clonal lineages during adaptation to the lung. The spatial heterogeneity in CF airways can also influence bacterial population diversity, suggesting deep sampling is needed to capture this diversity (Lieberman et al. 2014; Markussen et al. 2014). These studies also find parallel adaptive changes in specific molecular pathways in response to host selection pressures, including antibiotic resistance, and changes in bacterial cell wall and membrane composition, metabolism, and oxygen-sensing (Smith et al. 2006; Huse et al. 2010; Lieberman et al. 2011, 2014; Yang et al. 2011; Marvig et al. 2013, 2015; Silva et al. 2016).
In contrast to P. aeruginosa and B. dolosa, little is known about the genomic changes that occur in B. cenocepacia in CF nor about how such changes influence clinically relevant bacterial phenotypes. B. cenocepacia is the most prevalent Bcc species colonizing CF patients, with most isolates from the United Kingdom and Canada belonging to a single molecular type (electrophoretic type ET12 or RAPD02) that includes epidemic strain J2315 (Speert et al. 2002b; McDowell et al. 2004). Along with RAPD02; RAPD01, -04, and -06 comprise a distinct genomic group (previously genomovar IIIA, now called recA subgroup A), whereas other RAPD types belong to a divergent B. cenocepacia genomic group (previously genomovar IIIB, now recA subgroup B) that includes PHDC epidemic lineages HI2424 and AU1054 strains (Johnson 1994; Rozee et al. 1994; Mahenthiralingam et al. 1996; Speert 2002; Speert et al. 2002a; Lipuma 2005; Holden et al. 2009; Miller et al. 2015).
B. cenocepacia was the most common species found in infected patients between 1990 and 1995 in clinics in Vancouver, Canada (Zlosnik et al. 2015). To understand how B. cenocepacia evolved in these patients, we selected 215 isolates from 16 patients over a span of 2.3–20.7 yr, because they included numerous isolates per patient and covered the diverse molecular types representing the major epidemic lineages. We conducted whole-genome sequencing and a battery of phenotypic assays (growth, motility, biofilm, mucoidy, and acute virulence) on all 215 isolates to gain insight into the genomic and phenotypic diversity within and between B. cenocepacia molecular types. Our results show patterns of recurrent phenotypic and genomic changes in independent B. cenocepacia infections of distinct molecular types, and this new data set offers a comprehensive genomic and phenotypic resource for future work on understanding bacterial evolution in the CF lung.
Results
A longitudinal collection of B. cenocepacia bacterial isolates
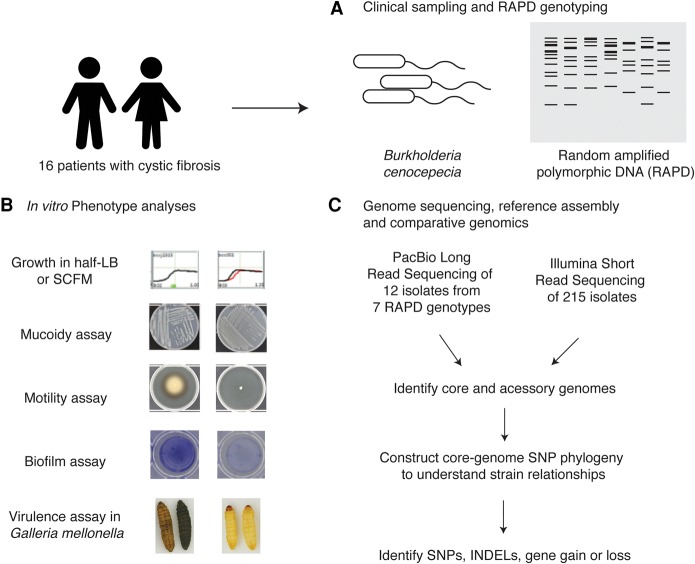
We used Burkholderia isolates collected from CF patients by the CBCCRRR (Canadian Burkholderia cepacia Complex Research and Referral Repository) (Fig. 1; Zlosnik et al. 2015). Bcc isolates were typed by RAPD analyses, which used random primers to generate electrophoretic patterns that differ among divergent isolates (Mahenthiralingam et al. 1996; Speert et al. 2002a).
Figure 1.
Overview of data collection. (A) To understand the genomic and phenotypic evolution of B. cenocepacia strains within the CF lung, we examined 16 longitudinal series of B. cenocepacia strains isolated from sputum (215 isolates total) that had been collected and typed using RAPD analysis as part of the surveillance program at CBCCRRR. (B) In vitro phenotypic analyses were carried out for all isolates, focusing on clinically relevant traits: growth rate, motility, biofilm formation, mucoidy, and acute virulence in an insect model system. (C) Short-read paired-end sequencing by Illumina was carried out for all 215 isolates. To provide reference-quality sequences for a subset of isolates representing all seven RAPD genotypes, long-read sequencing by PacBio was carried out on 11 isolates as well as on the reference B. cenocepacia J2315 as a control.
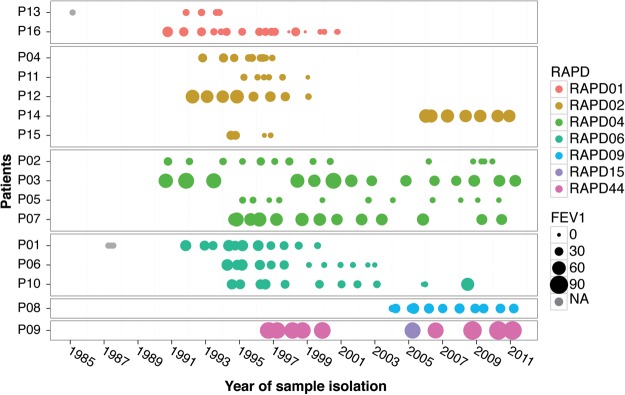
To develop a comprehensive genomic and phenotypic view of B. cenocepacia evolution in the CF lung, we selected 215 isolates from 16 patients from the CBCCRRR between 1985 and 2011 (Table 1; Figs. 1, 2; Supplemental Table S2). Selection criteria included patient series with numerous longitudinally sampled isolates (range, seven to 23) and with all major epidemic lineages. For most time points, a single bacterial isolate was archived, although two to three independent isolates were archived for some time points (due to visual identification of distinct colony morphologies). Patient lung function was assessed by spirometry at most time points. Most patients exhibited progressive declines in lung function over time; 14 of 16 showed significant decreases for at least one of three measures of lung function (Fig. 2; Supplemental Fig. S1; Supplemental Table S1A–C). Declines were substantial; %FEV1 (percentage of predicted forced expiratory volume in 1 sec) decreased by an average of 7.5%/yr for 12 patients (Supplemental Table S1A). Two additional measures of lung function gave similar results (Supplemental Table S1B,C).
Table 1.
Summary of 16 B. cenocepacia longitudinal series
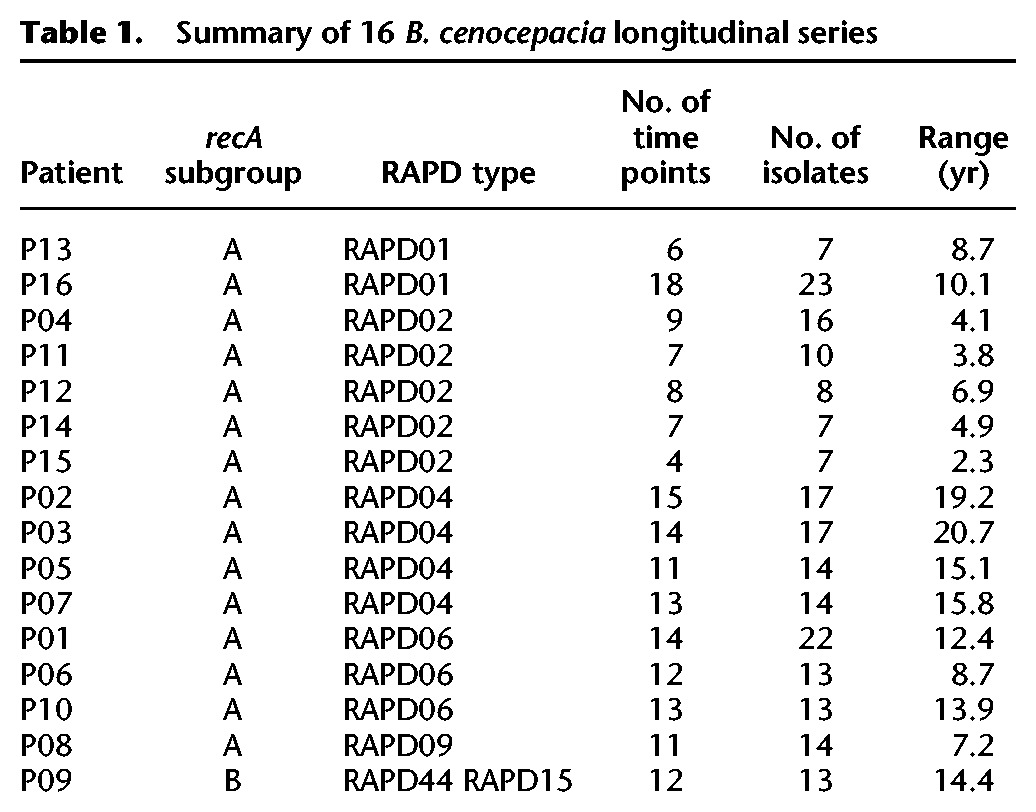
Figure 2.
Longitudinal series of B. cenocepacia isolates. Each series (collected from patients P01 to P16) is depicted as a row of dots to represent sampling time points. Colors indicate different RAPD genotypes, and relative dot size indicates patient lung function (%FEV1) at that time point. Gray circles indicate no associated %FEV1 (percentage of predicted forced expiratory volume in 1 sec) measurement (also see Supplemental Fig. S1).
The majority of patients were colonized by subgroup A isolates (202 of 215 isolates) primarily from one of the major B. cenocepacia epidemic lineages. Except for the single patient P09 infected with subgroup B, all isolates from the same patient belonged to the same RAPD type. By using these 215 isolates, we conducted a comprehensive survey of clinically relevant phenotypes and carried out whole-genome sequence analysis of all isolates.
Phenotypic analysis of B. cenocepacia longitudinal series finds strong correlations with RAPD type and frequent progressive temporal changes
To understand how bacterial phenotypes change over time during chronic infections, we systematically cataloged phenotypic variation for all isolates. Specifically, we measured: growth in two liquid media types (lysogeny broth [LB]; and synthetic cystic fibrosis medium [SCFM]), swimming motility, biofilm formation, acute virulence in an insect model, and mucoidy morphotype (Palmer et al. 2007). The results reveal extensive phenotypic variation among B. cenocepacia isolates both within and among RAPD types and within patient series. Detailed descriptions and results for each phenotype are in Supplemental Text S1, Supplemental Table S1, and Supplemental Figures S2 and S3.
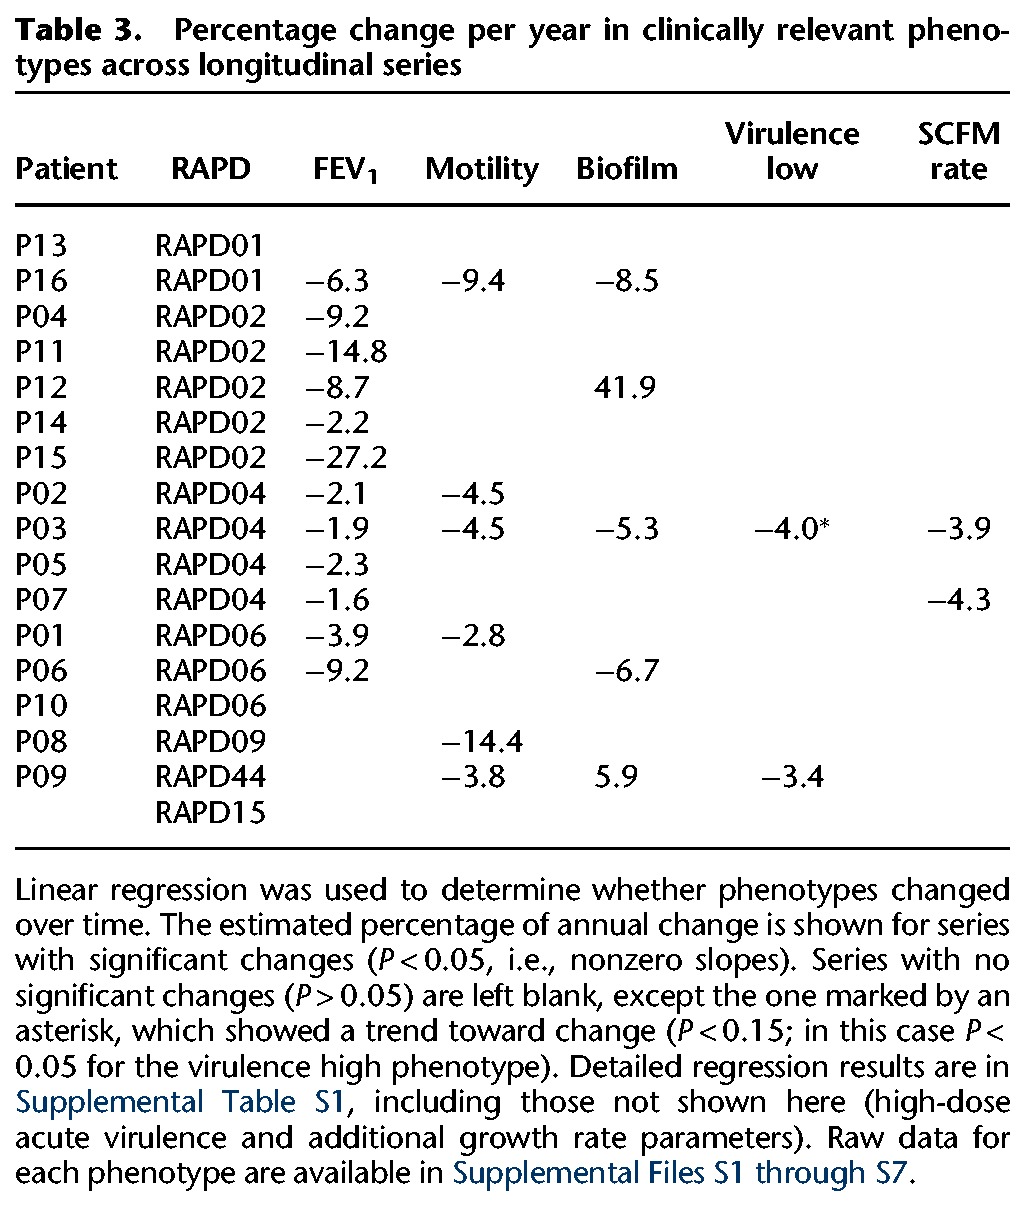
By considering these phenotypes on a global level, we found that RAPD genotype was a significant predictor of phenotypic variation, explaining between ∼20% and 50% of the variation (Table 2; Supplemental Fig. S4). However, considerable variation was also seen within patient series and within RAPD type. We also identified progressive phenotypic changes in many longitudinal series (Table 3). Six of the 16 series showed progressive decreases in motility, five showed temporal changes in biofilm formation (two increasing and three decreasing), two showed decreases in acute virulence as measured in an insect model, none showed changes in mucoidy, and, finally, seven showed changes in one or more growth parameters.
Table 2.
Correlation between RAPD type and clinically relevant phenotypes
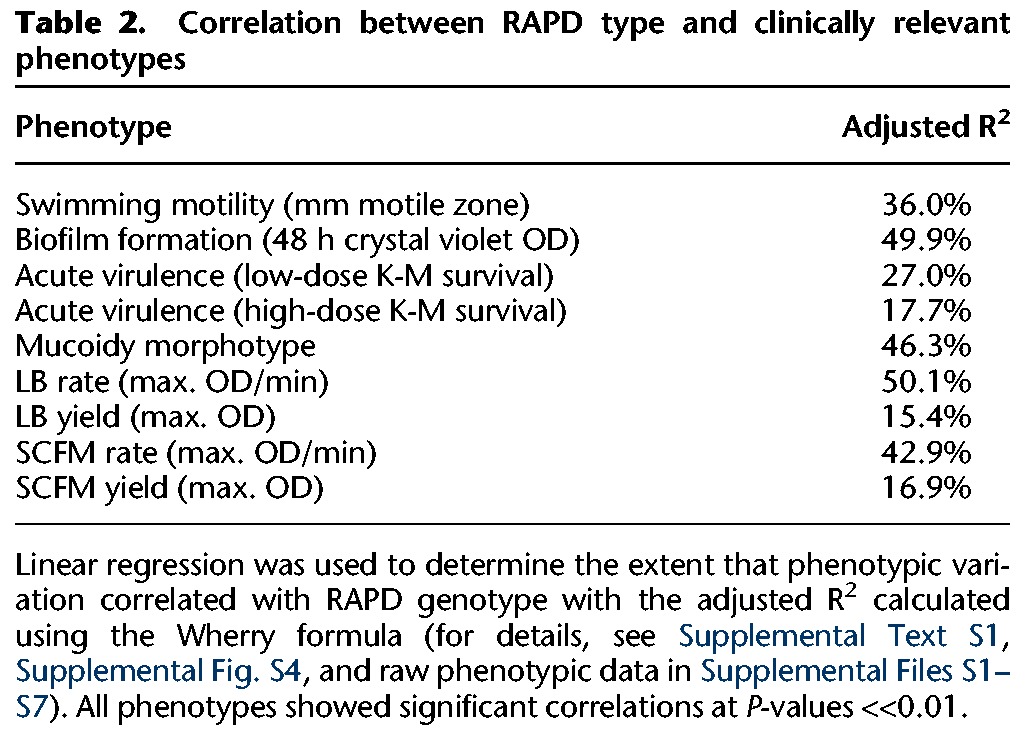
Linear regression was used to determine the extent that phenotypic variation correlated with RAPD genotype with the adjusted R2 calculated using the Wherry formula (for details, see Supplemental Text S1, Supplemental Fig. S4, and raw phenotypic data in Supplemental Files S1–S7). All phenotypes showed significant correlations at P-values <<0.01.
Table 3.
Percentage change per year in clinically relevant phenotypes across longitudinal series
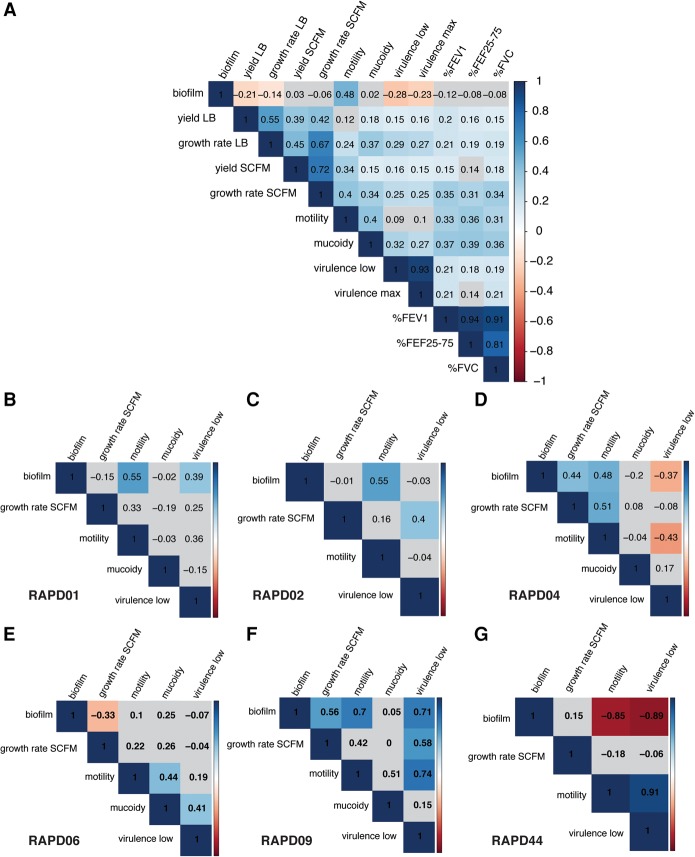
Given that each individual phenotype could have a complex genetic basis, we examined pairwise phenotypic correlations across all isolates and for each RAPD type individually (Fig. 3). In general, most phenotypes we measured were positively correlated; with the exception that biofilm formation was negatively correlated with acute insect virulence and growth in LB (Fig. 3A). This is not surprising; biofilm has been associated with persistent infection and not with acute virulence (Furukawa et al. 2006; Wu et al. 2015). Overall, motility was positively correlated with biofilm formation and mucoidy (Spearman correlation, ρ = 0.48 and 0.40, respectively, adjusted P-value <0.0001) (Fig. 3A). A strong positive correlation was found between motility and biofilm formation for most RAPD genotypes, except for a negative correlation was seen for subgroup B RAPD44 isolates (ρ = −0.85, adjusted P-value = 0.001) (Fig. 3B–G).
Figure 3.
Correlation matrices of B. cenocepacia phenotypes and patient lung function. Pairwise Spearman rank correlations of the five phenotypes are depicted as matrices for the following: (A) all isolates, (B) RAPD01, (C) RAPD02, (D) RAPD04, (E) RAPD06, (F) RAPD09, and (G) RAPD44. Blue gradients indicate significant positive correlation; red gradients, significant negative correlation; and gray, statistically nonsignificant correlation and P-value >0.05.
Our phenotypic analyses showed that strains of the same RAPD type are more phenotypically similar and a trend over time toward decreasing motility, biofilm formation, acute virulence, and growth rate in many patients. These results likely represent a minimum estimate of phenotypic changes over time, since the single strain isolated at most time points may be one of multiple strains that coexist in the same infection. In support of this, for 36 time points for which two to four independent clones were available, seven patients had isolate pairs that showed significant differences in biofilm formation among isolates within a time point (P << 0.05). This strongly indicates that, even if most infections have a single clonal origin (as suggested from the RAPD typing results), strains generated by subsequent diversification can coexist in the same infection.
Genome sequencing and assembly of B. cenocepacia longitudinal series
To identify genomic changes accumulating during chronic infection, we sequenced all 215 isolates to more than 60-fold coverage. Burkholderia genomes are relatively large (∼8 Mb) and repetitive, with two to three circular chromosomes and one or more plasmids (Holden et al. 2009). This complicated genome structure posed a challenge to genome assembly, especially in light of the dearth of high-quality reference sequences for all the RAPD types. We therefore supplemented Illumina sequencing for 11 isolates using long-read Pacific Biosciences RSII (PacBio) sequencing to about 60-fold genomic coverage. These 11 include four RAPD01 isolates; two isolates each of RAPD04, RAPD06, and RAPD09; and one isolate each for RAPD15 and -44 (Supplemental Table S4). As a control, we also resequenced the reference strain J2315 (Holden et al. 2009) using both short- and long-read methods. De novo assemblies were performed using the Ray assembler (Illumina) (Boisvert et al. 2010) and HGAP assembler (PacBio) (Chin et al. 2013), as detailed in the Methods.
Comparison of Illumina and PacBio assemblies from the same strains, methylation motifs identified by PacBio, and evaluation of the J2315 reference strain are included as Supplemental Files S8 and S9, Supplemental Text S2, Supplemental Table S5, and Supplemental Figure S5. Both sequence platforms gave consistent assemblies with only few single-nucleotide variants and structural differences (Supplemental Text S2; Supplemental Table S3). In all cases, however, the PacBio assemblies were of higher quality than their corresponding Illumina assemblies. Illumina assemblies had a median of 170 contigs and a median N50 of 97,307 bp, whereas the PacBio assemblies comprised one to 17 contigs and a median N50 of 3,775,012 bp (Supplemental Tables S3A,B). The pair-wise average nucleotide identities are >95% between recA subgroup A and B strains and >99% within each recA subgroup (Supplemental Files S8, S9; Supplemental Fig. S6).
The PacBio assembly identified Bcc129 as having a single circular chromosome with gene content from all three reference chromosomes (of B. cenocepacia HI2424 strain), suggesting a three-chromosome fusion, which was confirmed by PCR analyses (Supplemental Text S2; Supplemental Fig. S7). While the mechanism underlying this unique genome structure requires further study, the fusion implies a loss of function in two of the chromosome-specific ParAB partitioning systems (Dubarry et al. 2006).
Pan-genome analyses identified clade-specific gene content in B. cenocepacia
The “pan-genome” or “supragenome” comprises all genes across members of a species, including both core genes (shared by all strains in a species) and “accessory” or “distributed” genes found only in subsets of strains (Medini et al. 2005; Shen et al. 2005; Hogg et al. 2007). Patterns of gene loss or gain across strains can be inferred from these inventories. Toward this end, we annotated each genome assembly using Prokka (Seemann 2014) and used Roary (Page et al. 2015) to cluster orthologous coding sequences and generate a gene possession matrix (assemblies with more than 500 contigs were excluded). This identified 2148 orthologous clusters present in >99% of 209 strains (core genes), along with an additional 36,627 present in only a subset of strains (Table 4; Supplemental Text S3; Supplemental Fig. S8). By collapsing together orthologous clusters that had been separated due to local gene order (see Methods), we arrived at an overall size of the B. cenocepacia pan-genome as consisting of 3005 core homologous gene clusters and 10,110 homologous gene clusters present in only a subset of strains (Table 4; Supplemental File S11).
Table 4.
Pan-genome analysis across the isolate collection

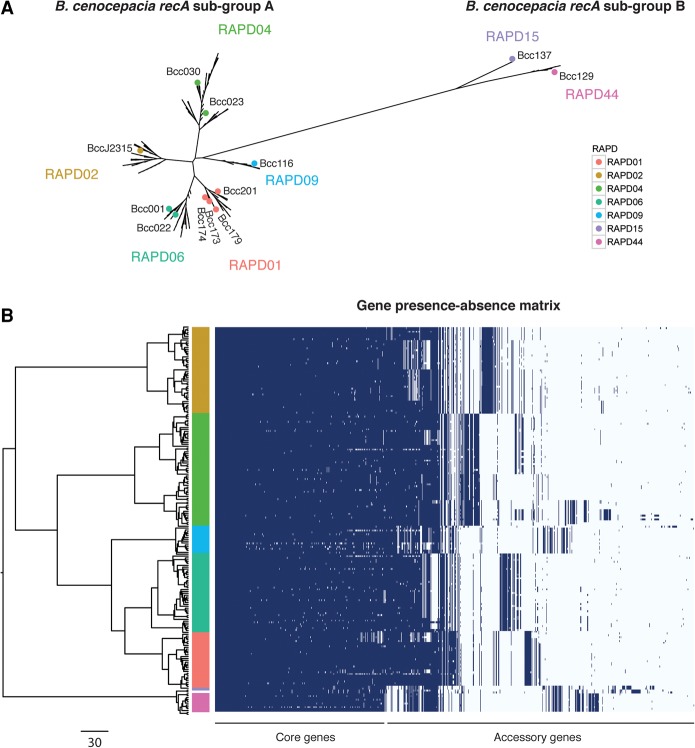
A phylogenetic tree built from a concatenated core gene alignment of the 2148 unambiguous orthologs from all 209 strains showed that subgroups A and B formed highly differentiated clades (Fig. 4A; Vandamme et al. 1997; Mahenthiralingam et al. 2001). Isolates from each of the RAPD genotypes grouped into monophyletic clades, with RAPD06 more closely related to RAPD01, and RAPD02 more closely related to RAPD04 (Fig. 4A). Inspection of the core gene phylogeny (built from orthologous clusters only) (Fig. 4B, left) with the gene possession matrix (based on homolog clustering) (Fig. 4B, right) further underlined that RAPD types formed monophyletic groups and that large sets of accessory genes were RAPD specific (Fig. 4B; Supplemental Text S3).
Figure 4.
Core gene phylogeny and gene presence across B. cenocepacia isolates. (A) Core genome phylogeny built using RAxML (Stamatakis 2014) from 2148 orthologous clusters of protein coding genes from 209 B. cenocepacia isolates (four NCBI references were included, and 10 Illumina assemblies with more than 500 contigs were excluded). The structure shows that the RAPD genotypes form monophyletic clades. Colored dots correspond to RAPD reference genomes sequenced using PacBio and represent at least one isolate from each epidemic lineage. (B) Left side shows the same phylogenetic tree based on a concatenated core gene alignment. The right side shows a gene possession matrix, with each row representing a strain's gene content. Each column corresponds to a homologous gene cluster (i.e., after merging “orthologous” clusters into homologous clusters), and columns are ordered by the frequency of gene presence. The results clearly indicate extensive clade-specific gene content. The colored bar indicates RAPD genotype. Scale bar for the phylogenetic tree on the bottom left represents the number of SNPs in core genes.
Evidence for diversification of B. cenocepacia clonal lineages during long-term infection of CF lungs
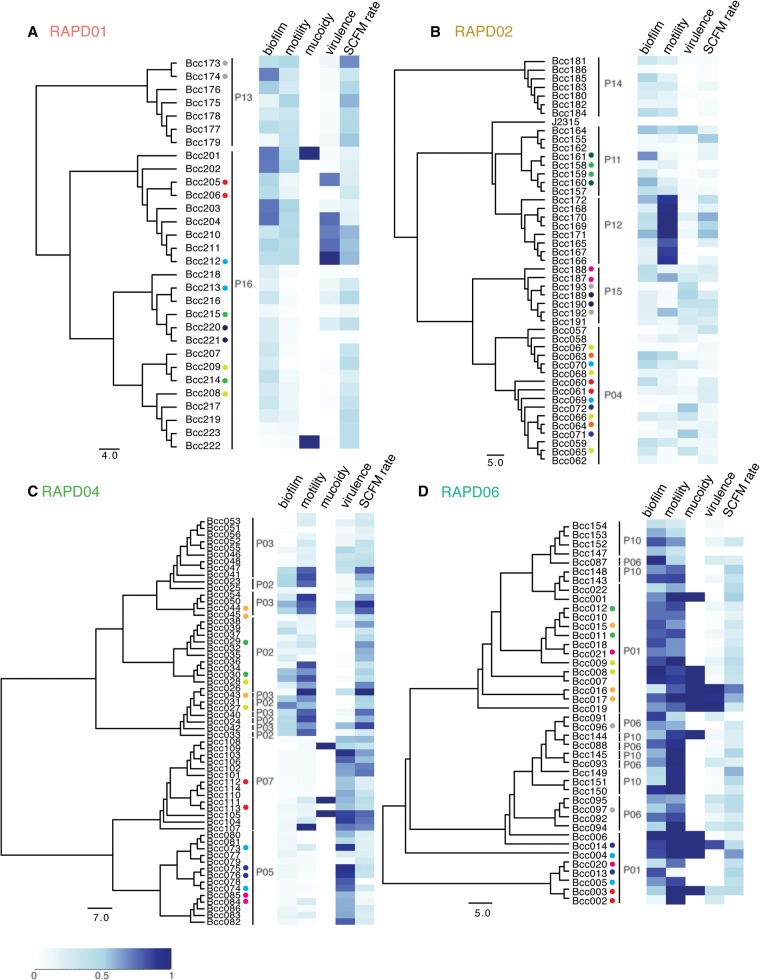
The retrospective nature of this study constrained our ability to associate genotype with phenotype. Building phylogenetic trees of each RAPD type based on their specific core gene orthologs and mapping the phenotypes of the corresponding strains to each tree (Fig. 5; Supplemental Fig. S10) can, however, illuminate the relationship between bacterial phylogeny, time of isolation, phenotype, and patient outcome (Supplemental Table S6; Supplemental Figs. S11, S12). Building trees for each RAPD type alone allowed inclusion of more core genes for a higher resolution in the phylogenetic analysis. We observed that isolates from RAPD01 and RAPD02 formed patient-specific clades (Fig. 5A,B; Supplemental Figs. S11, S12). This could suggest initial colonization of patients by single strains that subsequently diversify; alternatively, this pattern could be due to repeated colonizations by closely related isolates. Our results are consistent with observations from a B. dolosa outbreak at Boston Children's Hospital, in which isolates also formed distinct patient-specific clades (Lieberman et al. 2011). The phylogenetic structure of each patient-specific clade supports the presence of multiple strains from each clonal lineage coexisting in the same infection. For example, isolates from P16 fall into three different clades, and these isolates’ time of isolation has little or no correlation with clade structure (Fig. 5A; Supplemental Fig. S11A; Supplemental Table S2). Furthermore, two strains isolated at the same time (Fig. 5, colored dots; Supplemental Figs. S11, S12; Supplemental Table S2) often belonged to distinct clades; for example, isolates Bcc205/206 and Bcc220/221 are from sister taxa, while isolates Bcc212/213 and Bcc214/215 fall in distinct patient-specific phylogenies. This pattern can be seen over time for other isolates (e.g., P04: Bcc063/064). In contrast, for patient P14 (Fig. 5B), who developed cepacia syndrome, the single blood isolate (Bcc186) in the collection shared a recent common ancestry with sputum isolates (Bcc180–185), suggesting that the lung isolate entered the patient's bloodstream during sepsis and arose from the same original colonization event (Fig. 5B; St Denis et al. 2007).
Figure 5.
Genetic and phenotypic diversification of B. cenocepacia longitudinal series. Core gene phylogenetic trees were built for each RAPD type, with an adjacent heatmap for each phenotype. Phenotypic data were normalized to range between zero and one (lightest to darkest blue) for each phenotype, based on the range of values measured. Isolates: (A) RAPD01, (B) RAPD02, (C) RAPD04, and (D) RAPD06. Scale bar for the heatmap is on the bottom left, and scale bars for each phylogenetic tree represent the number of SNPs in core genes of the specific RAPD genotypes and the outgroup. Small colored dots are used for the 36 time points for which two to three isolates were collected (78 samples in total), with each color indicating a set of strains isolated from sputum at the same time point from that patient.
We also observed cases where the same clonal lineages were shared among patients (for further discussion, see Supplemental Text S3). For RAPD04, isolates from patients P05 and P07 formed their own clades, while isolates from patients P02 and P03 were mixed (Fig. 5C; Supplemental Fig. S12A). Similarly, RAPD06 isolates were polyphyletic with respect to patient (P01, P06, and P10) (Fig. 5D; Supplemental Fig. S12B). As described above, strains isolated on the same date fall into distinct parts of the phylogenetic trees, showing coexistence of multiple strains (e.g., P02: Bcc043/044/045; P06: Bcc096/097). This intermingling of clonal lineages between patients suggest either that patients were independently infected by closely related strains or that strains were transmitted between patients.
In patient P09, we observed coinfection by two distinct subgroup B strains, showing that the strains’ positions in the patient-specific phylogeny were not correlated to when it was isolated (Fig. 1D; Supplemental Fig. S10B). Further evidence of coexisting strains belonging to the same clonal lineage comes from paired isolates Bcc129/130, which belong to distinct clades despite being sampled at the same time (Supplemental Fig. S10B).
Phenotypic variation among B. cenocepacia isolates collected from the same patient was extensive; for instance, we observed that 11 patients had isolates with significant phenotypic variation in motility (P << 0.05). This trend holds true even for isolates that show up as closely related sister taxa in the phylogenetic trees (e.g., P16: Bcc205 and Bcc206 for acute virulence, Bcc222 and Bcc223 for mucoidy; P11: Bcc158 and Bcc161 for biofilm; P01: Bcc013 and Bcc020 for motility). In fact, the branch lengths separating these sister taxa are often very short, with sister taxa separated by only a few nucleotides (see Fig. 5, scale bars), potentially suggesting that a small number of nucleotide differences may be responsible for large phenotypic differences. However, because these trees were based on only allelic variation in RAPD-specific core genes (Supplemental Table S6), a much more likely scenario is that phenotypic changes are the result of gene possession differences not reflected by these branch lengths.
Recurrent genomic changes in B. cenocepacia during long-term infection of CF lungs
Previous studies on long-term bacterial adaptation have reported genome reduction by deletion of genes encoding nonessential functions, particularly for environmental-opportunistic pathogens (Rau et al. 2012; Price et al. 2013; Sharma et al. 2014). Long-term mutation accumulation studies showed that B. cenocepacia has low genome-wide mutation rates, with many of the mutations biased toward deletions (Dillon et al. 2015). Longitudinal sampling spanning up to 10 yr allowed us to ask if genome reduction occurs during the adaption of B. cenocepacia in CF patients. Specifically, we identified gene losses by comparing the gene content of later isolates to the first isolate within each longitudinal series.
Genome reduction was observed in seven patient series (P01, P02, P03, P07, P08, P13, and P16); isolates from later time points had reduced genomes and fewer genes versus earlier isolates (Supplemental Table S3; and examples in Fig. 6). Two strains (Bcc030 and Bcc115) lost Chromosome 3 entirely. Comparing the genome sizes for PacBio assemblies for early and late time points (patients P01, P02, and P13) also showed reduction in genome size and gene content (Supplemental Table S3B; Supplemental Fig. S13). Many gene losses likely occurred simultaneously as parts of large deletions (Supplemental Fig. S13).
Figure 6.
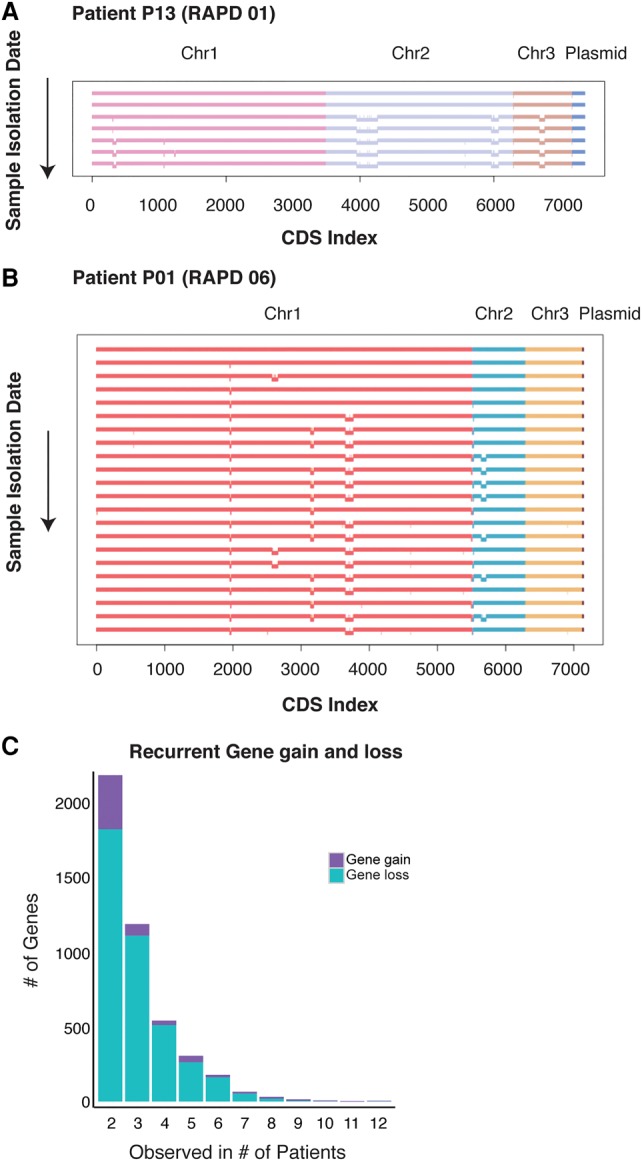
Recurrent gene loss observed in B. cenocepacia longitudinal series. Each horizontal line represents the genome of one isolate from patient P13 (A) and patient P01 (B). Each isolate genome is arranged chronologically, with the earliest isolate at the top and the last isolate at the bottom of the figure. Each replicon is represented by a different color. Genome deletions are represented by the offset bars below each chromosome. (C) Histogram of number of recurrent gene loss (teal) and gene gain (purple) observed in two or more patients.
By using the Roary gene presence matrix (homologous clusters) (Page et al. 2015), we found 8409 genes lost from at least one longitudinal series (Fig. 6C). We identified recurrent deletion of 3964 genes from at least two patient series over time, and 509 genes were lost in at least five patient series (Fig. 6C; Supplemental File S12). It is important to note that polarizing gene losses based on the earliest sampled isolate may not always be appropriate, since it might not reflect the most “ancestral” genome. However, we observed recurrent gains in substantially fewer patient series than losses, 572 gains in two series and 102 genes in only five series (Supplemental File S13); this suggests that choosing the earliest isolated strain was usually appropriate. Highly recurrent losses include putative virulence genes such as aiiA (group_8669; N-acyl homoserine lactonase), mdtO (group_10148; multidrug resistance), luxO (group_5898) and gmr (group_19364; cell–cell communication), and hrp1 (group_24751; hypoxic response), while the majority of recurrent gene losses were hypothetical proteins (Fig. 6A,B; Supplemental File S12).
Genetic diversity contributes to phenotypic diversity
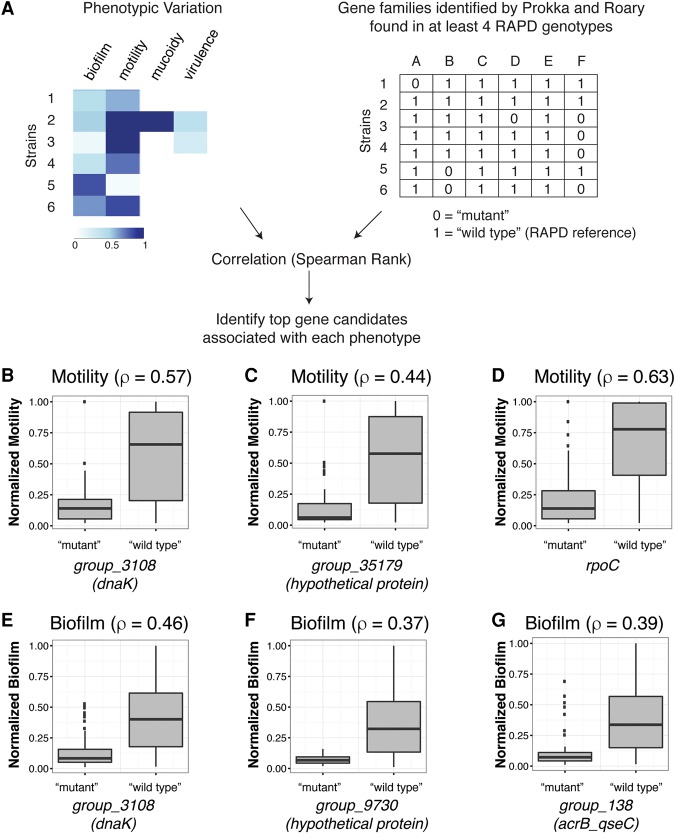
The phenotypic variation among isolates from the same patient (Fig. 5) must reflect underlying genetic (or epigenetic) variation. To test for associations between genetic variants and phenotypic differences, we used the Spearman-ranked correlation for motility and biofilm formation. We simplified our data into two matrices: (1) a binary genotype matrix defining the allele of each protein-coding gene in each strain as “wild type” or “mutant,” and (2) a quantitative matrix based on the phenotypic measurements (Fig. 7A; see Methods and Supplemental Text S4). To build the genotype matrix, we defined “mutant” (0) as any allele affected by deletions, nonsense, or missense changes relative to the appropriate PacBio reference genome (i.e., that of the matching RAPD at the earliest available time point), whereas “wild-type” alleles were those matching the reference or with only silent substitutions. These simplifications assume that the reference used represents the ancestral wild-type allele and that any mutation affecting coding results in loss of function. We thus focused on motility and biofilm, because these two phenotypes were typically high for the isolates used as reference genomes and at the start of the longitudinal series (i.e., early isolates tended to have high swimming motility and produce robust biofilms) (see Methods and Supplemental File S14).
Figure 7.
Genetic association testing identifies candidate gene families for the observed phenotypic variation. (A) We generated two matrices, one representing the phenotypic variation and the other the genotypic variation where we defined the variation for each isolate with respect to its RAPD reference, with 1 = “wild type” and 0 = “mutant,” i.e., any allele affected by deletion, nonsense, or missense mutations compared with the appropriate RAPD PacBio reference sequence from the earliest time point. Spearman rank correlation found genes that were highly correlated with either motility (examples in B–D) or biofilm (examples in E–G).
These correlations identified numerous genes associated with swimming motility and biofilm formation (Supplemental File S14). Within the top motility candidate genes are a number of known regulators of motility, including dnaK (ρ = 0.57, group_ 3108) (Fig. 7B), cadA (ρ = 0.46), cheA (ρ = 0.41), and aer (ρ = 0.41). In Escherichia coli, DnaK (also known as the heat shock protein 70) is a molecular chaperone required for flagellar synthesis and diverse stress responses (Shi et al. 1992). We identified other regulatory genes, including rpoC (ρ = 0.63) (Fig. 7D), yecS (ρ = 0.49), and zraR (ρ = 0.29), as well as hypothetical proteins with unknown function (ρ = 0.44) (Fig. 7C) that were also associated with motility variation.
Several candidate genes associated with the motility phenotype are also associated with biofilm formation, including dnaK (Fig. 7E), papC, gcvA, and qseC (ρ = 0.46, 0.38, 0.38, and 0.39, respectively). These four genes have been implicated in biofilm formation (Novais et al. 2013; Yang et al. 2014; Arita-Morioka et al. 2015). In three of the genes—dnaK, papC, and gcvA—gene loss alone was correlated with less motility and less biofilm formation (Supplemental Text S4; Supplemental Figs. S14, S15), suggesting they may regulate both phenotypes in B. cenocepacia.
Discussion
Resource for comparative genomics and genome assembly pipelines
Prior to our study, there were 26 publicly available B. cenocepacia genomes. Our data increase the number of genomes available to 241 across major epidemic lineages (including 11 reference quality assembles), which will serve as a valuable resource for future comparative genomic and transcriptomic analyses and expand our understanding of B. cenocepacia epidemics beyond the ET12 (RAPD02) lineage. Furthermore, the use of both Illumina short-read and PacBio long-read sequencing on a subset of strains provides a useful test data set for optimizing assembly algorithms, particularly for hybrid assembly of both data types together and for evaluating sources of assembly errors.
Genome-wide association studies
In contrast to most comparative genomics studies, we directly evaluated clinically important phenotypes for the full strain collection. By using a simple Spearman rank correlation approach, we identified a number of candidate genes (dnaK, papC, gcvA, and qseC) that are highly associated with both the motility and biofilm phenotypes. Genes that regulate these clinically relevant traits could be promising targets for anti-virulence agents. Myricetin, a small molecule inhibitor of DnaK, prevents biofilm formation without inhibiting bacterial growth (Arita-Morioka et al. 2015). We expect the number of applications of this combined genotype–phenotype resource will be large; for example, more sophisticated machine learning analyses could consider how combinations of genes contribute to the observed phenotypes.
Experimental evolution
Previous experimental evolution studies with B. cenocepacia strain HI2424 (subgroup B) found that lines evolved over 1000 generations to have increased biofilm formation had lost motility, suggesting an evolutionary trade-off between these two phenotypes (Traverse et al. 2013; Cooper 2014; Cooper et al. 2014). Consistent with this in vitro finding, subgroup B isolates from patient P09 showed an inverse correlation between the two phenotypes. In contrast, in subgroup A isolates, we observed a strong positive correlation between biofilm and motility. This raises the interesting possibility that the genetic architecture of these traits is quite different between the two subgroups, and we hypothesize that similar experiments in a distinct genetic background could reveal distinct phenotypic correlations in evolved lines.
Clinical significance
Our phenotypic analyses showed extensive variation among B. cenocepacia isolates both within and among RAPD types and patient series. Strains from a given RAPD type were more similar phenotypically but still showed considerable variation, even among closely related strains. Within a subset of longitudinal series, we observed temporal trends toward decreasing motility, biofilm formation, acute virulence, and growth rate. These findings may be useful for clinical microbiologists in associating potential virulence traits with standard molecular diagnostic testing.
Previous genotyping methods suggested that chronic B. cenocepacia infections in CF patients result from the colonization of a few genetically “clonal” bacterial strains (Romling et al. 1994a,b). We now know there can be a large phenotypic and genotypic diversity within a single patient at any sampling point (Smith et al. 2006; Clark et al. 2015; Darch et al. 2015). For instance, a random sampling of 44 P. aeruginosa colonies from a single sputum sample of a clinically stable CF patient showed a wide range of phenotypes, from variations in protease and exotoxin productions to antibiotic susceptibility (Darch et al. 2015). Consistent with this, we observed broad phenotypic and genotypic variation for B. cenocepacia isolates obtained from the same patient at the same time point (Zlosnik et al. 2014; Clark et al. 2015). We thus emphasize the value of bacterial isolate collections that not only sample longitudinally but also sample populations at single time points, irrespective of observed variation of colony morphology.
In summary, we compiled a comprehensive genotype and phenotype resource of 215 B. cenocepacia genomes, along with an extensive phenotypic data set, that emphasizes the importance of both in understanding the role of different strains in disease progression in chronic infections. We expect this rich resource will provide for interrogating clinical isolates of B. cenocepacia both to address basic biological questions about how bacteria evolve within infections and to help characterize future outbreaks.
Methods
DNA extraction and genome sequencing
Genomic DNA was extracted from B. cenocepacia cultures using the Puregene Gentra archival bacterial DNA extraction kit (Qiagen). Multiplexed sequencing libraries were made using the Illumina Nextera XT DNA sample prep kit (Illumina). Sequencing was performed with single-end and paired-end reads at the UBC Sequencing Centre (University of British Columbia) to a minimum read depth of 60×. PacBio sequencing was performed using two SMRTcells per isolate with P4-C2 chemistry at the Clinical and Translational Research Institute Genomics Core Facility (Drexel University).
Clinical isolate collection
Clinical data for all patients in this study were previously collected, as approved by the UBC Research Ethics Boards (H07-01396) (Zlosnik et al. 2011).
Phenotypic analyses
In vitro growth assays in LB and SCFM
B. cenocepacia isolates were grown in one-half strength LB at 37°C overnight, washed with 10 mM MgSO4, and inoculated into either one-half LB or SCFM (Palmer et al. 2007) at OD600 = 0.1, in clear, flat-bottom 96-well microtiter plates.
Biofilm assay
We tested the ability of B. cenocepacia strains to form biofilm following a previously established protocol (O'Toole and Kolter 1998; Conway et al. 2002). Biofilm assays were conducted in 96-well polypropylene microtiter dishes containing SCFM (Palmer et al. 2007).
Mucoid phenotype classification
B. cenocepacia isolates were streaked to yeast extract mannitol media, and mucoidy phenotype was assessed following a previously established protocol (Zlosnik and Speert 2010; Zlosnik et al. 2011, 2015).
Motility assay
The swimming motility for each isolate was individually measured using the motility agar (0.3% LB agar plates) as previously described (Zlosnik et al. 2015).
Galleria mellonella killing assay
Fresh overnight cultures of B. cenocepacia isolates were grown in one-half strength LB, pelleted, and washed with 10 mM MgSO4. Each larva was injected with 10 μL of 106 or 107 cfu/mL (equivalent of 104 or 105 cfu, respectively) of bacteria plus 1.2 mg/mL of ampicillin to the hindmost left proleg using the BD ultra-fine II insulin syringe (Van Leene et al. 2007).
Statistical analyses
All phenotypic data were analyzed in R (R Core Team 2016). For details, see Supplemental Methods.
De novo genome assembly
We assembled B. cenocepacia genomes from Illumina reads using a custom assembly pipeline, which includes Trimmomatic-v0.30 (Bolger et al. 2014), COPE-v1.1.2 (Liu et al. 2012), ALLPATHS-LG (Butler et al. 2008), and Ray-v2.2.0 assembler (Boisvert et al. 2012).
For PacBio-sequenced isolates (Bcc001, Bcc022, Bcc023, Bcc030, Bcc116, Bcc129, Bcc137, Bcc173, Bcc174, Bcc179, Bcc201, and J2315), the PacBio reads were assembled with the HGAP assembler and the consensus sequence polishing by the Quiver algorithm (Chin et al. 2013) using the SMRT Analysis Suite (Pacific Biosciences) and circulated with Circlator (Hunt et al. 2015). Base modification analysis was performed with the SMRT Analysis Suite using standard mapping protocols. All assembled genomes were annotated with the rapid prokaryotic genome annotation pipeline, Prokka, v1.12 (Seemann 2014).
Pan-genome analyses
Pan-genome analyses for all isolates with fewer than 500 contigs or for each RAPD genotype were performed using the rapid large-scale prokaryote pan-genome analysis pipeline, Roary, v3.4.2, from the Sanger Institute (https://github.com/sanger-pathogens/Roary; Page et al. 2015).
Estimating population structure and phylogeny
Core-genome SNPs were extracted from the Roary core genome alignment for each RAPD genotype or for all 215 isolates using the SNP Sites program, v2.0.2, from the Sanger Institute (https://github.com/sanger-pathogens/snp_sites). These SNPs were used as input for maximum likelihood inference with RAxML, v8.2.0 (Stamatakis 2014). Phenotypic data were mapped onto the maximum-likelihood tree using the plotTree.R script (https://github.com/katholt/plotTree; Inouye et al. 2014).
Variant calling and genome loss
Illumina reads were aligned to the NCBI or PacBio RAPD reference genome using the short-read aligner BWA, v0.7.9a (Li and Durbin 2009). Single-nucleotide variants were identified and filtered with the SAMtools toolbox, v1.1 (Li et al. 2009). We kept any variant locations with at least 80% of the mapped reads agreeing with the variant call and a root mean square mapping quality of ≥30.
Identification of candidate genotype–phenotype associations
To identify variants that are associated with a phenotypic variation, we first identified 3055 gene families that were present in at least four RAPD genotypes as defined by Prokka (Seemann 2014) and Roary (Page et al. 2015). We excluded RAPD15 from the analyses due to small sample size (two isolates total). We generated a matrix of presence (one) versus absent (zero) genes, where we arbitrarily defined absent genes as any gene affected by small indels, nonsense and missense mutations, or deletions detected via our read coverage analysis described in the previous section. We performed Spearman's rank correlation between the phenotype and genotype matrices in order to find genes most strongly associated with each individual phenotype.
Data access
The raw sequence data from this study have been submitted to the NCBI BioProject (http://www.ncbi.nlm.nih.gov/bioproject) under accession number PRJNA289138 and can be accessed from the Sequence Read Archive (SRA; https://www.ncbi.nlm.nih.gov/sra) with accession number SRP075474. This Whole Genome project has been submitted to the DDBJ/ENA/GenBank (https://www.ncbi.nlm.nih.gov/genbank/) under the accession numbers MUJN00000000–MUJS00000000, MUPR00000000–MUWY00000000, and CP019664–CP019678.
Supplementary Material
Acknowledgments
We thank Samantha Lui and Dana Brand for technical assistance, as well as the Canadian Burkholderia cepacia Complex Research and Referral Repository for the strain collection. We also thank several colleagues for helpful discussions and advice: David Speert, Vaughan Cooper, Jennifer Gardy, Andrew Page, Torsten Seemann, Jeffrey Barrick, Kat Holt, and Joshua P. Earl. C.N.’s laboratory is supported by grants from Genome British Columbia, National Aeronautics and Space Administration, and The UBC Faculty of Pharmacy. J.E.A.Z. and the Canadian Burkholderia cepacia Complex Research and Referral Repository are supported by grants from Cystic Fibrosis Canada. Funding to G.D.E. is from the National Institutes of Health (R01 NIDCD DC02148).
Author contributions: A.H.L., J.E.A.Z., C.N., and J.C.M. conceived and designed the experiments. A.H.L., J.E.A.Z., S.S., S.B., and A.P. performed the experiments. A.H.L., S.F., J.C.M., R.L.E., and C.N. analyzed the data. J.E.A.Z., C.N., and G.D.E. contributed reagent and materials. A.H.L., J.C.M., C.N., S.F., S.S., and G.D.E. wrote the paper.
Footnotes
[Supplemental material is available for this article.]
Article published online before print. Article, supplemental material, and publication date are at http://www.genome.org/cgi/doi/10.1101/gr.213363.116.
Freely available online through the Genome Research Open Access option.
References
- Arita-Morioka K, Yamanaka K, Mizunoe Y, Ogura T, Sugimoto S. 2015. Novel strategy for biofilm inhibition by using small molecules targeting molecular chaperone DnaK. Antimicrob Agents Chemother 59: 633–641. [DOI] [PMC free article] [PubMed] [Google Scholar]
- Bhatt JM. 2013. Treatment of pulmonary exacerbations in cystic fibrosis. Eur Respir Rev 22: 205–216. [DOI] [PMC free article] [PubMed] [Google Scholar]
- Biller JA. 2015. Inhaled antibiotics: the new era of personalized medicine? Curr Opin Pulm Med 21: 596–601. [DOI] [PubMed] [Google Scholar]
- Boisvert S, Laviolette F, Corbeil J. 2010. Ray: simultaneous assembly of reads from a mix of high-throughput sequencing technologies. J Comput Biol 17: 1519–1533. [DOI] [PMC free article] [PubMed] [Google Scholar]
- Boisvert S, Raymond F, Godzaridis E, Laviolette F, Corbeil J. 2012. Ray Meta: scalable de novo metagenome assembly and profiling. Genome Biol 13: R122. [DOI] [PMC free article] [PubMed] [Google Scholar]
- Bolger AM, Lohse M, Usadel B. 2014. Trimmomatic: a flexible trimmer for Illumina sequence data. Bioinformatics 30: 2114–2120. [DOI] [PMC free article] [PubMed] [Google Scholar]
- Butler J, MacCallum I, Kleber M, Shlyakhter IA, Belmonte MK, Lander ES, Nusbaum C, Jaffe DB. 2008. ALLPATHS: de novo assembly of whole-genome shotgun microreads. Genome Res 18: 810–820. [DOI] [PMC free article] [PubMed] [Google Scholar]
- Cant N, Pollock N, Ford RC. 2014. CFTR structure and cystic fibrosis. Int J Biochem Cell Biol 52: 15–25. [DOI] [PubMed] [Google Scholar]
- Chin CS, Alexander DH, Marks P, Klammer AA, Drake J, Heiner C, Clum A, Copeland A, Huddleston J, Eichler EE, et al. 2013. Nonhybrid, finished microbial genome assemblies from long-read SMRT sequencing data. Nat Methods 10: 563–569. [DOI] [PubMed] [Google Scholar]
- Clark ST, Diaz Caballero J, Cheang M, Coburn B, Wang PW, Donaldson SL, Zhang Y, Liu M, Keshavjee S, Yau YC, et al. 2015. Phenotypic diversity within a Pseudomonas aeruginosa population infecting an adult with cystic fibrosis. Sci Rep 5: 10932. [DOI] [PMC free article] [PubMed] [Google Scholar]
- Conway BA, Venu V, Speert DP. 2002. Biofilm formation and acyl homoserine lactone production in the Burkholderia cepacia complex. J Bacteriol 184: 5678–5685. [DOI] [PMC free article] [PubMed] [Google Scholar]
- Cooper VS. 2014. The origins of specialization: insights from bacteria held 25 years in captivity. PLoS Biol 12: e1001790. [DOI] [PMC free article] [PubMed] [Google Scholar]
- Cooper VS, Staples RK, Traverse CC, Ellis CN. 2014. Parallel evolution of small colony variants in Burkholderia cenocepacia biofilms. Genomics 104: 447–452. [DOI] [PubMed] [Google Scholar]
- Coutinho CP, de Carvalho CC, Madeira A, Pinto-de-Oliveira A, Sa-Correia I. 2011a. Burkholderia cenocepacia phenotypic clonal variation during a 3.5-year colonization in the lungs of a cystic fibrosis patient. Infect Immun 79: 2950–2960. [DOI] [PMC free article] [PubMed] [Google Scholar]
- Coutinho CP, Dos Santos SC, Madeira A, Mira NP, Moreira AS, Sa-Correia I. 2011b. Long-term colonization of the cystic fibrosis lung by Burkholderia cepacia complex bacteria: epidemiology, clonal variation, and genome-wide expression alterations. Front Cell Infect Microbiol 1: 12. [DOI] [PMC free article] [PubMed] [Google Scholar]
- Cunha MV, Leitao JH, Mahenthiralingam E, Vandamme P, Lito L, Barreto C, Salgado MJ, Sa-Correia I. 2003. Molecular analysis of Burkholderia cepacia complex isolates from a Portuguese cystic fibrosis center: a 7-year study. J Clin Microbiol 41: 4113–4120. [DOI] [PMC free article] [PubMed] [Google Scholar]
- Darch SE, McNally A, Harrison F, Corander J, Barr HL, Paszkiewicz K, Holden S, Fogarty A, Crusz SA, Diggle SP. 2015. Recombination is a key driver of genomic and phenotypic diversity in a Pseudomonas aeruginosa population during cystic fibrosis infection. Sci Rep 5: 7649. [DOI] [PMC free article] [PubMed] [Google Scholar]
- Didelot X, Walker AS, Peto TE, Crook DW, Wilson DJ. 2016. Within-host evolution of bacterial pathogens. Nat Rev Microbiol 14: 150–162. [DOI] [PMC free article] [PubMed] [Google Scholar]
- Dillon MM, Sung W, Lynch M, Cooper VS. 2015. The rate and molecular spectrum of spontaneous mutations in the GC-rich multichromosome genome of Burkholderia cenocepacia. Genetics 200: 935–946. [DOI] [PMC free article] [PubMed] [Google Scholar]
- Dubarry N, Pasta F, Lane D. 2006. ParABS systems of the four replicons of Burkholderia cenocepacia: new chromosome centromeres confer partition specificity. J Bacteriol 188: 1489–1496. [DOI] [PMC free article] [PubMed] [Google Scholar]
- Filkins LM, O'Toole GA. 2015. Cystic fibrosis lung infections: polymicrobial, complex, and hard to treat. PLoS Pathog 11: e1005258. [DOI] [PMC free article] [PubMed] [Google Scholar]
- Furukawa S, Kuchma SL, O'Toole GA. 2006. Keeping their options open: acute versus persistent infections. J Bacteriol 188: 1211–1217. [DOI] [PMC free article] [PubMed] [Google Scholar]
- Govan J, Brown PH, Maddison J, Doherty CJ, Nelson JW, Dodd M, Greening AP, Webb AK. 1993. Evidence for transmission of Pseudomonas cepacia by social contact in cystic fibrosis. Lancet 342: 15–19. [DOI] [PubMed] [Google Scholar]
- Griesenbach U, Alton EW. 2015. Recent advances in understanding and managing cystic fibrosis transmembrane conductance regulator dysfunction. F1000Prime Rep 7: 64. [DOI] [PMC free article] [PubMed] [Google Scholar]
- Hogg JS, Hu FZ, Janto B, Boissy R, Hayes J, Keefe R, Post JC, Ehrlich GD. 2007. Characterization and modeling of the Haemophilus influenzae core and supragenomes based on the complete genomic sequences of Rd and 12 clinical nontypeable strains. Genome Biol 8: R103. [DOI] [PMC free article] [PubMed] [Google Scholar]
- Holden MT, Seth-Smith HM, Crossman LC, Sebaihia M, Bentley SD, Cerdeno-Tarraga AM, Thomson NR, Bason N, Quail MA, Sharp S, et al. 2009. The genome of Burkholderia cenocepacia J2315, an epidemic pathogen of cystic fibrosis patients. J Bacteriol 191: 261–277. [DOI] [PMC free article] [PubMed] [Google Scholar]
- Huang YJ, LiPuma JJ. 2016. The microbiome in cystic fibrosis. Clin Chest Med 37: 59–67. [DOI] [PMC free article] [PubMed] [Google Scholar]
- Hunt M, De Silva N, Otto TD, Parkhill J, Keane JA, Harris SR. 2015. Circlator: automated circularization of genome assemblies using long sequencing reads. Genome Biol 16: 294. [DOI] [PMC free article] [PubMed] [Google Scholar]
- Huse HK, Kwon T, Zlosnik JEA, Speert DP, Marcotte EM, Whiteley M. 2010. Parallel evolution in Pseudomonas aeruginosa over 39,000 generations in vivo. mBio 1: e00199–10. [DOI] [PMC free article] [PubMed] [Google Scholar]
- Inouye M, Dashnow H, Raven LA, Schultz MB, Pope BJ, Tomita T, Zobel J, Holt KE. 2014. SRST2: rapid genomic surveillance for public health and hospital microbiology labs. Genome Med 6: 90. [DOI] [PMC free article] [PubMed] [Google Scholar]
- Isles A, Maclusky I, Corey M, Gold R, Prober C, Fleming P, Levison H. 1984. Pseudomonas cepacia infection in cystic fibrosis: an emerging problem. J Pediatr 104: 206–210. [DOI] [PubMed] [Google Scholar]
- Johnson WM. 1994. Intercontinental spread of a highly transmissible clone of Pseudomonas cepacia proved by multilocus enzyme electrophoresis and ribotyping. Can J Infect Dis 5: 86–88. [DOI] [PMC free article] [PubMed] [Google Scholar]
- Jones AM, Dodd ME, Govan JR, Barcus V, Doherty CJ, Morris J, Webb AK. 2004. Burkholderia cenocepacia and Burkholderia multivorans: influence on survival in cystic fibrosis. Thorax 59: 948–951. [DOI] [PMC free article] [PubMed] [Google Scholar]
- Li H, Durbin R. 2009. Fast and accurate short read alignment with Burrows–Wheeler transform. Bioinformatics 25: 1754–1760. [DOI] [PMC free article] [PubMed] [Google Scholar]
- Li H, Handsaker B, Wysoker A, Fennell T, Ruan J, Homer N, Marth G, Abecasis G, Durbin R; 1000 Genome Project Data Processing Subgroup. 2009. The Sequence Alignment/Map format and SAMtools. Bioinformatics 25: 2078–2079. [DOI] [PMC free article] [PubMed] [Google Scholar]
- Lieberman TD, Michel JB, Aingaran M, Potter-Bynoe G, Roux D, Davis MR Jr, Skurnik D, Leiby N, LiPuma JJ, Goldberg JB, et al. 2011. Parallel bacterial evolution within multiple patients identifies candidate pathogenicity genes. Nat Genet 43: 1275–1280. [DOI] [PMC free article] [PubMed] [Google Scholar]
- Lieberman TD, Flett KB, Yelin I, Martin TR, McAdam AJ, Priebe GP, Kishony R. 2014. Genetic variation of a bacterial pathogen within individuals with cystic fibrosis provides a record of selective pressures. Nat Genet 46: 82–87. [DOI] [PMC free article] [PubMed] [Google Scholar]
- Lipuma JJ. 2005. Update on the Burkholderia cepacia complex. Curr Opin Pulm Med 11: 528–533. [DOI] [PubMed] [Google Scholar]
- Lipuma JJ. 2010. The changing microbial epidemiology in cystic fibrosis. Clin Microbiol Rev 23: 299–323. [DOI] [PMC free article] [PubMed] [Google Scholar]
- Liu B, Yuan J, Yiu SM, Li Z, Xie Y, Chen Y, Shi Y, Zhang H, Li Y, Lam TW, et al. 2012. COPE: an accurate k-mer-based pair-end reads connection tool to facilitate genome assembly. Bioinformatics 28: 2870–2874. [DOI] [PubMed] [Google Scholar]
- Lobo LJ, Tulu Z, Aris RM, Noone PG. 2015. Pan-resistant Achromobacter xylosoxidans and Stenotrophomonas maltophilia infection in cystic fibrosis does not reduce survival after lung transplantation. Transplantation 99: 2196–2202. [DOI] [PubMed] [Google Scholar]
- Mahenthiralingam E, Campbell ME, Foster J, Lam JS, Speert DP. 1996. Random amplified polymorphic DNA typing of Pseudomonas aeruginosa isolates recovered from patients with cystic fibrosis. J Clin Microbiol 34: 1129–1135. [DOI] [PMC free article] [PubMed] [Google Scholar]
- Mahenthiralingam E, Bischof J, Byrne SK, Radomski C, Davies JE, Av-Gay Y, Vandamme P. 2000. DNA-Based diagnostic approaches for identification of Burkholderia cepacia complex, Burkholderia vietnamiensis, Burkholderia multivorans, Burkholderia stabilis, and Burkholderia cepacia genomovars I and III. J Clin Microbiol 38: 3165–3173. [DOI] [PMC free article] [PubMed] [Google Scholar]
- Mahenthiralingam E, Vandamme P, Campbell ME, Henry DA, Gravelle AM, Wong LT, Davidson AG, Wilcox PG, Nakielna B, Speert DP. 2001. Infection with Burkholderia cepacia complex genomovars in patients with cystic fibrosis: Virulent transmissible strains of genomovar III can replace Burkholderia multivorans. Clin Infect Dis 33: 1469–1475. [DOI] [PubMed] [Google Scholar]
- Markussen T, Marvig RL, Gomez-Lozano M, Aanaes K, Burleigh AE, Hoiby N, Johansen HK, Molin S, Jelsbak L. 2014. Environmental heterogeneity drives within-host diversification and evolution of Pseudomonas aeruginosa. mBio 5: e01592–14. [DOI] [PMC free article] [PubMed] [Google Scholar]
- Marvig RL, Johansen HK, Molin S, Jelsbak L. 2013. Genome analysis of a transmissible lineage of pseudomonas aeruginosa reveals pathoadaptive mutations and distinct evolutionary paths of hypermutators. PLoS Genet 9: e1003741. [DOI] [PMC free article] [PubMed] [Google Scholar]
- Marvig RL, Sommer LM, Molin S, Johansen HK. 2015. Convergent evolution and adaptation of Pseudomonas aeruginosa within patients with cystic fibrosis. Nat Genet 47: 57–64. [DOI] [PubMed] [Google Scholar]
- McDowell A, Mahenthiralingam E, Dunbar KE, Moore JE, Crowe M, Elborn JS. 2004. Epidemiology of Burkholderia cepacia complex species recovered from cystic fibrosis patients: issues related to patient segregation. J Med Microbiol 53: 663–668. [DOI] [PubMed] [Google Scholar]
- Medini D, Donati C, Tettelin H, Masignani V, Rappuoli R. 2005. The microbial pan-genome. Curr Opin Genet Dev 15: 589–594. [DOI] [PubMed] [Google Scholar]
- Miller RR, Hird TJ, Tang P, Zlosnik JE. 2015. Whole-genome sequencing of three clonal clinical isolates of B. cenocepacia from a patient with cystic fibrosis. PLoS One 10: e0143472. [DOI] [PMC free article] [PubMed] [Google Scholar]
- Murray S, Charbeneau J, Marshall BC, LiPuma JJ. 2008. Impact of Burkholderia infection on lung transplantation in cystic fibrosis. Am J Respir Crit Care Med 178: 363–371. [DOI] [PubMed] [Google Scholar]
- Novais A, Vuotto C, Pires J, Montenegro C, Donelli G, Coque TM, Peixe L. 2013. Diversity and biofilm-production ability among isolates of Escherichia coli phylogroup D belonging to ST69, ST393 and ST405 clonal groups. BMC Microbiol 13: 144. [DOI] [PMC free article] [PubMed] [Google Scholar]
- O'Toole GA, Kolter R. 1998. Initiation of biofilm formation in Pseudomonas fluorescens WCS365 proceeds via multiple, convergent signalling pathways: a genetic analysis. Mol Microbiol 28: 449–461. [DOI] [PubMed] [Google Scholar]
- Page AJ, Cummins CA, Hunt M, Wong VK, Reuter S, Holden MT, Fookes M, Falush D, Keane JA, Parkhill J. 2015. Roary: rapid large-scale prokaryote pan genome analysis. Bioinformatics 31: 3691–3693. [DOI] [PMC free article] [PubMed] [Google Scholar]
- Palmer KL, Aye LM, Whiteley M. 2007. Nutritional cues control Pseudomonas aeruginosa multicellular behavior in cystic fibrosis sputum. J Bacteriol 189: 8079–8087. [DOI] [PMC free article] [PubMed] [Google Scholar]
- Parkins MD, Floto RA. 2015. Emerging bacterial pathogens and changing concepts of bacterial pathogenesis in cystic fibrosis. J Cyst Fibros 14: 293–304. [DOI] [PubMed] [Google Scholar]
- Pretto L, de-Paris F, Mombach Pinheiro Machado AB, Francisco Martins A, Barth AL. 2013. Genetic similarity of Burkholderia cenocepacia from cystic fibrosis patients. Braz J Infect Dis 17: 86–89. [DOI] [PMC free article] [PubMed] [Google Scholar]
- Price EP, Sarovich DS, Mayo M, Tuanyok A, Drees KP, Kaestli M, Beckstrom-Sternberg SM, Babic-Sternberg JS, Kidd TJ, Bell SC, et al. 2013. Within-host evolution of Burkholderia pseudomallei over a twelve-year chronic carriage infection. mBio 4: e00388–13. [DOI] [PMC free article] [PubMed] [Google Scholar]
- R Core Team. 2016. R: a language and environment for statistical computing. R Foundation for Statistical Computing, Vienna, Austria: https://www.R-project.org/. [Google Scholar]
- Rau MH, Marvig RL, Ehrlich GD, Molin S, Jelsbak L. 2012. Deletion and acquisition of genomic content during early stage adaptation of Pseudomonas aeruginosa to a human host environment. Environ Microbiol 14: 2200–2211. [DOI] [PubMed] [Google Scholar]
- Riordan JR, Rommens JM, Kerem B, Alon N, Rozmahel R, Grzelczak Z, Zielenski J, Lok S, Plavsic N, Chou JL, et al. 1989. Identification of the cystic fibrosis gene: cloning and characterization of complementary DNA. Science 245: 1066–1073. [DOI] [PubMed] [Google Scholar]
- Romling U, Fiedler B, Bosshammer J, Grothues D, Greipel J, von der Hardt H, Tummler B. 1994a. Epidemiology of chronic Pseudomonas aeruginosa infections in cystic fibrosis. J Infect Dis 170: 1616–1621. [DOI] [PubMed] [Google Scholar]
- Romling U, Wingender J, Muller H, Tummler B. 1994b. A major Pseudomonas aeruginosa clone common to patients and aquatic habitats. Appl Environ Microbiol 60: 1734–1738. [DOI] [PMC free article] [PubMed] [Google Scholar]
- Rozee KR, Haase D, Macdonald NE, Johnson WM. 1994. Comparison by extended ribotyping of Pseudomonas cepacia isolated from cystic fibrosis patients with acute and chronic infections. Diagn Microbiol Infect Dis 20: 181–186. [DOI] [PubMed] [Google Scholar]
- Seemann T. 2014. Prokka: rapid prokaryotic genome annotation. Bioinformatics 30: 2068–2069. [DOI] [PubMed] [Google Scholar]
- Sharma P, Gupta SK, Rolain JM. 2014. Whole genome sequencing of bacteria in cystic fibrosis as a model for bacterial genome adaptation and evolution. Expert Rev Anti Infect Ther 12: 343–355. [DOI] [PubMed] [Google Scholar]
- Shen K, Antalis P, Gladitz J, Sayeed S, Ahmed A, Yu S, Hayes J, Johnson S, Dice B, Dopico R, et al. 2005. Identification, distribution, and expression of novel genes in 10 clinical isolates of nontypeable Haemophilus influenzae. Infect Immun 73: 3479–3491. [DOI] [PMC free article] [PubMed] [Google Scholar]
- Shi W, Zhou Y, Wild J, Adler J, Gross CA. 1992. DnaK, DnaJ, and GrpE are required for flagellum synthesis in Escherichia coli. J Bacteriol 174: 6256–6263. [DOI] [PMC free article] [PubMed] [Google Scholar]
- Silva IN, Santos PM, Santos MR, Zlosnik JEA, Speert DP, Buskirk SW, Bruger EL, Waters CM, Cooper VS, Moreira LM. 2016. Long-term evolution of Burkholderia multivorans during a chronic cystic fibrosis infection reveals shifting forces of selection. mSystems 1: e00029–16. [DOI] [PMC free article] [PubMed] [Google Scholar]
- Smith EE, Buckley DG, Wu Z, Saenphimmachak C, Hoffman LR, D'Argenio DA, Miller SI, Ramsey BW, Speert DP, Moskowitz SM, et al. 2006. Genetic adaptation by Pseudomonas aeruginosa to the airways of cystic fibrosis patients. Proc Natl Acad Sci 103: 8487–8492. [DOI] [PMC free article] [PubMed] [Google Scholar]
- Speert DP. 2002. Advances in Burkholderia cepacia complex. Paediatr Respir Rev 3: 230–235. [DOI] [PubMed] [Google Scholar]
- Speert DP, Campbell ME, Henry DA, Milner R, Taha F, Gravelle A, Davidson AG, Wong LT, Mahenthiralingam E. 2002a. Epidemiology of Pseudomonas aeruginosa in cystic fibrosis in British Columbia, Canada. Am J Respir Crit Care Med 166: 988–993. [DOI] [PubMed] [Google Scholar]
- Speert DP, Henry D, Vandamme P, Corey M, Mahenthiralingam E. 2002b. Epidemiology of Burkholderia cepacia complex in patients with cystic fibrosis, Canada. Emerg Infect Dis 8: 181–187. [DOI] [PMC free article] [PubMed] [Google Scholar]
- St Denis M, Ramotar K, Vandemheen K, Tullis E, Ferris W, Chan F, Lee C, Slinger R, Aaron SD. 2007. Infection with Burkholderia cepacia complex bacteria and pulmonary exacerbations of cystic fibrosis. Chest 131: 1188–1196. [DOI] [PubMed] [Google Scholar]
- Stamatakis A. 2014. RAxML version 8: a tool for phylogenetic analysis and post-analysis of large phylogenies. Bioinformatics 30: 1312–1313. [DOI] [PMC free article] [PubMed] [Google Scholar]
- Traverse CC, Mayo-Smith LM, Poltak SR, Cooper VS. 2013. Tangled bank of experimentally evolved Burkholderia biofilms reflects selection during chronic infections. Proc Natl Acad Sci 110: E250–E259. [DOI] [PMC free article] [PubMed] [Google Scholar]
- Van Leene J, Stals H, Eeckhout D, Persiau G, Van De Slijke E, Van Isterdael G, De Clercq A, Bonnet E, Laukens K, Remmerie N, et al. 2007. A tandem affinity purification-based technology platform to study the cell cycle interactome in Arabidopsis thaliana. Mol Cell Proteomics 6: 1226–1238. [DOI] [PubMed] [Google Scholar]
- Vandamme P, Holmes B, Vancanneyt M, Coenye T, Hoste B, Coopman R, Revets H, Lauwers S, Gillis M, Kersters K, et al. 1997. Occurrence of multiple genomovars of Burkholderia cepacia in cystic fibrosis patients and proposal of Burkholderia multivorans sp. nov. Int J Syst Bacteriol 47: 1188–1200. [DOI] [PubMed] [Google Scholar]
- Vonberg RP, Haussler S, Vandamme P, Steinmetz I. 2006. Identification of Burkholderia cepacia complex pathogens by rapid-cycle PCR with fluorescent hybridization probes. J Med Microbiol 55: 721–727. [DOI] [PubMed] [Google Scholar]
- Wu H, Moser C, Wang HZ, Hoiby N, Song ZJ. 2015. Strategies for combating bacterial biofilm infections. Int J Oral Sci 7: 1–7. [DOI] [PMC free article] [PubMed] [Google Scholar]
- Yang L, Jelsbak L, Marvig RL, Damkiaer S, Workman CT, Rau MH, Hansen SK, Folkesson A, Johansen HK, Ciofu O, et al. 2011. Evolutionary dynamics of bacteria in a human host environment. Proc Natl Acad Sci 108: 7481–7486. [DOI] [PMC free article] [PubMed] [Google Scholar]
- Yang K, Meng J, Huang YC, Ye LH, Li GJ, Huang J, Chen HM. 2014. The role of the QseC quorum-sensing sensor kinase in epinephrine-enhanced motility and biofilm formation by Escherichia coli. Cell Biochem Biophys 70: 391–398. [DOI] [PubMed] [Google Scholar]
- Zlosnik JE, Speert DP. 2010. The role of mucoidy in virulence of bacteria from the Burkholderia cepacia complex: a systematic proteomic and transcriptomic analysis. J Infect Dis 202: 770–781. [DOI] [PubMed] [Google Scholar]
- Zlosnik JE, Costa PS, Brant R, Mori PY, Hird TJ, Fraenkel MC, Wilcox PG, Davidson AG, Speert DP. 2011. Mucoid and nonmucoid Burkholderia cepacia complex bacteria in cystic fibrosis infections. Am J Respir Crit Care Med 183: 67–72. [DOI] [PubMed] [Google Scholar]
- Zlosnik JE, Mori PY, To D, Leung J, Hird TJ, Speert DP. 2014. Swimming motility in a longitudinal collection of clinical isolates of Burkholderia cepacia complex bacteria from people with cystic fibrosis. PLoS One 9: e106428. [DOI] [PMC free article] [PubMed] [Google Scholar]
- Zlosnik JE, Zhou G, Brant R, Henry DA, Hird TJ, Mahenthiralingam E, Chilvers MA, Wilcox P, Speert DP. 2015. Burkholderia species infections in patients with cystic fibrosis in British Columbia, Canada. 30 years’ experience. Ann Am Thorac Soc 12: 70–78. [DOI] [PubMed] [Google Scholar]
Associated Data
This section collects any data citations, data availability statements, or supplementary materials included in this article.


