Abstract
Ultrasound elastography enables in vivo measurement of the mechanical properties of living soft tissues in a non-destructive and non-invasive manner and has attracted considerable interest for clinical use in recent years. Continuum mechanics plays an essential role in understanding and improving ultrasound-based elastography methods and is the main focus of this review. In particular, the mechanics theories involved in both static and dynamic elastography methods are surveyed. They may help understand the challenges in and opportunities for the practical applications of various ultrasound elastography methods to characterize the linear elastic, viscoelastic, anisotropic elastic and hyperelastic properties of both bulk and thin-walled soft materials, especially the in vivo characterization of biological soft tissues.
Keywords: ultrasound elastography, shear wave, soft tissues
1. Introduction
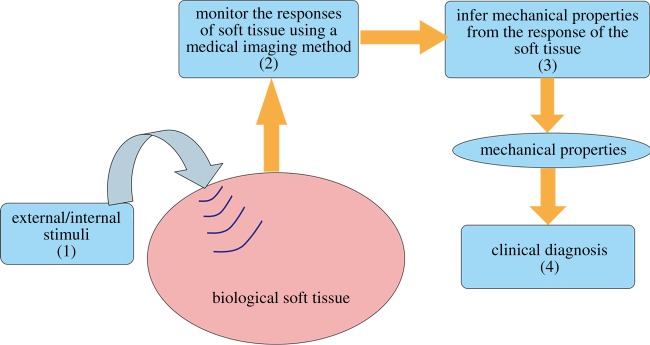
The elastography method, which was proposed in the 1990s, enables probing the elastic properties of living soft tissues and has found wide medical applications in the past two decades [1–7]. The key steps involved in an elastography method can be summarized as in figure 1 [8]. (1) An external or internal stimulus is imposed onto a target soft tissue. (2) The responses of the soft tissue, including its static and/or dynamic deformation behaviours are monitored using a medical imaging technique, such as ultrasound or nuclear magnetic resonance imaging (MRI) methods. (3) The mechanical properties of the soft tissue can then be inferred from the measured responses based on inverse analysis. (4) It has been recognized that many diseases, such as cancer [9,10], liver fibrosis [11,12], cardiovascular diseases [13] and thyroid nodules [14], are accompanied by variations in the tissue mechanical properties; therefore, in vivo and quantitative measurements of the elastic properties of soft tissues via elastography methods provide valuable information for the diagnosis and therapy of these diseases.
Figure 1.
An illustration of the key steps involved in elastography [8]. (Online version in colour.)
The vast studies published in the literature regarding the development and practical applications of elastography methods may be classified by considering the four key steps in figure 1. In step (1), different stimuli can be adopted to deform a soft tissue. In the literature, static loads [15], external vibrators [16,17] and acoustic radiation forces (ARFs) [18–21] have been applied to generate diverse responses in a soft tissue, leading to different static and dynamic elastography methods. Accurately tracking the mechanical responses of target soft tissues generated by various stimuli (step (2)) is a key step in an elastography method. To this end, different medical imaging methods have been used, giving rise to ultrasound elastography, magnetic resonance elastography, optical elastography and so on [18,22–24]. Also driven by this need, some dedicated imaging techniques have been introduced. For instance, besides the measurement of axial displacements, techniques based on the ultrasound imaging have been presented to obtain the lateral displacements and strains [25]. Another example is that taking advantage of ultrafast ultrasound imaging techniques (the frame rate can be up to 6000 Hz or even higher), the method to image two-dimensional motion vectors has been developed [24]. With the known responses of soft tissues under given stimuli tracked with various medical imaging methods, it is possible to infer the mechanical properties of soft tissues (step (3) in figure 1), which has received considerable attention from different disciplines. Besides linear elastic parameters, it has been demonstrated that hyperelastic [8,26–28], viscoelastic [29–32] and anisotropic elastic [33–36] parameters of soft tissues may be inferred using different inverse methods reported in recent years. The mechanical properties of living soft tissues inferred from their responses to imposed stimuli may provide valuable information for the diagnosis and therapy of some diseases (step (4)). This step is the main interest of clinicians who use elastography, and most publications from clinical research focus on this aspect. Over the past years, numerous valuable clinical data have been reported in the literature, which indeed help identify the extent to which elastography methods are useful in clinics [10,12,37].
This review focuses on ultrasound elastography for which quite a few review papers [1–7] and guidelines for its clinical use [38,39] have been published. It can be seen from figure 1 that continuum mechanics plays an essential role in both steps (1) and (3). In particular, the questions of how to understand the responses of living soft tissues to various external/internal stimuli in ultrasound elastography and how to establish robust inverse approaches to infer different material parameters of soft tissues have come under the spotlight of the mechanics and applied mathematics research communities. Bearing this issue in mind, distinct from previous review papers, this review focuses on the mechanics principles underpinning elastography methods to highlight the limitations, challenges and opportunities of these methods from the viewpoint of continuum mechanics. To this end, we divide the commonly used ultrasound elastography methods into three categories based on the loads or stimuli imposed on the soft tissue and its responses: static elastography, dynamic elastography with harmonic stimuli (DEHS) and dynamic elastography with transient stimuli (DETS). From the viewpoint of continuum mechanics, the governing equations and boundary conditions (BCs) characterizing the responses of soft tissues involved in these three types of methods differ.
This review paper is organized as follows. In §2, a brief introduction to the commonly used ultrasound elastography methods and their applications is presented. Section 3 describes the mechanics theories involved in elastography methods. In §4, particular attention is given to some limitations of the current data analysis methods and future prospects for developing novel inverse analysis methods within the framework of continuum mechanics. Section 5 provides the concluding remarks.
2. Ultrasound-based elastography methods
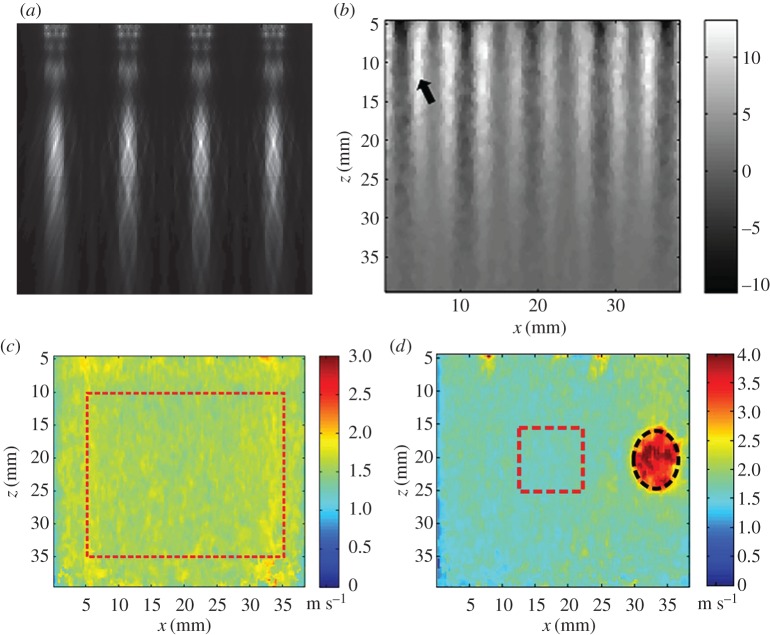
Ultrasound imaging is a low-cost, safe and mobile imaging modality that can generate real-time images and has found broad applications in clinical radiology. Safety is one of its major strengths; indeed, this technique does not involve ionizing radiations. Ultrasound-based elastography methods use ultrasound imaging to track the deformation behaviours of soft tissues and further infer the elastic properties of both healthy and diseased soft tissues. Depending on the features of the stimuli used to deform the soft tissue, the ultrasound-based elastography methods can be divided into three categories: static elastography, DEHS and DETS. This section gives an overview of different ultrasound-based elastography techniques and their applications for the mechanical characterization of soft tissues and diagnosis of some diseases.
(a). Static elastography methods
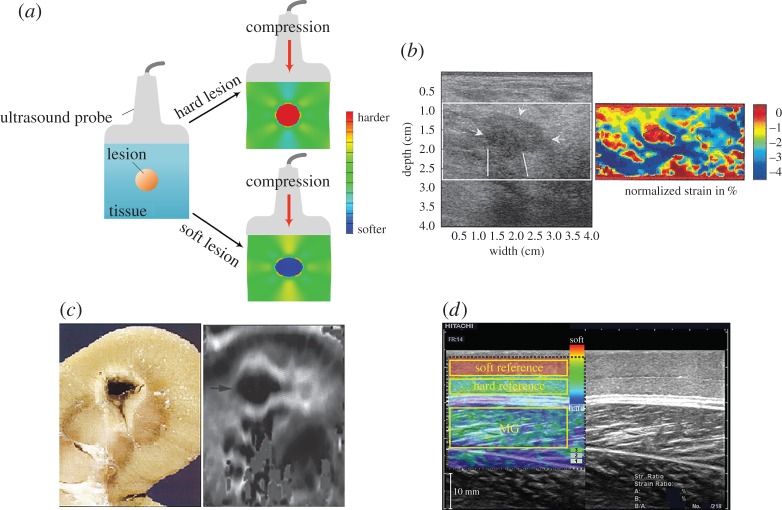
Static elastography, which was proposed in the early 1990s, has been widely used in clinics in the past two decades [2,15,25,40–44]. When using this method, static compression is typically imposed onto a targeted soft tissue (figure 2a). The resulting displacement field (mainly the axial displacement in the early use of static elastography) generated by the compressive load can be directly measured via the ultrasound imaging method. The strain field can then be calculated according to the measured displacement. Furthermore, dedicated inverse approaches can be used to extract the elastic properties of the target soft tissues according to the strain field [2,6,41,48]. Briefly, harder tissues have lower strains, whereas softer tissues have higher strains under compression, as shown in figure 2a. In principle, it is possible to quantitatively infer the elastic properties of soft tissues using a static elastography method; however, this is challenging because of the complexity of the associated inverse problem, as discussed in detail in §3. Therefore, the static elastography method is usually regarded as a qualitative method that reveals the contrast between hard and soft tissues.
Figure 2.
(a) Illustration of the basic principle underlying static elastography. (b) Detection of a breast lesion, which appears as the low-strain region in the image. Compared with the B-mode image, the elastography method may provide more accurate information with respect to both the size and the position of a lesion [45]. (c) Application of static elastography to image a thermal lesion induced by HIFU, revealing that this technique may be useful to guide HIFU treatment [46]. (d) Measurement of the elastic properties of skeletal muscles using the static elastography method. To quantitatively infer the elastic properties of the muscle, two soft layers with known mechanical properties are used [47]. Reprinted from references [45], [46], and [47] with permission. (Online version in colour.)
Although the limitations of the static elastography method in quantitatively measuring the mechanical properties of soft tissues have been recognized, this method is simple and easy to realize and allows us at least to qualitatively distinguish between regions with different stiffnesses; therefore, it has been widely used in clinics. For example, static elastography finds important applications in the classification of breast lesions [45,49]. A low-echogenic region emerges in the B-mode image when a lesion exists, as shown in figure 2b. Traditionally, such a low-echogenic region (the region indicated by arrows in figure 2b) in the B-mode image may be suspected to correspond to a breast lesion. Now with the help of the static elastography method, the position and size of a lesion may be detected more accurately than using the result estimated solely based on the B-mode image [45]. Moreover, the mechanical properties of thermal lesions induced by high-intensity focused ultrasound (HIFU) have been demonstrated to differ from those of the surrounding soft tissues; therefore, the static elastography method can be a useful tool to guide HIFU treatment when the lesions are not too deep [46,50]. The dark region in figure 2c denotes the low-strain region (i.e. the location of the thermal lesion). In addition to lesion detection, static elastography can also be used to characterize other soft tissues. For instance, in a recent work, Chino et al. [47] used two referenced layers with known elastic moduli to cover the skin and measured the compressive strains in both the referenced layers and the skeletal muscles. Although the anisotropy of the skeletal muscles was ignored in their study, by comparing the strains in the referenced layers and skeletal muscles, the elastic properties of the skeletal muscles were evaluated, as shown in figure 2d [47]. Other applications of static elastography in predicting malignancies in thyroid nodules can be found in [14,51].
In the clinical use of static elastography methods, the quality of the examination depends significantly on the experience and technique of the sonographer clinicians. For instance, an appropriate compressive amount should be imposed onto the soft tissue to improve the image quality. The appropriate pre-compression of the soft tissues before the imaging process may help increase the contrast and reduce the decorrelation noise [3,46]. However, determining the amount of pre-compression required is by no means trivial because a small pre-compression may not increase the imaging contrast, whereas a large pre-compression may lead to hardening of the soft tissue. This issue will be discussed in detail in §3.
(b). Dynamic elastography with harmonic stimuli
DEHS are elastography techniques that use external or internal harmonic stimuli to generate dynamic responses in biological soft tissues. Here, we focus on cases in which external vibrators or ARFs generated by focused ultrasound beams are used as stimuli. The ARF (figure 3) produced by the momentum transfer from acoustic waves to the medium is determined by
| 2.1 |
where α (dB/m) and cL (m s−1) denote the acoustic absorption and sound speed in the target biological soft tissues, respectively, and I (W m−2) is the temporal average intensity of the acoustic beam [18,52,53]. f (N m−3) is a type of body force, and its direction is along the acoustic wave propagation direction. Sarvazyan et al. [18] argued that the ARF provides physicians with a ‘virtual finger’ that helps them to touch the internal regions of human bodies.
Figure 3.
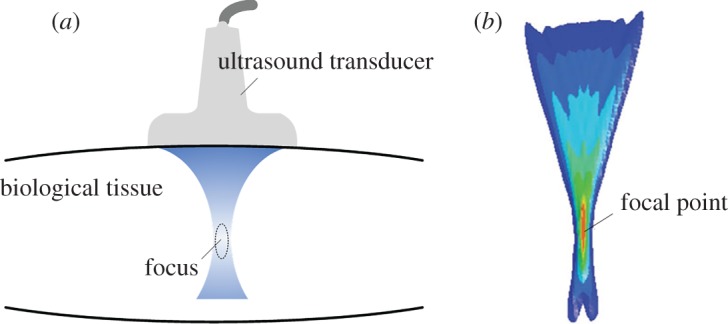
(a) Schematic of the ARF in biological soft tissues induced by a focused ultrasound beam. (b) The isocontours of the ARF distribution from a focused linear array in a soft medium; here the acoustic attenuation coefficient is 0.7 dB cm−1 MHz [52]. Reprinted from reference [52] with permission. (Online version in colour.)
In DEHS, the steady-state responses of the target soft tissues are typically used to infer their mechanical properties. DEHS may include sonoelastography [16,19,54–58], shear wave-induced resonance elastography (SWIRE) [59–61], vibro-acoustography (VA) [62–67], harmonic motion imaging (HMI) [68–73] and shear wave dispersion ultrasound vibrometry (SDUV) methods [74–79]. The first two methods use external vibrators, while the last three use the ARFs as harmonic stimuli. A brief overview of these methods is given below.
(i). Sonoelastography
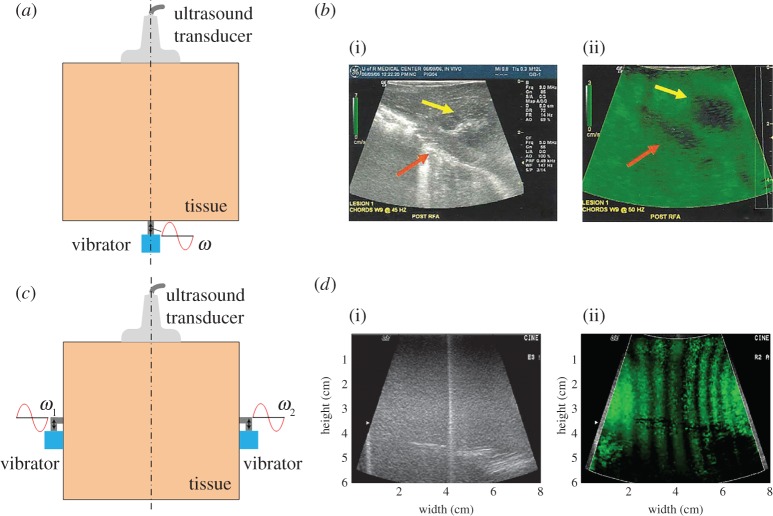
The sonoelastography imaging method uses an external harmonic vibrator to generate harmonic vibrations within target soft tissues [5,16,56,58,80]. A schematic of the sonoelastography method is shown in figure 4a. The steady-state responses (e.g. the map of the vibration amplitude [55,56] and phase [16]) of the tissues are then measured using the Doppler spectrum of the reflected signals [82,83]. Accordingly, different inverse approaches are established to obtain the elastogram of the tissues. Based on the distribution of the vibration amplitude, local lesions, which may be harder or softer than surrounding tissues, can be distinguished [55,80]. According to the map of the phase, the phase velocity c of the shear wave can be measured using a phase gradient algorithm, i.e.
| 2.2 |
where the phase gradient is calculated by the phase shift Δφ over a distance Δr and ω denotes the angular frequency. Therefore, the elastic properties of the tissues may be determined [16,58]. The two approaches mentioned above are named vibration amplitude sonoelastography and vibration-phase gradient sonoelastography, respectively [5]. In general, vibration amplitude sonoelastography is a qualitative method that mainly provides information about the positions of local lesions, whereas vibration-phase gradient sonoelastography may be used to quantitatively measure the elastic and viscous properties of soft tissues. Figure 4b shows the B-mode image and vibration amplitude map of a porcine liver with a thermal lesion. This figure shows that the lesion can be clearly distinguished from the vibration amplitude map obtained via sonoelastography. Indeed, using vibration-phase gradient sonoelastography, the in vivo elastic properties of skeletal muscles [58] and livers [54] of healthy volunteers have been determined.
Figure 4.
(a) Schematic of sonoelastography. (b) The B-mode image (i) and vibration amplitude map (ii) obtained via sonoelastography of a porcine liver with a thermal lesion [5]. (c) Schematic of crawling wave imaging. (d) The B-mode image (i) and a frame showing the crawling waves (ii) in a phantom consisting of a hard layer (left) and soft layer (right) [81]. Reprinted from references [5] and [81] with permission. (Online version in colour.)
Later on, an improved method based on the sonoelastography, named crawling wave imaging, was developed by Wu et al. [57,81]. The key concept is presented in figure 4c. Two vibrators with frequencies of ω1 and ω2, respectively, are used to generate shear waves: ω1 = ω + δω/2 and ω2 = ω − δω/2, where δω/ω ≈ 0.01 and ω is typically hundreds of hertz. The shear waves generated by the two vibrators form an interference pattern that propagates with velocity (δω/2ω)c, where c is the phase velocity of the shear wave at frequency ω in the soft tissue. Because δω/ω ≈ 0.01, the velocity of the travelling interference pattern, which is named the ‘crawling wave’, is much smaller than c [57,81]. The slow crawling wave can be visualized and tracked by a conventional ultrasonic scanner modified for sonoelastography [84]. The crawling waves in a phantom consisting of a hard layer (left part in (i) and (ii)) and soft layer (right part in (i) and (ii)) are shown in figure 4d. Clearly, the wavelength of the crawling wave in the harder region is larger. Initial ex vivo experiments on livers and prostates and in vivo experiments on skeletal muscles indicate that crawling wave imaging is a promising method for quantitatively characterizing the mechanical properties of biological soft tissues [85–88].
(ii). Shear wave-induced resonance elastography
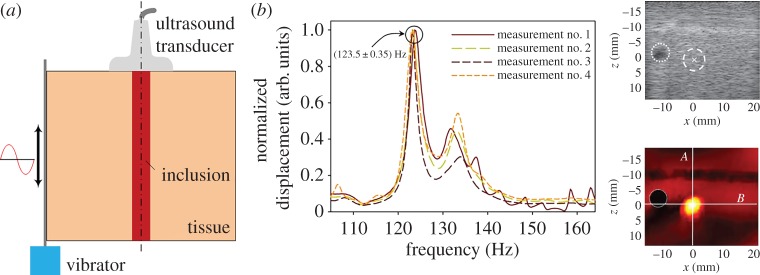
A recently developed method named SWIRE adopts an external vibrator to generate shear waves with frequencies in the range of 45–205 Hz within soft materials, as shown in figure 5a. The propagation of the shear waves is monitored by an ultrafast ultrasound scanner. Then, Fourier transformation is conducted for the time-domain displacement at each point in the region- of-interest (ROI) to obtain the frequency-domain displacement. The resonance frequencies of the soft inclusion, which correspond to the low-order eigenmodes of a soft inclusion--hard matrix system, can be identified from the peak values of the frequency-domain displacement curve[59–61]. Additionally, a finite-element (FE) model is used to simulate the experiments and calculate the theoretical resonance frequencies of soft inclusions with different elastic parameters. When the theoretical results match the experimental ones, the corresponding elastic parameters are supposed to be those of the practical soft inclusion. Typical frequency-domain displacement curves for a point within the soft inclusion are shown in figure 5b, and from these curves, the resonance frequency may be determined. The stationary shear wave displacement field in the ROI at the resonance frequency is also presented. Clearly, the resonance response of the soft inclusion distinguishes itself from the surrounding harder tissues [59,61]. It should be pointed out that the limitation of SWIRE lies in that it can be only used for the characterization of soft inclusions.
Figure 5.
(a) Schematic of the SWIRE. (b) Typical frequency-domain displacement curves at a point within the soft inclusion, from which the resonance frequency can be determined from the peaks in the curves. The stationary shear wave displacement field in the ROI at the resonance frequency is also presented [61]. Reprinted from reference [61] with permission. (Online version in colour.)
(iii). Vibro-acoustography
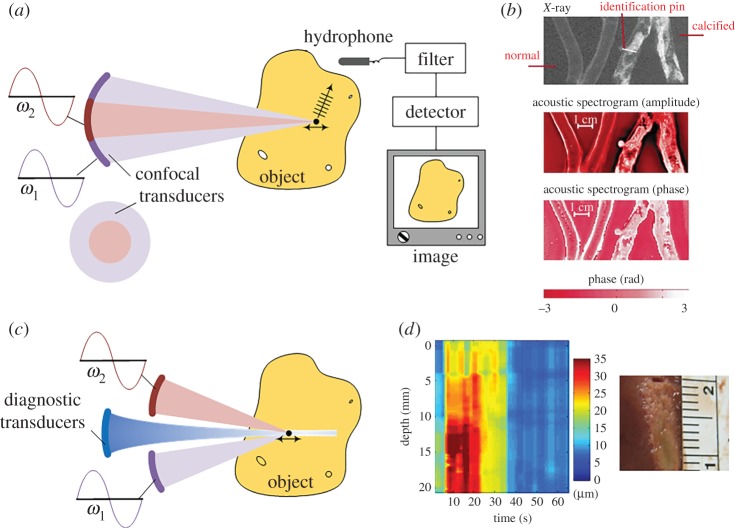
In the VA technique [62–64,89], confocal transducers with centre frequencies ω1 and ω2, as shown in figure 6a, are applied to a target soft material. ω1 and ω2 are on the order of megahertz, whereas δω = ω2 − ω1 is on the order of kilohertz. Thus, the low-frequency (kHz) harmonic ARF can be imposed onto a focused point within the target soft tissue [62]. The resulting vibration, which is determined by the local elastic properties of the tissue at the focused point, will induce an acoustic emission field. Both the magnitude and phase of the acoustic emission can be detected by a hydrophone. When the two focused ultrasound beams sweep through the whole object, images based on either the magnitude or phase of the acoustic emission can be obtained as shown in figure 6a. These images are the so-called magnitude and phase acoustic spectrograms; their resolutions are determined by the ultrasound resolution and the point-spread function of the system, and are roughly hundreds of micrometres [62,63]. Figure 6b shows the amplitude and phase images of normal and calcified excised human iliac arteries obtained with δω = 6 kHz. Subsequent studies using this technique have demonstrated its promising use in imaging of breast [89,90] and prostate tissues [65,67]. In principle, VA is an interesting imaging technique and has a resolution similar to that of X-ray images when used to measure calcified arteries (figure 6b). However, interpreting the acoustic spectrogram to quantitatively determine the mechanical properties of soft tissues is challenging, as recently addressed by Brigham et al. [66].
Figure 6.
(a) Schematic of VA. (b) The amplitude and phase acoustic spectrograms of normal and calcified excised human iliac arteries obtained using the VA method [62]. (c) Schematic of HMI. (d) The HMI displacement variation and corresponding pathology images of liver tissue for 30 s of sonication [71]. Reprinted from references [62] and [71] with permission. (Online version in colour.)
(iv). Harmonic motion imaging
To identify the local mechanical properties of soft tissues, Konofagou et al. [68–70] modified the experimental set-up of the VA method and proposed the HMI method. In the HMI method, an additional ultrasound beam, as shown in figure 6c, is used to monitor the harmonic motion induced by confocal transducers. The amplitude of the harmonic motion of soft tissues is determined by both the local elastic properties at the focus and the magnitude of the ARF. Equation (2.1) shows that the ARF relies on the intensity of the acoustic beam and the acoustical properties of the medium at the focal region; both of them may vary from site to site. Therefore, the magnitude of the ARF is difficult to control, and quantitatively measuring the local elastic modulus is challenging. However, the highly localized harmonic ARF provides a useful way to probe the relative variation of the mechanical properties within biological tissues [69]. Accordingly, the HMI method has been successfully used to monitor HIFU treatment [71,73,91]. Figure 6d shows the HMI displacement variation and corresponding pathology images of liver tissue for 30 s of sonication.
In a recent study, Vappou et al. [72] developed a two-step inverse approach to quantitatively probe the viscoelastic properties of a soft solid based on HMI. Briefly, the phase velocity of the propagating shear wave induced by the harmonic motion at the focus is measured, and then, the phase shift between the stress (i.e. the harmonic ARF) and the strain (i.e. the monitored harmonic motion) is measured to determine the loss tangent [92]. Hence, the quantitative viscoelastic properties of a soft tissue may be determined. Experiments on phantoms have validated the effectiveness of the inverse approach.
(v). Shear wave dispersion ultrasound vibrometry
The SDUV technique, which was developed by Chen et al. [74,75], uses the harmonic ARF generated by an amplitude-modulated ultrasound beam to induce low-frequency shear waves (typically ranging from 300 to 900 Hz) within target soft tissues (figure 7a). The shear waves are detected at different locations along the propagation direction, and then the phase velocities can be determined via the phase gradient method. For a viscoelastic solid, the phase velocities depend on the frequencies of the shear waves, and the relationship between the phase velocities and the frequencies is the so-called dispersion relation. By controlling the modulation frequency, the frequency of the generated shear wave can approximately vary from 300 to 900 Hz and the dispersion curve can be obtained.
Figure 7.
(a) Schematic SDUV [74]. (b) Dispersion curve of a phantom. The points were obtained from experiments, and the solid line is the least mean square fitting result. The viscoelastic parameters of the phantom determined using the SDUV method agree well with those obtained from an independent measurement [74]. Reprinted from reference [74] with permission.
Assuming that the viscoelastic properties of a solid can be described by a Voigt model [92], the theoretical dispersion relation can be derived. Then, by fitting the experimental dispersion curve with the theoretical solution, the elasticity and viscosity parameters can be obtained. A typical experimental dispersion curve for a viscoelastic phantom is shown in figure 7b. The elasticity and viscosity parameters of the phantom identified using the SDUV method agree well with those obtained via an independent measurement [74]. Experiments on in vitro porcine muscles and human prostates have been conducted to validate the effectiveness of this method [76,93].
A common feature of the aforementioned methods is their reliance on the use of harmonic stimuli to deform soft tissue. By determining the phase velocities of the shear waves, the elastic or viscous parameters of soft tissues may be quantitatively determined. However, when the wavelength of the shear wave is comparable to the dimension of the soft tissue, the phase velocities may depend not only on the physical properties of the soft tissues, but also on the geometrical parameters of the system. In this case, caution should be taken when inferring the tissue parameters based on the shear wave velocities. The SWIRE method uses the resonance frequency information of soft tissues to determine their mechanical properties (e.g. the elastic properties of an inclusion). However, this method relies on the use of a numerical method (e.g. the FE method (FEM)) to simulate the experiments and further evaluate the elastic parameters of an inclusion. This reliance complicates the use of this method in clinics.
(c). Dynamic elastography with transient stimuli
In this section, we discuss the dynamic elastography methods that use transient stimuli to deform a soft tissue. In these methods, the responses of soft tissues (e.g. the shear wave velocities) are measured to extract the local elastic properties [17,18,20,94–98]. Note that in this method, the frame rate of the scanner is usually high enough to acquire the propagation process of the shear waves. A key merit of DETS is that it is not so sensitive to the BCs. The reflected waves are separated from the incident wave in the time domain and can be filtered out [17]. Therefore, DETS enables the quantitative determination of elastic properties. Similar to DEHS, various external and internal stimuli may be used to generate transient shear waves within soft tissues. In recent years, DETS, in which the ARF is used to generate a transient shear wave, has attracted considerable attention [4,7,18,20,95,96,99,100]. This method, which generates remotely transient shear waves within biological tissues, permits us to probe the mechanical properties of biological tissues and is relatively suitable for clinical use. Here, we focus on the following methods.
(i). Transient elastography
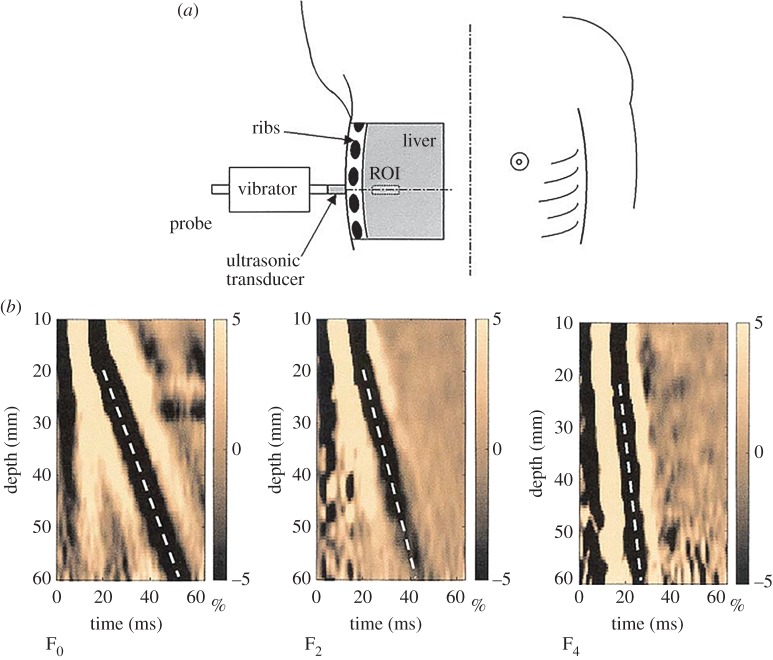
Transient elastography (TE), which was proposed by Sandrin and colleagues [17,24,101,102], uses an external vibrator to introduce a low-frequency transient wave in biological tissues and tracks the propagation of this transient wave along the axis of the vibrator (figure 8a), with a frame rate of approximately 4000 Hz. The velocity of the transient wave is measured, and the elastic modulus of the soft tissue can be quantitatively determined by assuming that the tested material is elastic and its dimension is larger than the wavelength. The TE technique forms the basis of Fibroscan® (Fibroscan, Echosens™, France), which is an effective approach for staging liver fibrosis [103,104]. Figure 8b shows the in vivo experimental results obtained from three livers with different degrees of fibrosis (F0 to F4 denote the degree of fibrosis). Clearly, for a liver with a higher degree of fibrosis (e.g. F4), the velocity of the transient wave in the ROI is greater.
Figure 8.
(a) Schematic of TE [17]. (b) Propagation of the transient elastic waves in livers with different degrees of fibrosis. The results from left to right are for F0, F2 and F4. The velocities of the transient waves can be deduced from the slope of the white dotted lines: a steeper line indicates a faster wave [17]. Reprinted from reference [17] with permission. (Online version in colour.)
(ii). Shear wave elasticity imaging and ARF impulse
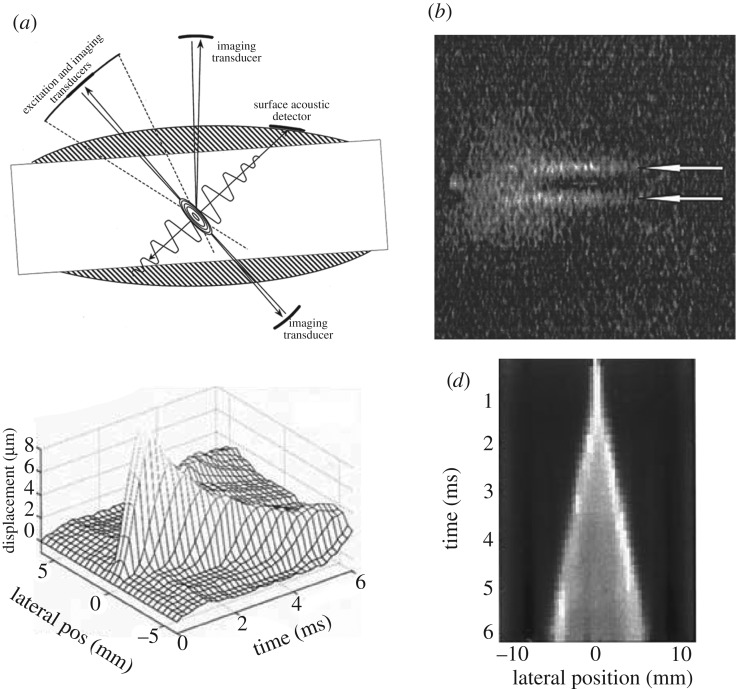
Sarvazyan et al. [18] proposed the shear wave elasticity imaging (SWEI) method, which uses the ARF to generate shear waves within soft tissues (figure 9a). The magnitude of the ARF is fairly small, and, thus, the displacement induced by the acoustic force within the soft biological tissue is usually on the order of micrometre. However, Sarvazyan et al. [18] demonstrated that using an additional system (e.g. MRI or optical imaging) facilitates recording the shear waves, as shown in figure 9b. Subsequently, Nightingale et al. [94] and Palmeri et al. [98] used ultrasound imaging to track the propagation of shear waves in in vivo and ex vivo experiments. The experimental set-up used by Nightingale et al. [94] is based on their previously developed ARF impulse (ARFI) technique, which has been implemented commercially by Siemens Medical Solutions on their ACUSON S2000TM [21,99]. The ARFI technique imposes the impulse radiation force onto local regions of the tissues, and information, such as the displacements immediately after the excitation, the peak displacement, the time to reach the peak displacement and the recovery time of the deformed region after the force is removed, can be used to determine the local elastic properties of soft tissues based on dedicated inverse approaches [21,105]. Typically, the map of the peak displacement, which is assumed to be inversely proportional to the elastic modulus of the local tissue, is provided to indicate the stiffness distribution within the target soft tissue. Here, the method in which ultrasound imaging is used to track the shear waves induced by ARFI is named the AFRI-based SWEI method [35,94,106]. Figure 9c and d shows the displacement induced by the AFRI and the normalized displacement used to evaluate the velocity of the shear wave, respectively.
Figure 9.
(a) Schematic of the SWEI method [18]. (b) The shear waves recorded by the MRI [18]. (c) The shear waves recorded via the AFRI-based SWEI method, showing the displacements along the lateral direction at different times. Clearly, the displacements are attenuated along the propagation direction [94]. (d) Normalized displacement map obtained from (c); based on the slope of the bright line, the shear wave velocities can be evaluated [94]. Reprinted from references [18] and [94] with permission.
AFRI-based SWEI method [35,94,106] is a promising strategy for quantitatively probing the local elastic properties of biological soft tissues. Both generating the ARF and monitoring the propagation of the shear waves can be realized using a single ultrasound probe, unlike in experimental systems that require an extra vibrator to generate shear waves. Subsequent studies of ARFI-based SWEI have demonstrated its usefulness for in vivo characterization of the mechanical properties of various soft biological tissues [35,98,106].
(iii). Supersonic shear imaging
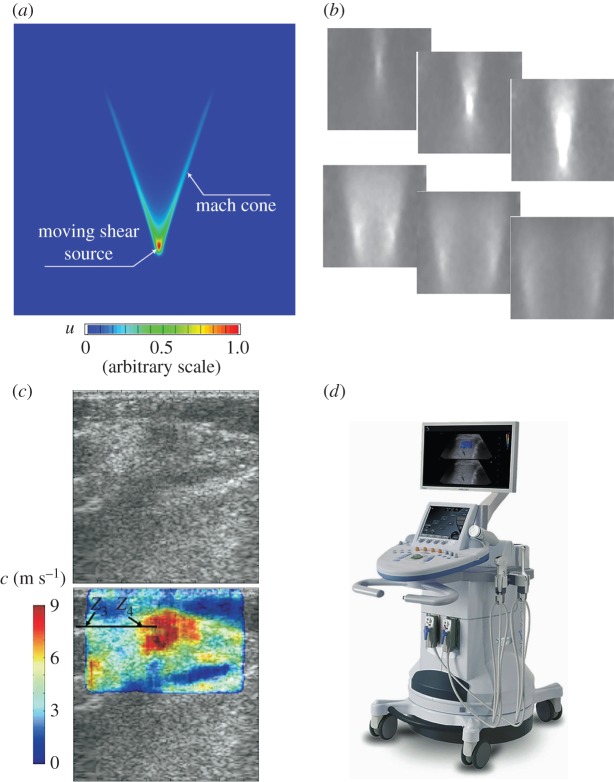
The supersonic shear imaging (SSI) technique uses ultrasound beams focused at different depths within biological tissues to create a moving ARF [20,95]. The ARF moves at a high speed in the soft material; thus, the resulting displacement field is confined within a Mach cone, as shown in figure 10a. In this case, two quasi-plane shear wavefronts interfere along the Mach cone and propagate in opposite directions. This phenomenon is known as the elastic Cherenkov effect (ECE) [20,34,107]. In the SSI technique, the propagation of the interfered front is monitored using an ultrafast imaging technique. The fast acquisition reduces the risk of artefacts resulting from the movements of patients or investigators. Typical experimental results for a homogeneous phantom are shown in figure 10b, which illustrates the propagating process of the interfered wavefronts within 14 ms after imposing the moving ARF. Furthermore, the shear wave velocity is measured using the time-of-flight algorithm [95,108], and the elastic moduli of the target soft tissues can be determined. Figure 10c shows an in vivo elastogram obtained in breast tissues. The central region of the ROI (the red region), in which Young's modulus is higher than in the surrounding tissues, is suspected to be a lesion. The SSI technique has now been commercialized (figure 10d) and used in clinics. Applications of this technique to detect breast lesions [95,109] and thyroid nodules [110] and stage liver fibrosis [111] have been explored.
Figure 10.
(a) The displacement field given by FEA, indicating the formation of the shear-wave Mach cone. In this case, the moving velocity of the vibration source is three times the velocity of the shear wave in the target material. (b) The propagation process of the interfered wavefronts within 14 ms after applying the ARF recorded during an experiment on a phantom [20]. (c) The in vivo elastogram obtained via SSI for breast tissues [95]. (d) A photograph of the Aixplorer® ultrasound instrument (Supersonic Imagine, Aix-en-Provence, France). Reprinted from references [20] and [95] with permission. (Online version in colour.)
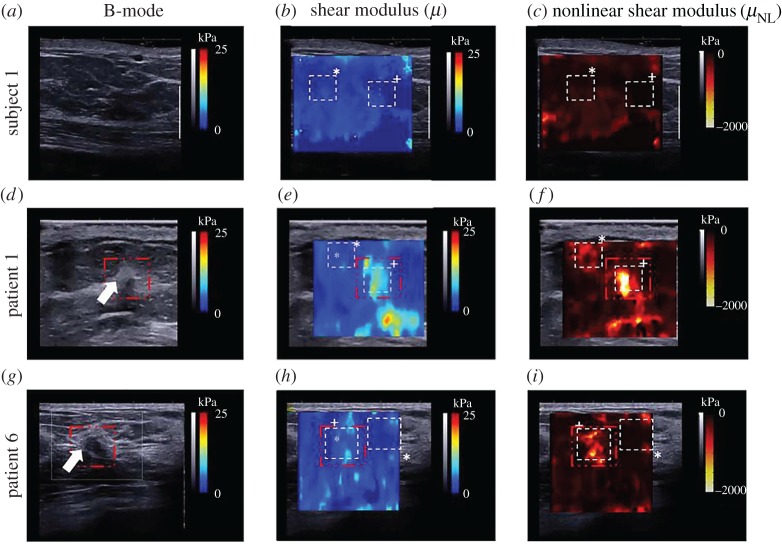
Moreover, determination of the nonlinear elastic properties of soft tissues using the SSI technique has attracted considerable attention in recent years [8,26–28,33,34]. In these studies, the tested soft materials are pre-deformed, and then the shear wave velocities in the deformed materials are measured. According to the relationship between the velocities of shear waves and the pre-deformation and material parameters, the nonlinear elastic properties can be determined. The nonlinear elastic properties for human breasts, heel fat pads and skeletal muscles have been measured in vivo [8,33] in this way. To evaluate nonlinear elastic properties using these methods, the pre-deformation must be determined with a reasonable accuracy. Li and colleagues [8,27,33] evaluated the pre-deformation based on B-mode images. In a recent study, Bernal et al. [28] developed an experimental system in which the pre-deformation is evaluated using the static elastography method, and the shear wave velocities are measured using the SSI technique. Thus, the two-dimensional images of the nonlinear elastic properties can be obtained. They argued that the map of the nonlinear elastic properties might produce better contrast between lesions and normal soft tissues [28].
(iv). Comb-push ultrasound shear elastography
Song et al. developed the comb-push ultrasound shear elastography (CUSE) method [96,112–114]. In this method, several unfocused (or focused) ultrasound beams as shown in figure 11a, are used as multi-stimuli to generate shear waves in the whole field-of-view (FOV). Additionally, the elastic properties in the whole FOV can be identified with one acquisition. Figure 11b shows the shear waves generated by the CUSE in a homogeneous phantom. Both homogeneous and inclusion phantom experiments have been performed to validate the effectiveness of this method, as shown in figure 11c and d. In vivo experiments to detect breast masses and evaluate thyroid nodules have also been conducted, and the results show that this technique is promising [115,116]. In the subsequent study, Song et al. further developed the time-aligned sequential tracking (TAST) method, which enables the CUSE being realized on traditional ultrasound scanner [113].
Figure 11.
(a) ARFs generated by multi unfocused ultrasound beams. (b) Shear waves generated by CUSE in a homogeneous phantom. Panels (c) and (d) give the shear wave velocity maps in the whole FOV for a homogeneous phantom and a phantom with a hard inclusion, respectively [96]. Reprinted from reference [96] with permission. (Online version in colour.)
(v). Guided wave elastography
When using the dynamic elastography methods mentioned above, body wave theories are typically used to relate the shear wave velocities to the material parameters of soft issues. However, when dynamic elastography methods are used to characterize thin-walled soft tissues, the waves are guided, and, therefore, the guided wave theory should be used to interpret the experimental data [100,117–122]. Guided wave elastography (GWE) methods have attracted increasing interest in recent years, although they have not been commercialized yet. For thin-walled soft tissues, the wall thickness may be smaller than or comparable to the wavelength of the elastic waves generated in soft tissues; in this case, the waves are guided within the wall and are strongly dispersive [123,124]. The dispersion relation is crucial for inferring the material parameters from the measured experimental responses.
The general steps involved in GWE using the ARF as stimuli may be summarized as follows.
-
(1)
The focused ARF is used to generate the broad-band guided waves in the walls of soft tissues.
-
(2)
The propagation of the guided shear waves is tracked along the propagation direction.
-
(3)
Two-dimensional Fourier transformation can be applied to analyse the spatio-temporal imaging of the guided waves and extract the dispersion relation [125].
-
(4)
A guided wave model (e.g. the Lamb wave model [123]) can be used to fit the experimental dispersion curve and identify the elastic properties of the thin-walled soft tissues.
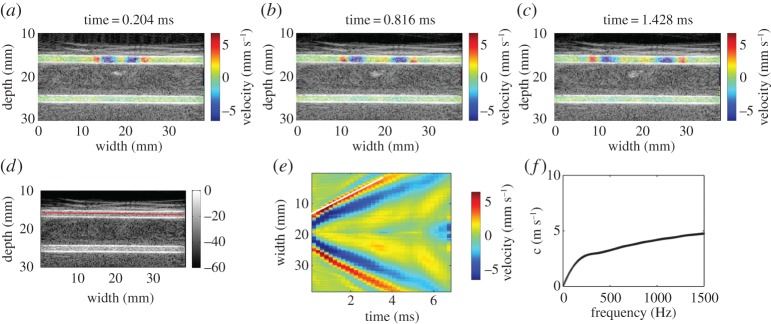
Typical experimental results of a vessel-mimicking phantom are shown in figure 12, in which the wave propagates along the axial direction of the vessel. From the dispersion curve given in figure 12f, the elastic properties of the vessel-mimicking phantom can be determined by using the guided wave model. Ex vivo and in vivo experiments performed on arteries [117,118], bladders [126], tendons [120] and heart wall [121] demonstrate that the GWE method is a promising tool for measuring the elastic properties of thin-walled biological tissues.
Figure 12.
(a–c) The axial components of the partical velocities in a vessel-mimicking phantom overlaid on the B-mode image at approximately 0.2, 0.8 and 1.4 ms after the action of the ARF. The inner radius and wall thickness of the vessel-mimicking phantom are 2 mm and 1 mm, respectively. (d) The solid line along which the spatio-temporal imaging of the shear wave propagation occurred is shown in (e). (f) The dispersion curve derived from spatio-temporal imaging via a two-dimensional Fourier transformation [119]. (Online version in colour.)
The key issue affecting the use of the GWE method is the development of robust inverse approaches based on the dispersion relations given by appropriate guided wave models. The dispersion relation is generally sensitive to the BCs, geometrical parameters and pre-stresses in the soft tissues [100,117–119,127,128], which should be addressed during the development of a robust inverse method.
3. Mechanics underpinning ultrasound-based elastography
Continuum mechanics plays an essential role in the development, evaluation and improvement of both static elastography and dynamic elastography methods. From the viewpoint of direct analysis, continuum mechanics enables the prediction of the responses of a biological soft tissue under either a static load or a dynamic stimulus. For instance, in static elastography, continuum mechanics predicts that the softer part will undergo larger deformation than the stiffer part. Therefore, measuring the deformation of soft tissues using a medical imaging method enables differentiating the parts with different elastic moduli. In dynamic elastography, understanding the correlation between the dynamic responses of soft tissues and their mechanical properties under either harmonic or transient stimuli within the framework of continuum mechanics forms the basis of developing data analysis methods to infer the material parameters of soft tissues. Moreover, inferring the mechanical properties of a biological soft tissue based on the responses of the soft tissue to an external or internal stimulus represents an inverse problem in elasticity. Unlike direct problems, many important inverse problems in engineering and science are ill-posed [129]. An inverse problem is ill-posed if one of the following properties is not respected. (1) A solution to the problem exists (existence). (2) There is, at most, one solution to the problem (uniqueness). (3) The solution depends continuously on the data (stability). To identify the extent to which the material parameters of a soft tissue can be effectively inferred using an elastography method, the properties of the inverse problem (i.e. the existence, uniqueness and stability of the solution) should be addressed by invoking the mathematical theory of inverse problems. In this section, we first summarize the governing equations involved in the use of the aforementioned elastography methods to characterize the mechanical properties of soft tissues. Then, the specific mechanics models for different types of elastography methods are discussed. Particular attention is paid to the theoretical solutions that describe the correlations between the experimental responses and material parameters, and their limitations are emphasized.
(a). Governing equations
(i). Equilibrium equations
The equilibrium equation describing the conservation of momentum [130,131] is given by
| 3.1 |
In the above equation, u denotes the displacement of the elastic solid, t denotes time, ρ denotes the mass density and b is the body force. T is the surface traction force and is related to the Cauchy stress by
| 3.2 |
where n denotes the outer unit normal. Using the divergence theorem, we can obtain the differential form of equation (3.1)
| 3.3 |
The above equation represents the conservation of linear momentum, and the conservation of the angular momentum further leads to the symmetry of ; i.e. [132].
(ii). Kinematic equations
Here, we use and to denote the reference (undeformed) and current (deformed) configurations, respectively; the points related to and are labelled using vectors and (, respectively, where the Roman and Greek indices refer to the configurations and , respectively. The displacement u is , and the deformation gradient tensor F is defined as
| 3.4 |
The determinant of F, which is denoted as J, gives the local volume ratio between the deformed and undeformed configurations. The soft biological tissues considered in this study are typically assumed to be incompressible in the literature (i.e. J = 1). Furthermore, the Green strain tensor can be defined as
| 3.5 |
where C is the right Cauchy–Green deformation tensor
Inserting equations (3.4) and (3.6) into equation (3.5) gives
| 3.7 |
where ∇r() stands for the gradient operator in .
When the deformation is infinitesimal, the difference between and can be ignored, and the Green strain tensor can reduces to the small-strain tensor
| 3.8 |
The amplitudes of the shear waves used in the elastography techniques are much smaller than the feature size of the tissues [4]. Moreover, the static strain used in the static elastography technique is small, and typically, the axial strain is of the order of 2% [6,15]. However, in many cases, the target soft tissues may be pre-loaded (say by the ultrasound probe) before the imaging process, and finite deformations may occur (e.g. the strain may reach 10–20%). Such a pre-load is necessary and can help to increase the contrast, reduce the decorrelation noise [3,46], and measure the nonlinear elastic properties of soft biological tissues [8,26–28]. In all of these cases, the problem can be summarized as ‘small on large’, that is, the small deformation caused by the shear wave or the static compression is superimposed on the finite deformation caused by the pre-load. To address the effect of the pre-deformation, the finite elasticity and incremental theory should be applied [131,133,134].
(iii). Constitutive laws
For a linear elastic and isotropic solid, the linear constitutive law is given by
| 3.9 |
where is the fourth-order elasticity tensor. Inserting equation (3.8) into equation (3.9), we can obtain the linear constitutive law in component form as
| 3.10 |
where . In the most general case, has 21 independent components [130]. For an isotropic elastic solid, the number of independent components of reduces to 2, and in this case, using the kinematic relations given by equation (3.8), equation (3.9) reduces to
| 3.11 |
where λ and μ are the Lamé constants and are related to the elastic modulus E and Poisson ratio ν through μ = E/[2(1 + ν)] and λ = νE/[(1 + ν)(1−2ν)]. For most soft biological tissues, ν is close to 0.5, and thus and μ ≈ E/3.
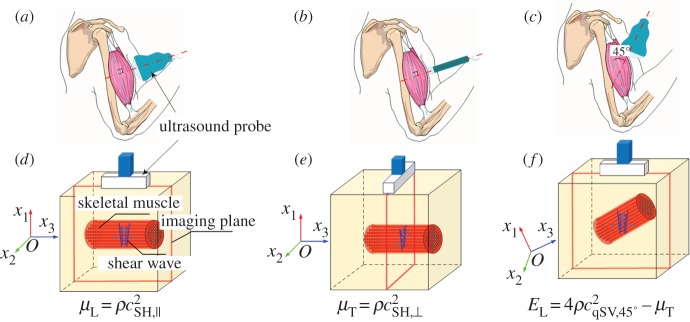
For the elastography of anisotropic soft tissues, here, we mainly concentrate on the transversely isotropic (TI) model, which is typically used to model anisotropic biological tissues, such as skeletal muscles and tendons [135,136]. In the TI model, has five independent components, and this number further reduces to three with the constraint of incompressibility [137]. Usually, the three elastic parameters, namely μT, μL and EL, can be used as three independent parameters to fully describe the mechanical properties of incompressible TI materials [34]. In general, μT and μL denote the transverse and longitudinal shear moduli, respectively, and EL is the longitudinal elastic modulus. Details about the relationships between μT, μL and EL and the components of can be found in [34,35].
To describe the nonlinear elastic deformation of soft tissues, constitutive laws are usually defined using the strain energy function W, which is a scalar function of the strain invariants [131,138]. Then, the nominal stress S, which is defined as , can be determined by
| 3.12 |
where p is a Lagrange multiplier used to ensure the incompressibility constraint [131,133].
For an isotropic solid, the first two principal invariants of C, which are denoted as I1 and I2, are
| 3.13 |
Because of the constraint of incompressibility, the third invariant I3 = 1, and W = W(I1,I2). Here, we list several hyperelastic models that have been widely used in the literature.
The neo-Hookean model is a simple and broadly used hyperelastic model, and its strain energy density function is given by
| 3.14 |
where μ0 is the initial shear modulus. In acoustoelasticity theory, the following fourth-order strain energy function has been used by many authors [26,139]
| 3.15 |
where A and D are the third- and fourth-order Landau constants, respectively, describing the nonlinear elastic deformation behaviours of soft materials.
To describe the nonlinear elastic deformation of a soft tissue, Demiray [140] and Fung et al. [141] proposed a strain energy density function in the following form:
| 3.16 |
where the parameter b > 0 is linked to the hardening effect [8,27].
For an anisotropic material, the material characteristic directions in the reference configuration can be denoted by the unit vectors Aα (α = 1, 2, … , N)). These characteristic directions may be caused by fibre-reinforced effects, such as spatially oriented collagen fibres [138,142]. In this case, some other invariants must be introduced to define W. Following the definitions used in the literature and commercial FE software [143], the following invariants, denoted as I4(αα) and I5(αα) (no sum on α), are defined:
| 3.17 |
The Holzapfel–Gasser–Ogden model has been widely used to model the nonlinear elastic deformation behaviour of arterial walls [138,142,143], for which the strain energy density function is
| 3.18 |
where C10, k1 and k2 are material constants, and κ is defined as
| 3.19 |
where ρ(Θ) is the orientation density function which characterizes the distribution of the fibres.
In particular, for TI hyperelastic materials (i.e. those in which the fibres run along only one direction), N = 1. In this case, Murphy [144] noted that W should include both I4(11) and I5(11) to ensure compatibility between the linear elastic and nonlinear elastic models, and suggested that W may be written as
| 3.20 |
Furthermore, the following function, which generalizes the Humphrey–Yin model [145], has also been suggested [144]
| 3.21 |
where c2 > 0 and c4 > 0 are the isotropic and anisotropic strain-hardening parameters, respectively.
(iv). Incremental theory
Here, we give a brief overview of the incremental deformation theory, which is involved in finite deformation analysis. The finite deformation from the referenced (undeformed) configuration to the current (deformed) configuration is described by the deformation gradient tensor F, and the small incremental deformation from the deformed configuration to is denoted as , where denotes the small increment from to . As mentioned above, the deformation from to is assumed to be infinitesimal, and, thus, the two configurations and are very close to each other.
The incompressible constraint J = det(F) = 1 in the incremental form is
| 3.22 |
where , denotes the incremental displacement.
Inserting S into the equilibrium equation (3.3) and noticing that [131], we obtain
| 3.23 |
The incremental form of equation (3.23) is
| 3.24 |
where we assume that ḃ = 0. From equation (3.12), we obtain
| 3.25 |
where or, in component form, . To push into configuration , we further define the update incremental stress . Then, we have
| 3.26 |
Equation (3.25) can be rewritten as
| 3.27 |
where
| 3.28 |
Inserting equation (3.27) into (3.26) and recalling the incompressible constraint given by tr(Ḟ0) = 0, the updated form of equation (3.24) can be obtained
| 3.29 |
The above equation together with the incremental incompressible constraint given by equation (3.22), is the governing equation for the incremental motion.
(b). Mechanics of static elastography
In static elastography, the deformation and strains are assumed to be small, and the linear elasticity theory is typically used. The specific mechanical model is briefly introduced here based on the governing equations in §3a. Inserting equation (3.11) into equation (3.3) and ignoring the body force and inertia force, we obtain
| 3.30 |
As shown in figure 13a, here, we take an inclusion buried in surrounding soft tissues as an example. For simplicity, we consider a plane strain problem (i.e. the materials cannot deform in the x3-direction) [48]. The Lamé constants of the surrounding tissue and the inclusion are λ(1), μ(1), and λ(2), μ(2), respectively, where the superscripts ‘(1)’ and ‘(2)’ denote the surrounding tissue and the inclusion, respectively. When the tissue is slightly compressed relative to the undeformed configuration , the normal displacement at the contact region (−a < x1 < a, 2a is the width of the ultrasound probe) between the probe and the skin is described as , whereas the tangential displacement is not constrained. Therefore, the BCs on x2 = 0 are
| 3.31 |
Figure 13.
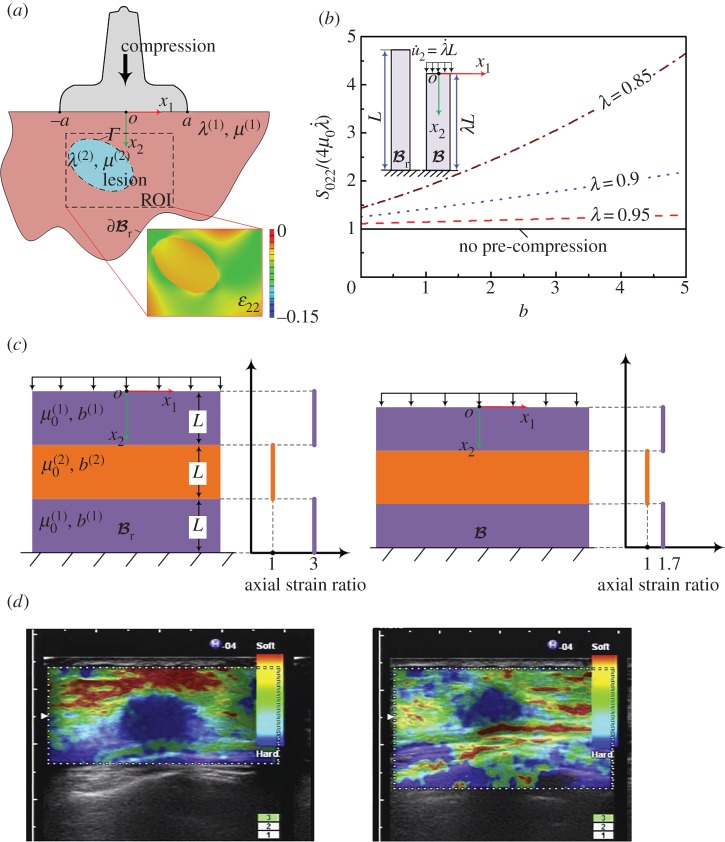
(a) Schematic of the mechanical model underlying static elastography and the axial strain in the ROI calculated by FEA (). The inclusion in the ROI is harder than the surrounding tissue. (b) Effect of pre-compression on the elastic modulus measured via static elastography. (c) Illustration of the decrease in the axial strain image contrast caused by pre-compression. The ratio of the initial shear moduli of the two materials is μ(2)/μ(1) = 3. A 10% pre-compression will cause the strain ratio to decrease from 3 to 1.7. (d) The decrease of the strain image contrast due to the excessive compression observed in the experiment of Shiina et al. [39]. Reprinted from reference [39] with permission. (Online version in colour.)
The boundary is assumed to be fixed, i.e.
| 3.32 |
At the interface Γ between the inclusion and the surrounding tissue, the two materials are assumed to be tied together; therefore, the interfacial conditions (ICs) are
| 3.33 |
With the BCs and the ICs, the direct problem given by equation (3.30) can be solved either theoretically or numerically, such as via FE. In figure 13a, the map of ϵ22 within the ROI is calculated for illustration. The distribution of the axial strain within the biological tissues/organs provides physicians with useful information regarding the homogeneity of the tissues/organs. As shown in figure 13a, the strain contrast (i.e. the low compression strain within the elliptical area) obviously indicates the existence of a hard inclusion. The use of elastography to obtain axial strain maps has found wide applications in clinical diagnosis [14,42,45,47].
Although the axial strain can reflect the stiffness distribution in soft tissues, quantitatively measuring the elastic properties of soft tissues using static elastography by solving the inverse problem remains challenging [6,41,48]. This is because, in static elastography, the strain field in the soft tissue depends not only on the physical parameters of the system, but also on the BCs and ICs, which are difficult to accurately determine in most cases. In the literature, methods for obtaining maps of the relative elastic moduli (e.g. the shear moduli ratio μ(2)/μ(1)) have been investigated [41,43,44,48,146–148], and readers can refer to the review paper by Doyley for more details [6] regarding the challenges and usefulness of determining μ(2)/μ(1). Assuming that the inclusion is a small cylinder embedded in an infinite matrix and that the composite is compressed, Kallel et al. [48] obtained
| 3.34 |
where Q = μ(2)/μ(1), , and ν is the Poisson ratio of both the inclusion and the matrix. Note that and denote the axial strain far from the inclusion and the axial strain at the centre of the cylinder [48], respectively. Using this simple relation, the moduli ratio μ(2)/μ(1) can be determined from the measured axial strain ratio [147].
Another important issue affecting the practical use of static elastography is the effect of nonlinear elasticity. Indeed, in many cases, the pre-compressions were used to improve the image contrast [3,46]. To illustrate this issue, here, we use static incremental theory to analyse the deformation of a soft tissue. In this case, the incremental motion, which is used to compress the pre-deformed tissue and obtain the axial strain image, is quasi-static; i.e. . We consider a homogeneous tissue modelled using the Demiray–Fung model [140,141] and pre-compressed along the x2-direction (figure 13b). The deformation gradient tensor is homogeneous and denoted as F = diag(λ−1,λ,1), where λ is the stretch ratio along the x2-axis (i.e. the axial direction). In this case, the incremental stress can be determined using equation (3.27) and is given by
| 3.35 |
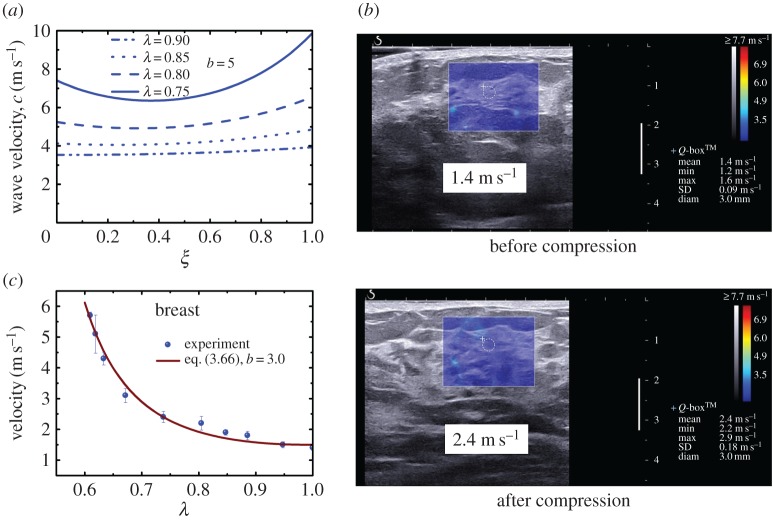
where denotes the incremental stretch ratio (figure 13b). When λ = 1 (i.e. there is no pre-compression), equation (3.35) reduces to . However, when pre-compression is applied, it stiffens the tissues. For illustration, the variation of the dimensionless stiffness with the hardening parameter b in the Demiray–Fung model [140,141] for different amounts of pre-compression is plotted in figure 13b. Clearly, the pre-compression results in the overestimation of the tissues stiffness, especially for larger b. For different biological tissues, such as brain, liver and breast, b varies over a wide range (e.g. from 0.2 to 4.5) [8,27]. In the static elastography of breast tissues, whose hardening parameter b is approximately 3.0, the pre-compression strain used in the measurement may be as high as 10% [149]. According to figure 13b, in this case, Young's modulus may be overestimated by approximately 60%. To reduce the risk of misdiagnosis [39,150], choosing a proper level of pre-compression is crucial, which requires knowledge of the nonlinear elastic parameters of soft tissues (e.g. the hardening parameter b in the Demiray–Fung model).
To further illustrate the effects of pre-compression on the axial strain image contrast, we consider a simple multi-layered model, as shown in figure 13c. In this model, a stiff layer is embedded in two soft layers. The initial shear modulus of the stiff layer is denoted as , and is the initial shear modulus of the soft layers. The hardening parameters of the stiff layer and softer layers are denoted as b(2) and b(1), respectively. For illustration, we take b(1) = b(2) = 3. When an overall pre-compression is applied to the composite, the compression strain in the soft layers is greater than that in the stiff layer because . For example, when , and the overall pre-compression is 10%, the compression strain in the softer layers is 12.3%, whereas that in the stiff layer is 5.5%. According to figure 13b, the hardening effect in the softer layers is more significant, indicating that the hardening effects within these layers are different. As shown in figure 13c, the axial strain ratio will drop to 1.7 instead of 3.0 when a pre-compression of 10% is applied (i.e. the contrast of the axial strain image will decrease). This issue has also been discussed by Shiina et al. [39] (figure 13d).
(c). Mechanics of dynamic elastography with harmonic stimuli
For elastography methods with harmonic stimuli, the steady responses of the target tissues are typically used to determine the tissue mechanical properties. Then the inverse problem involved in this case may be divided into two categories: the modal analysis method and the shear wave analysis method.
Modal analysis methods include the vibration amplitude sonoelastography and SWIRE [55,61]. Taking a homogeneous medium with a hard/soft inclusion as an example, when the target soft material is forced to vibrate, a state-steady pattern that relies on the mechanical properties of the inclusion is formed. For example, a softer inclusion may yield larger local displacement. Thus, lesions within the tissues can be identified [56]. Moreover, when the frequency of the excitation reaches the resonance frequency of the soft inclusion, the amplitude of the displacement within the inclusion will reach the peak value. Therefore, the contrast between the inclusion and the surrounding tissue also increases. Under the condition that the inclusion is softer than the surrounding matrix, the uniqueness of the resonance mode can be guaranteed; therefore, the resonance frequency can also be used to quantitatively measure the mechanical properties of the inclusion, assisted by an FE model [61]. One challenge in modal analysis methods is that the modal shape relies strongly on the BCs [151]. For example, Gao et al. [55] used fixed BCs, whereas Schmitt et al. [61] used the so-called perfectly matched layer to avoid reflection of the shear waves [152]. Moreover, quantitatively inferring the material parameters from the experimental responses via modal analysis methods requires the use of the FEM, which might complicate the use of this technique by clinicians.
Most other DEHS methods, including vibration-phase gradient sonoelastography, CWI, HMI and SDUV, use the shear wave analysis method to extract the mechanical properties of soft tissues. The wave motion equation can be obtained by inserting equation (3.11) into equation (3.3)
| 3.36 |
When considering the steady state of plane wave propagation, the body force ρb may be assumed to be zero.
To consider the dispersion of the shear wave resulting from the viscoelastic deformation of soft tissues, the viscosity of biological tissue must be considered by assuming that the stress depends on the derivatives of the strain components and the strain components themselves [153]. Thus, in equation (3.11), the Lamé constants should be written as
| 3.37 |
where μ2 and λ2 are the coefficient of shear and the volume viscosity, respectively.
For the plane shear wave considered here, without loss of generality, we suppose that and that other displacement components are zero, where ω and k are the angular frequency and wavenumber, respectively. Thus, the transverse (shear) wave propagates along the x1-axis. Inserting u2 and equation (3.37) into equation (3.36), we obtain
| 3.38 |
where i denotes the imaginary unit. Because k is a complex number, its real part determines the phase velocity of the shear wave
| 3.39 |
whereas its imaginary part determines the attenuation of the wave [153,154]. Inserting equation (3.38) into equation (3.39), we obtain
| 3.40 |
The above equation has been used to describe the dispersion of low-frequency shear waves in biological tissues [16,29,36,74,75]. By fitting the experimental dispersion curve, both μ1 and μ2 can be obtained.
Based on shear wave elastography methods using harmonic stimuli, in theory, we can quantitatively measure both the elasticity and viscosity parameters of a homogeneous soft tissue. However, a drawback of this type of method is that the resolutions of the methods are limited by the low frequency of the shear waves which corresponds to a relatively large wavelength. When the typical dimension of a soft tissue (e.g. the size of a lesion) is comparable to or even smaller than the wavelength, the mechanical properties cannot be simply determined using an analytical solution such as the one given by equation (3.40).
(d). Mechanics of dynamic elastography with transient stimuli
The mechanics of DETS is presented in this subsection. Considering that in many soft tissues are clearly anisotropic and that the effects of pre-stresses may come into play, elastography of anisotropic soft tissues and pre-deformed soft tissues is also discussed here. It should be pointed out that the mechanics models discussed here focus on the elastic medium. In this case, the plane wave assumption can be used to derive the correlation between the velocities of elastic waves and material parameters. However, if the medium is modelled as a viscoelastic material and the attenuation of the shear wave is used to infer the viscoelastic parameters, attenuation caused by both the geometry of the wavefront and the viscosity of the medium should be considered.
(i). Mechanical model for the transient elastography method
The mechanical model underlying the TE method may be simplified as the transient motion of an elastic half-space induced by a local vibrator imposed on the surface. The theoretical analysis of this issue dates back to the classical works of Lamb [155] and Pekeris [156]. The key results have been summarized in detail in the textbook [123] and are briefly presented here.
To consider the transient shear wave induced in TE, we first consider the motion of a half-space induced by a concentrated force perpendicular to the surface of the half-space, as shown in figure 14a. The BCs at x3 = 0 are
| 3.41 |
and the initial conditions (ICs) are
| 3.42 |
Figure 14.
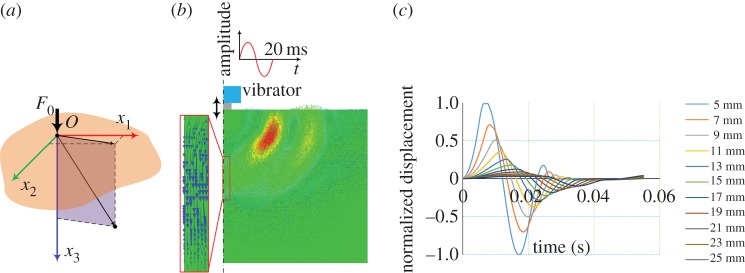
(a) Schematic of the Lamb problem (i.e. the motion of a half-space induced by a concentrated force). (b) Typical displacement field in the TE given by FEA. The frequency of the vibrator is 50 Hz and the loading process lasts 20 ms. (c) The axial displacements of the points on the axis at different depths (5 ∼ 25 mm). The displacements are normalized by the displacement at the depth of 5 mm. Based on the arrival times of the displacement peaks, the velocity of the transient wave can be determined. (Online version in colour.)
It is convenient to solve equation (3.36) with the above BCs and the ICs in cylindrical coordinates because this problem is axisymmetric. Achenbach solved this problem by using the integral transformation method [123]. Once this problem is solved, the displacement field in the TE induced by a local distribution force can be obtained using the superposition principle [151]. To demonstrate the key mechanics underlying the TE method, FE analysis (FEA) is performed here, and the results are shown in figure 14.
Figure 14b indicates the displacement field at a typical time revealed by FEA after the push by the vibrator. Clearly, the shear waves mainly propagate along the direction corresponding to an angle of approximately 45° relative to the vertical direction. The problem is axisymmetric; therefore, the displacements of the material points along the axis of symmetry (i.e. their polarized directions) are parallel to the loading direction. Because the propagation direction of the wave is also along the loading direction, the wave along the loading direction appears to be a longitudinal wave. By tracking the propagation velocity of this wave (i.e. the arrival time of the peak displacement at different points), as shown in figure 14c, the velocity of the wave is ct instead of c1, where ct and c1 are the bulk transverse (shear) and bulk longitudinal (compression) wave velocities, respectively, which are defined as [123]
| 3.43 |
Sandrin et al. explained this phenomenon in terms of the diffraction effect [101]. In their recent work, Catheline & Benech [157] discussed this longitudinal shear wave in detail [157]. The longitudinal shear wave is shown to quickly decay when the wave propagates away; however, it can be monitored and tracked in TE because of its long wavelength in soft tissues.
By tracking the propagation of the longitudinal shear wave along the loading direction, the shear velocity cT can be measured. Then, according to equation (3.43), the elastic modulus of the incompressible soft tissue can be determined as
| 3.44 |
assuming that the mass density of the soft biological tissue is known. Equation (3.44) is used in most transient shear wave elastography methods (e.g. TE, ARFI-based SWEI, SSI and CUSE) although these methods involve different mechanical models.
(ii). Mechanical model involved in ARFI-based shear wave elasticity imaging
Here, we consider the initial value problem involved in the ARFI-based SWEI method, which uses the focused ARF to induce shear waves in soft tissues. This issue may be modelled as the action of the focused ARF at an internal point in an infinite solid. The body force is determined by equation (2.1) and is given by
| 3.45 |
Note that the amplitude of f in equation (3.45) can be arbitrary. Without loss of generality, is parallel to the xm-axis (m = 1,2,3); therefore, , where δim is the Kronecker delta. Using the f given by equation (3.45) to replace ρb in equation (3.36), we can obtain the equilibrium equation in the following component form:
| 3.46 |
The above equation and the initial condition given by equation (3.42) form the initial value problem involved in SWEI. The solution to this problem is referred to as solution of the Green function [123,158,159], and that can be tracked with ultrasound elastography in soft tissues reads [34]
| 3.47 |
where r = |x|, . The superscript of indicates that the solid is isotropic, and the subscript m indicates that f is applied along the xm-axis. Equation (3.47) indicates that the shear wave has a spherical wavefront in space. The propagation velocity of the wavefront is ct.
Note that according to the elastodynamic representation theorem [123], for any body force f(x,t) which may vary with time and coordinates, the solution to equation (3.36) can be obtained from the Green function solution by
| 3.48 |
For example, various ultrasound push beams have been applied to induce shear waves within soft tissues in CUSE [96,112]. In this case, the distribution of the ARF may be diverse, and the resulting displacement field can be determined by solving equation (3.48) when the distribution of the body force is given.
(iii). Mechanics underlying supersonic shear imaging
In the SSI technique, the ultrasound beams are successively focused at different depths within the soft tissue (i.e. the ARF moves with a given velocity). In this case, the body force induced by the ultrasound beam can be simplified as
| 3.49 |
where vf is the moving velocity of the focused ARF. It should be noted that the ARF is discrete in a practical use and applied at different points instead of a continuous function as given in equation (3.49); however, such a simplification indeed can retain the physical nature of the problem and brings great ease for theoretical and computational modelling. Studying the elastodynamic fields produced by moving loads is a classical issue in mechanics, and many relevant works exist in the literature [160–162]. Here, the moving direction of the force is along . Without loss of generality, let , which indicates that the force is moving along x3.
We consider the case in which the moving velocity vf is substantially greater than the velocity of the shear wave in the soft tissue. In practical applications of the SSI technique, the velocity of the moving ARF is essentially the velocity of the ultrasound wave, which is hundreds of times larger than the shear wave velocity in soft tissues. Inserting equations (3.49) and (3.47) into equation (3.48), the resulting displacement field induced by the moving force has been obtained as [34,107]
| 3.50 |
where MIso = vf/ct is defined as the Mach number,
| 3.51 |
| 3.52 |
| 3.53 |
The solution given by equation (3.50) forms the basis of the SSI technique [20,107]. According to equation (3.50), MIso > 1 confines the displacement within a circular cone (i.e. |sinΘ(t)| < 1/MIso), indicating the formation of the shear-wave Mach cones. This phenomenon is the so-called ECE [107]. The Mach cone of the elastic wave within the elastic solid can also be induced by other stimuli, such as the movement of a dislocation. In this case, the formation of shear-wave Mach cones is also referred to as the elastodynamic Tamm problem, which has recently been studied by Lazar & Pellegrini [162]. In the SSI technique, the Mach number is large, and the angle of the Mach cone is very small. Therefore, quasi-plane waves form and the interfered wavefronts basically propagate in opposite directions. The moving velocity of interfered wavefronts can be measured to further determine the local elastic properties of soft tissues.
(iv). Mechanics of guided wave elastography
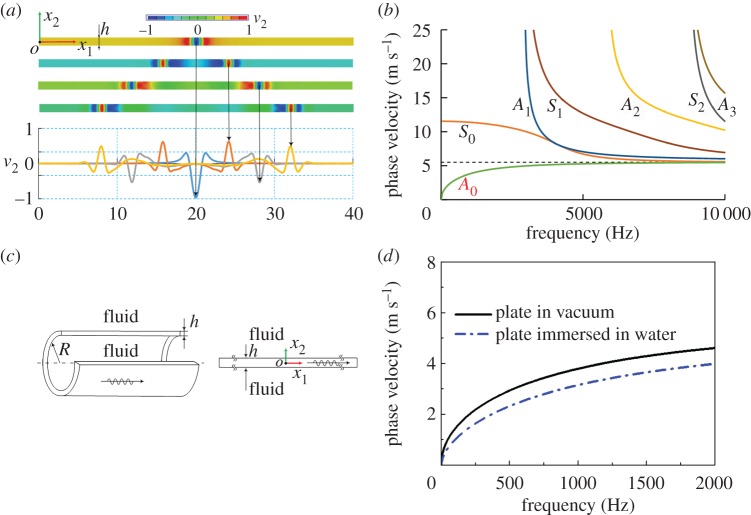
The aforementioned methods (i.e. the TE, ARFI-based SWEI and SSI methods) use wave theories in infinite media to interpret experimental data and infer the material parameters by assuming that the wavelength of the shear wave is much smaller than the dimension of bulk tissues such as liver and breast. However, elastic waves in a thin-walled structure with thickness smaller than or comparable to the wavelength are guided. The guided waves are strongly dispersive as shown in figure 15a, and in this case, guided wave theory should be used. A typical guided wave is the so-called Lamb wave [123,124] (figure 15a). According to Lamb wave theory, only the wave modes of which the angular frequency ω and the wavenumber k satisfy the following dispersion equation:
| 3.54 |
can propagate within the elastic plate. In equation (3.54), , and , where k1 = ω/c1, and kt = ω/ct. h denotes the thickness of the plate. Equation (3.54) can be solved numerically. As shown in figure 15b, both the antisymmetric and symmetric modes, denoted as An and Sn (n = 0, 1, 2,…), respectively, have countless branches. Guided waves such as Lamb waves have been widely used in non-destructive testing [163,164] and the mechanical characterization of engineering materials [165,166]. Unlike traditional engineering materials, elastic waves in soft materials (e.g. biological soft tissues) have much lower frequencies (typically no more than 2000 Hz). Therefore, only the dispersion curve of the zero-order antisymmetric mode (i.e. the A0 mode) is adopted in GWE methods.
Figure 15.
(a) Propagation of guided waves in an elastic plate. When the transient shear waves generated at the centre of the plate propagate in opposite directions, the wavefronts change constantly. (b) Dispersion relation of the antisymmetric and symmetric modes of the Lamb wave. (c) The simplified model used in GWE of the arterial wall. (d) The dispersion relations of the A0 mode in elastic plates in vacuum and immersed in water. (Online version in colour.)
GWE has promising applications in the characterization of arterial stiffness, which may potentially be used to diagnose some cardiovascular diseases [167,168]. Following previous studies [117,118], the arterial wall has been considered to be an elastic hollow cylinder surrounded by water both inside and outside. As shown in figure 15c, the inner radius and wall thickness of the hollow cylinder are R and h, respectively. Furthermore, the curvature of the hollow cylinder is ignored. This assumption will be discussed in detail later and is justified only when the frequency is sufficiently high. Then, the model can be simplified as an elastic plate immersed in fluid as shown in figure 15c. In this case, the dispersion equation is [169]
| 3.55 |
where , is the velocity of pressure wave in the fluid, and κ and ρF are the bulk modulus and mass density of the fluid, respectively. Directly comparing equations (3.54) and (3.55) shows that the effect of the surrounding fluid appears in the third term of equation (3.55). When ρF is close to ρ, the surrounding fluid will significantly affect the dispersion relation, as shown in figure 15d. In practice, the fluid is considered to be water, for which κ = 2.2 GPa and ρF = 1000 kg m–3. The mass density of soft biological tissues is usually very close to that of water and typically assumed to be 1000 kg m−3. For a plate immersed in water, the phase velocities of the A0 mode are significantly smaller than those of a plate in vacuum within the frequency range of 0–2000 Hz. Equation (3.55) can be used to fit the experimental dispersion curve to infer the elastic modulus of the arterial wall.
Recently, vessel-mimicking phantom experiments have revealed that only the experimental dispersion curve in the high-frequency range can be well approximated by equation (3.55) [117,118]. Therefore, Maksuti et al. [170] adopted a frequency of 500 Hz as a critical frequency and used only the data beyond this critical frequency in the curve fitting. As mentioned above, this deviation stems from the assumption that the effect of curvature on the dispersion relation is negligible. In fact, this assumption is only valid when the frequency is sufficiently high [171]. The critical frequency, which is denoted as fc, and beyond which the Lamb wave model given by equation (3.55) works in principle, depends on both R/h and the elastic modulus of the cylinder. In a recent study, using dimensional analysis and systematic FE simulations, the explicit expression of the critical frequency was obtained [119]
| 3.56 |
When the frequency exceeds fc, the relative error between the phase velocity given by equation (3.55) and that of the guided axial wave is less than 5%. Furthermore, an inverse approach based on equations (3.56) and (3.55) has been proposed to identify both the elastic modulus of an artery and the critical frequency from the experimental dispersion curve [119]. Typical results for vessel-mimicking phantoms with different elastic moduli are presented in figure 16.
Figure 16.
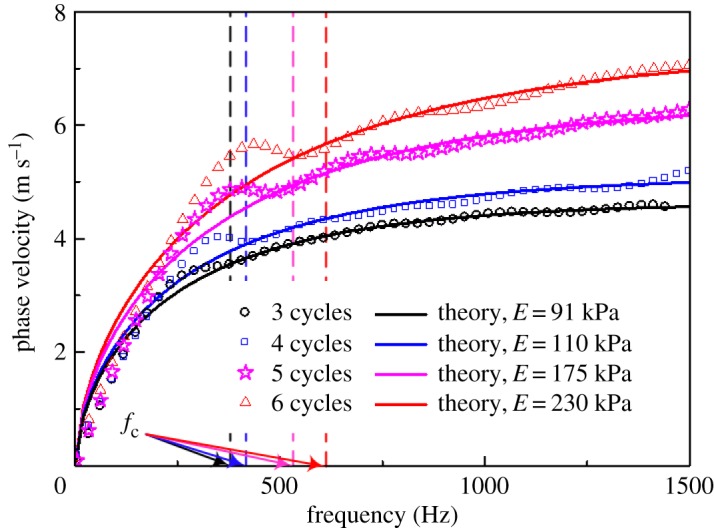
Experimental results (discrete points) obtained from vessel-mimicking phantoms with different elastic moduli are fitted with equation (3.55) (solid lines). The vessel-mimicking phantoms were made from polyvinyl alcohol cryogel which underwent different freezing/thawing cycles, i.e. three to six cycles, and had different elastic moduli. Both the critical frequencies and the elastic moduli of the phantoms are determined according to the method suggested in [119]. (Online version in colour.)
(v). Shear wave elastography of anisotropic soft tissues
Many soft tissues such as skeletal muscles and tendons are anisotropic and may be described using the TI model given by equation (3.10). In the following discussion, the fibre direction is always along the x3-axis.
In anisotropic soft media, the velocities of shear waves are direction-dependent. The displacement caused by the plane wave is assumed to be , where is the wavevector, k = |k| denotes the wavenumber, and ω represents the angular frequency. The phase velocity c is defined as c = ω/k, and U = Uiei, where ei denotes the base vector. Inserting u into equation (3.10) to obtain the stress components, the equilibrium equation (3.3) can be written as
| 3.57 |
According to equation (3.57), the existence of a non-zero U requires
| 3.58 |
From equation (3.58) and using the relationship between and μT, μL and EL, the two bulk shear wave speeds can be obtained from
| 3.59 |
The subscripts ‘SH’ and ‘qSV’ denote the horizontally and quasi-vertically polarized shear waves, respectively [172]. Here, we define C = (EL + μT−4μL)/2. Note C = 0 denotes a special type of TI material; in this case, the phase velocity of the ‘qSV’ mode becomes isotropic, as shown in figure 17. Besides, the group velocity, which is defined as cg = ∂ω/∂k (i.e. the velocity of a wave packet) can be obtained according to equation (3.58).
Figure 17.
Plot of the phase velocity. Because vqSV is axisymmetric, only the distribution of vqSV in the x1–x3-plane is plotted. For all three cases, μT = 9 kPa, μL = 25 kPa, and the parameter C is (a) 62.5 kPa, (b) 0 and (c) −21.875 kPa, respectively. (Online version in colour.)
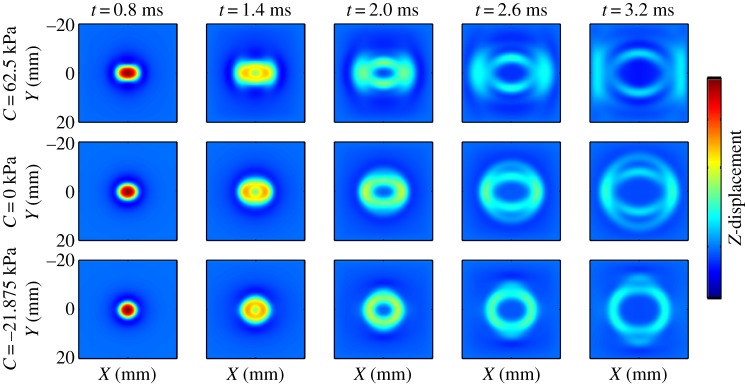
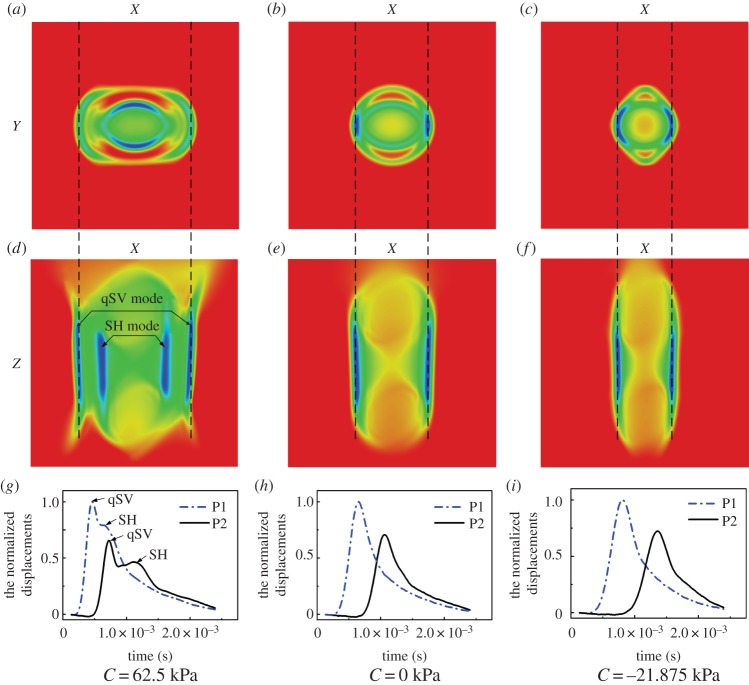
When measuring the arrival time of the shear waves generated by a concentrated force, the group velocity can be determined from the travelling distance of the wave divided by the arrival time [154,173]. In SWEI, the group velocities can be measured in this way, and the mechanical parameters can be determined [35,106]. Figure 18 shows the shear waves in TI media generated by a simulated ARF [35]. The force is applied along the Z-direction, which has an angle of 45° with the x3-axis direction (fibre direction); therefore, both shear wave modes are induced. The wavefront propagates away from the load point at the group velocity. Clearly, for materials with different values of C, the shapes of wavefronts for the qSV mode are different, as predicted by equation (3.59). Because the qSV mode, which is related to EL, can be induced in this way, Rouze et al. [35] suggest using the ARFI-based SWEI with the experimental set-up described by their FEA to fully characterize the elastic parameters of a TI material.
Figure 18.
FE simulation of shear wave propagation in TI materials with different values of C. For all three cases, μT = 9 kPa, and μL = 25 kPa. The direction of the focused ARF is applied along the Z-axis, which has a 45° angle with the x3-axis (fibre direction) [35]. Reprinted from reference [35] with permission. (Online version in colour.)
More conveniently, if the phase velocities can be measured, then equation (3.59) can be used to determine the mechanical properties. The phase velocities are easy to measure for the plane waves. Because of the ECE in the isotropic elastic medium, quasi-plane waves can be generated within the soft tissue by the ARF moving at a high speed. Addressing the ECE in the anisotropic elastic media is very important for the determination of the anisotropic elastic parameters of soft tissues. Li et al. [34] recently studied and revealed the ECE in TI medium through both theoretical analysis and numerical simulations. Figure 19a–f shows the displacement field when the moving direction of the ARF has a 45° angle with the fibre direction. According to equation (3.59), the phase velocity of the SH mode is only dependent on the two shear moduli μT and μL [36,174]. However, the phase velocity qSV mode is highly dependent on parameter C (or EL). For illustrative purposes, the normalized displacements of the qSV mode at two points located on the X-axis (denoted as P1 and P2 respectively) are plotted in figure 19g–i. The shear wave velocity can be determined from the arrival time of the peak displacement. In this case, the phase velocities of the qSV mode with wavevector can be determined [34]. Then, according to equation (3.59), we have
| 3.60 |
where denotes the velocity of the interfered wavefronts measured from figure 19g–i.
Figure 19.
The ECE at a high Mach number when the angle between the direction of the moving force (Z-axis) and the fibre direction (x3-axis) is taken as 45°. (a,d,g) C > 0; (b,e,h) C = 0; (c,f,i) C < 0. For all three cases μT = 9 kPa, and μL = 25 kPa [34]. (Online version in colour.)
To fully determine the mechanical properties of the TI medium, the experimental set-up shown in figure 20 has been proposed [33]. When the ultrasound probe is placed as shown in figure 20, the qSV mode shear wave can be generated and used to measure EL if μT has been determined. Such an experimental protocol can be easily realized using the SSI technique, and the three independent elastic parameters of skeletal muscles can be measured in vivo. Experiments have been conducted on the biceps brachii and gastrocnemius muscles of volunteers [33], and the shear moduli determined are in good agreement with previously reported data [36,47,175–177].
Figure 20.
The SSI-based experimental protocol used to fully characterize skeletal muscles. (a,d) The SH mode shear wave is generated along the fibre direction and its velocity, , is measured. According to equation (3.59), μL can be measured as . (b,e) Similarly, μT can be measured using the SH mode shear wave propagating perpendicular to the fibre according to . (c,f) In this step, the velocity of the qSV mode shear wave, , is measured. Then EL can be determined as [33]. (Online version in colour.)
(vi). Shear wave elastography of pre-stressed soft tissues
In most ultrasound elastography measurements, the soft tissue it is assumed to be stress free. However, in practical measurements, the contact between the probe and soft tissues may lead to finite deformation. Moreover, analysing the propagation of the shear wave in a pre-stressed soft tissue enables the determination of the tissue's hyperelastic parameters. The effect of pre-stress on wave propagation has been investigated previously [26,178–181]. Here, we use the incremental dynamic theory described in §3a to address the effect of pre-stress on the propagation velocities of shear waves in soft tissues [8,34,131,133,134,182].
The deformation gradient (i.e. F) induced by the pre-deformation is assumed to be homogeneous in the ROIs. In this case, equation (3.29) can be simplified as
| 3.61 |
According to equation (3.22), by the incompressibility constraint. Furthermore, the deformation gradient can be written as F = diag(λ1,λ2,λ3), where λi (i = 1,2,3) denotes the stretch ratio along the xi-axis (figure 21), and λ1λ2λ3 = 1 because of the incompressibility constraint. Under these conditions, the fourth-order tensor can be determined according to equation (3.28)
Figure 21.
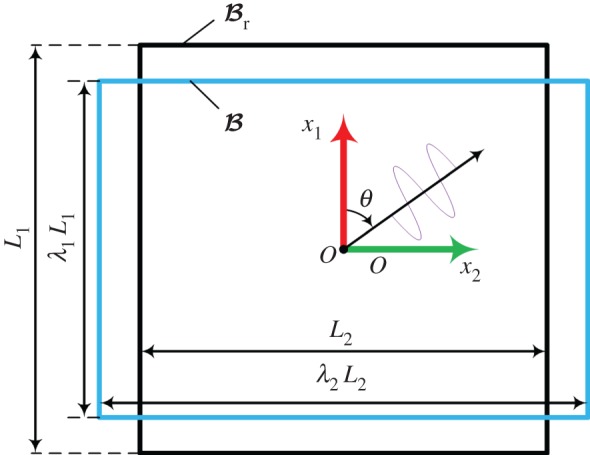
Schematic of the finite deformation of the tested material and the wave propagation. (Online version in colour.)
First, we consider isotropic hyperelastic materials. For a plane wave propagating within the plane of x1 − x2, i.e. , and we can define, , and . ψ is a scalar function of (x1,x2,t) and is assumed in the form
| 3.62 |
where k and c denote the wavenumber and phase velocity, respectively, and θ denotes the wave propagation direction, as shown in figure 21. Inserting the incremental displacement components into equation (3.61) and eliminating , we can obtain the explicit expression for the phase velocity [133,139]
| 3.63 |
where
| 3.64 |
According to equation (3.63), the propagation velocity is direction-dependent and depends on the choice of constitutive laws. For example, when the Demiray–Fung model is adopted and θ = 90°, we obtain
| 3.65 |
In practice, we may compress the soft tissue along the x1-axis, i.e. λ1 = λ is prescribed. Then we define λ2 = λ−ξ, where the parameter ξ is determined by the deformation state within the soft solid; for example, ξ = 0.5 indicates uniaxial compression, whereas ξ = 1 represents the plane-stain state. In practical measurements, ξ can be measured [8,27]. Using those notations, equation (3.65) can be written as
| 3.66 |
Figure 22a shows the dependence of the wave speed on parameter ξ for different λ when b = 5. Clearly, when 0.1 ≤ ξ ≤ 0.8, the effect of ξ on the wave velocity is not significant. Equation (3.66) provides the relationship between the pre-deformation and the shear wave velocities, from which the effect of pre-deformation on the wave propagation can be quantitatively evaluated. Moreover, based on equation (3.66), Jiang et al. established an inverse approach and measured the hardening parameter b of human breast and human heel fat pad tissues in vivo and porcine brains ex vivo [8,27]. Figure 22b,c shows the shear wave velocities measured before and after compression. By fitting the shear wave velocities at different compression strains with equation (3.66), the hardening parameter b can be obtained.
Figure 22.
(a) Dependence of the wave speed on parameter ξ for different λ. (b) The velocities of the shear waves in breast tissues before and after compression. (c) Variation of the shear wave velocities with compression strains determined by SSI, which can be fitted with equation (3.66) to obtain b [8]. (Online version in colour.)
Effects of the pre-stress on wave propagation have been studied [26–28,182] for isotropic hyperelastic materials described with the constitutive law given by equation (3.15). The following analytical solution was derived:
| 3.67 |
assuming that the soft material is loaded with uniaxial pre-compression stress σ11 along x1-axis and that the shear wave is propagating along the x2-axis. Using equation (3.67), parameter A has been measured for agar-gelatine and polyvinyl alcohol cryogel phantoms. In their recent work, Bernal et al. [28] further adopted equation (3.67) to establish an inverse approach to measure A. In their approach, the strain field is measured using static elastography, and, thus, the stress field can be determined. By gradually increasing the compression and measuring the incremental strain and shear wave velocities, the relationship between the stress and the shear wave velocity can be obtained and used to determine A according to equation (3.67). The initial experiments, as shown in figure 23, have demonstrated the potential of this method for enhancing the contrast between a lesion and its surrounding tissues [28].
Figure 23.
Experimental results obtained for three patients: a healthy volunteer, a patient with a tumour and a patient with a benign lesion. (a,d,g) B-mode images, (b,e,h) shear moduli and (c,f,i) nonlinear parameter A values [28]. Reprinted from reference [28] with permission. (Online version in colour.)
In addition to isotropic hyperelastic materials, the effects of pre-stress on shear wave propagation in TI hyperelastic materials have also been studied [33,34,183–185]. For the constitutive law given by equation (3.21), the phase velocity of the SH mode shear wave can be obtained as
| 3.68 |
where I1 is defined in equation (3.13). When no pre-deformation exists (i.e. λ1 = λ2 = λ3 = 1), equation (3.68) reduces to equation (3.59). The hardening parameter c2 can be measured by using the inverse method proposed in [34]. The experiments conducted in [33] determined the hardening parameter c2 of beef muscles ex vivo (figure 24).
Figure 24.
The shear wave velocities of the beef ex vivo (a) before and (b) after compression. (c) By fitting the variation of the shear wave velocities with the compression strain, the parameter c2 was determined [33]. (Online version in colour.)
4. Discussion
This paper provides an overview of both static elastography and dynamic elastography with focus on the mechanics principles underlying these methods. Static elastography is relatively easy to realize and can qualitatively differentiate between soft tissues with different stiffnesses because soft tissues with different elastic moduli will undergo different amounts of deformation under external or internal stimuli. In addition to the compression strain along the loading direction, other deformation information may be acquired in static elastography. For instance, the interfacial bonding conditions between a benign tumour and the surrounding soft tissue and those between a malignant tumour and surrounding soft tissue are usually different. Therefore, by tracking the deformation at the interface (e.g. the shear strains at the interface), it is possible to differentiate a malignant tumour from a benign one using the static elastography method [186], as illustrated in figure 25. Here, the challenge is to accurately evaluate shear strains at the interface, which deserves further efforts.
Figure 25.
Axial-shear strain images from FEM of (a) a firmly bonded inclusion and (b) a loosely bonded inclusion. The coefficient of friction was 0.01, and the applied axial strain was 2%. The inclusion was twice stiffer than the background in both cases [186]. Reprinted from reference [186] with permission. (Online version in colour.)
In DEHS, a vibration source with a given frequency can be used to stimulate the soft tissue. Low-frequency (typically 100 Hz) shear waves generated in the soft tissue in the steady state are relatively easy to track using ultrasound imaging methods. However, a low-frequency shear wave corresponds to a relatively large wavelength. When the typical dimension of a soft tissue (e.g. the size of a lesion or inclusion) is comparable to or even smaller than the wavelength, its mechanical properties cannot be simply determined using an analytical solution such as equation (3.40). By contrast, shear waves generated in DETS are generally broad-band, and include more information that can be used to infer the material parameters. The centre frequency is typically 1000 Hz; therefore, the DETS in theory has better resolution than DEHS. In this sense, the DETS methods may be more suitable for evaluating the mechanical properties of soft tissues with finite dimensions. For instance, for a multilayer system, e.g. human skin [187], when a harmonic vibrator is used to induce shear waves in the dermis layer, the shear wave velocity depends not only on the material parameters of the dermis layer, but also on the mechanical properties of the adjacent layers and the geometrical parameters of the composites [187]. However, FEA shows that when a DETS method (e.g. the SSI technique) is used in this case, the velocity of the interfered wavefronts mainly depends on the mechanical properties of the dermis layer, and the effects of other parameters in the system are rather weak [187]. However, it should be noted that the viscosity of soft biological tissues may strongly attenuate the high-frequency shear waves and can significantly reduce the signal-to-noise ratio during the propagation of transient waves and affects the accuracy of wave velocities measured in a DETS method.
Although previous studies have demonstrated the usefulness of dynamic elastography methods for practical measurements, quantitatively measuring tissue mechanical properties using these methods remains challenging in many cases. Here, we take the GWE of arteries as an example. Real arterial walls have layered structures and GWE methods described in the literature are only able to determine the effective elastic modulus of the arterial wall [122]. Second, real artery tissues are anisotropic and contain distributed collagen fibres [142]. Although recent studies have demonstrated that determining the anisotropic and hyperelastic properties of a bulk anisotropic soft tissue is possible [33,34], assessing the anisotropic parameters of arterial walls using the shear wave elastography method is by no means trivial because the wave in the arterial wall is guided. Third, the modelled arterial wall is usually assumed to be a time-independent material, whereas a real artery may exhibit viscoelastic deformation. For viscoelastic soft tissues, the wavenumber k is no longer a real number but could be a complex number, reflecting the dissipation of the wave. Chan & Cawley [188] studied the dispersion curve of a viscoelastic plate. Their results showed that the lowest mode (i.e. the mode adopted in the inverse analysis) was essentially unaffected by the viscosity of the soft media. They also demonstrated that the high-order modes suffered from viscoelastic effects. Therefore, caution should be taken when adopting these higher-order modes. Fourth, in the literature, the outer region of the arterial wall was simplified to a non-viscous fluid to derive the theoretical solution in recent GWE methods. This assumption is only reasonable in some cases, such as carotid arteries, in which the elastic moduli of the arterial walls can be much greater than those of the perivascular tissues. Fifth, the effects of blood pressure in in vivo experiments cannot be ignored. In this case, a robust GWE method should consider guided waves in a pre-stressed soft tube.
Finally, note that identifying the material parameters using either static elastography or dynamic elastography represents an inverse problem. As mentioned above, an inverse problem may suffer from the issues of solution existence, uniqueness and stability. Among these issues, the stability of the solution is usually the key because the lack of stability will make the solution of an inverse problem have nothing to do with the real solution. Recently, Jiang et al. [8] introduced the concept of the condition number in analysing the stability of nonlinear elastic parameter A determined using the SSI technique via acoustoelasticity theory. For the strain energy density function given by equation (3.15), the following condition number in closed-form was derived in their study
| 4.1 |
where , , and Δc denotes the measurement error of the shear wave velocity c in experiments, which leads to an error ΔA in the identified A. Here λ and ξ are parameters describing the deformation of a soft tissue in the ROI [8]. Accordingly, the condition number measures the sensitivity of the identified solution of an inverse problem to data errors. The larger the condition number is, the more sensitive the identified solution to data errors will be. For example, when the condition number is 5, an error of 5% in the input data will lead to an error of 25% in the identified solution. Equation (4.1) reveals that sufficient compression (e.g. λ < 0.75) should be imposed on the soft tissue to decrease the condition number.
Therefore, to develop a robust elastography method for characterizing the mechanical properties of soft tissues or other soft materials, the existence, unique and stability issues of the solution to the inverse problem must be addressed. However, this issue has not received sufficient attention in the literature regarding ultrasound elastography.
5. Concluding remarks
Ultrasound-based elastography has emerged as a highly useful technique for characterizing the mechanical properties of soft materials, including living soft tissues, because of the extensive experimental and theoretical research performed in recent years, which has improved understanding of this technique and its applications, particularly in clinics. From the viewpoint of continuum mechanics, recent findings have contributed to shaping a set of unanswered questions that require investigations in future studies of static and dynamic elastography methods. Researchers, particularly those in the mechanics community, deserve to pay attention to these important issues. Some of these questions include the following: (i) How can we improve the current elastography methods based on the knowledge from the field of continuum mechanics to quantitatively determine the mechanical properties of soft tissues in critical cases, such as when the soft tissues are anisotropic and/or have finite dimensions (e.g. tumours) that significantly influence the propagation of shear waves? (ii) What opportunities exist for developing robust GWE methods to characterize the mechanical properties of thin-walled soft tissues, including arteries and bladder, in vivo based on the knowledge of guided wave in pre-stressed thin-walled soft solids? (iii) Diseases may alter the structures and functions of soft tissues/organs and change their mechanical properties. How can we model the diseased tissues/organs and determine which mechanical parameters (e.g. elastic, hyperelastic, viscoelastic and poroelastic parameters) are sensitive to the diseases, and further inspire the development of new elastography techniques? (iv) What new fundamental science can be explored (e.g. the propagation of elastic waves induced by a moving vibration source in pre-stressed inhomogeneous living soft tissues across different length scales)? (v) What new techniques are becoming available that could expand applications of ultrasound elastography and provide new opportunities to characterize diverse soft materials far beyond biological soft tissues?
Although the practical use of ultrasound elastography in quantitatively measurements of material parameters still faces challenges in many cases, based on the advances made in understanding this promising technique in recent years and the aforementioned opportunities for further study, one can reasonably predict that this technique has a bright future in a variety of fields, including not only medicine, but also biology, materials science, tissue engineering and soft matter physics. Note that this review gives emphasis to the mechanics theories involved in ultrasound elastography. Although understanding the responses of soft materials to various internal or external stimuli is by no means trivial, the knowledge obtained from continuum mechanics indeed helps yield some analytical solutions that can be used to interpret the experimental data.
Finally, we conclude this review with an old aphorism: ‘Simplicity is beauty’. Aleksandr Solzhenitsyn said, in his 1970 Nobel Prize speech, that ‘Beauty will save the world’. By pursuing fundamental solutions in simple forms that reveal the correlation between experimental responses and material parameters within the framework of continuum mechanics, we are not merely pursuing ‘beauty’ but also providing fundamental solutions that contribute to understanding ultrasound elastography methods and facilitate their practical use, particularly in medicine.
Acknowledgements
The authors acknowledge the helpful and constructive comments from anonymous reviewers, which greatly helped improve the paper.
Competing interests
We declare we have no competing interests.
Funding
We acknowledge support from the National Natural Science Foundation of China (grant nos. 11572179, 11172155, 11432008 and 81561168023).
References
- 1.Gao L, Parker KJ, Lerner RM, Levinson SF. 1996. Imaging of the elastic properties of tissue—a review. Ultrasound Med. Biol. 22, 959–977. (doi:10.1016/S0301-5629(96)00120-2) [DOI] [PubMed] [Google Scholar]
- 2.Ophir J, Alam SK, Garra B, Kallel F, Konofagou E, Krouskop T, Varghese T. 1999. Elastography: ultrasonic estimation and imaging of the elastic properties of tissues. Proc. Inst. Mech. Eng. H 213, 203–233. (doi:10.1243/0954411991534933) [DOI] [PubMed] [Google Scholar]
- 3.Greenleaf JF, Fatemi M, Insana M. 2003. Selected methods for imaging elastic properties of biological tissues. Annu. Rev. Biomed. Eng. 5, 57–78. (doi:10.1146/annurev.bioeng.5.040202.121623) [DOI] [PubMed] [Google Scholar]
- 4.Sarvazyan A, Hall TJ, Urban MW, Fatemi M, Aglyamov SR, Garra BS. 2011. An overview of elastography – an emerging branch of medical imaging. Curr. Med. Imaging Rev. 7, 255–282. (doi:10.2174/157340511798038684) [DOI] [PMC free article] [PubMed] [Google Scholar]
- 5.Parker KJ, Doyley MM, Rubens DJ. 2011. Imaging the elastic properties of tissue: the 20 year perspective. Phys. Med. Biol. 56, R1 (doi:10.1088/0031-9155/56/1/R01) [DOI] [PubMed] [Google Scholar]
- 6.Doyley M. 2012. Model-based elastography: a survey of approaches to the inverse elasticity problem. Phys. Med. Biol. 57, R35 (doi:10.1088/0031-9155/57/3/R35) [DOI] [PMC free article] [PubMed] [Google Scholar]
- 7.Gennisson JL, Deffieux T, Fink M, Tanter M. 2013. Ultrasound elastography: principles and techniques. Diagn. Interv. Imaging 94, 487–495. (doi:10.1016/j.diii.2013.01.022) [DOI] [PubMed] [Google Scholar]
- 8.Jiang Y, Li GY, Qian LX, Hu XD, Liu D, Liang S, Cao Y. 2015. Characterization of the nonlinear elastic properties of soft tissues using the supersonic shear imaging (SSI) technique: inverse method, ex vivo and in vivo experiments. Med. Image Anal. 20, 97–111. (doi:10.1016/j.media.2014.10.010) [DOI] [PubMed] [Google Scholar]
- 9.Evans A, Whelehan P, Thomson K, McLean D, Brauer K, Purdie C, Jordan L, Baker L, Thompson A. 2010. Quantitative shear wave ultrasound elastography: initial experience in solid breast masses. Breast Cancer Res. 12, R104 (doi:10.1186/bcr2787) [DOI] [PMC free article] [PubMed] [Google Scholar]
- 10.Barr RG, et al. 2015. WFUMB guidelines and recommendations for clinical use of ultrasound elastography: part 2: breast. Ultrasound Med. Biol. 41, 1148–1160. (doi:10.1016/j.ultrasmedbio.2015.03.008) [DOI] [PubMed] [Google Scholar]
- 11.Van Beers BE, Daire J-L, Garteiser P. 2015. New imaging techniques for liver diseases. J. Hepatol. 62, 690–700. (doi:10.1016/j.jhep.2014.10.014) [DOI] [PubMed] [Google Scholar]
- 12.Ferraioli G, et al. 2015. WFUMB guidelines and recommendations for clinical use of ultrasound elastography: part 3: liver. Ultrasound Med. Biol. 41, 1161–1179. (doi:10.1016/j.ultrasmedbio.2015.03.007) [DOI] [PubMed] [Google Scholar]
- 13.Blacher J, Asmar R, Djane S, London GM, Safar ME. 1999. Aortic pulse wave velocity as a marker of cardiovascular risk in hypertensive patients. Hypertension 33, 1111–1117. (doi:10.1161/01.hyp.33.5.1111) [DOI] [PubMed] [Google Scholar]
- 14.Cantisani V, et al. 2014. Ultrasound elastography in the evaluation of thyroid pathology. Curr. Status. Eur. J. Radiol. 83, 420–428. (doi:10.1016/j.ejrad.2013.05.008) [DOI] [PubMed] [Google Scholar]
- 15.Ophir J, Cespedes I, Ponnekanti H, Yazdi Y, Li X. 1991. Elastography: a quantitative method for imaging the elasticity of biological tissues. Ultrason. Imaging 13, 111–134. (doi:10.1177/016173469101300201) [DOI] [PubMed] [Google Scholar]
- 16.Yamakoshi Y, Sato J, Sato T. 1990. Ultrasonic imaging of internal vibration of soft tissue under forced vibration. IEEE Trans. Ultrason. Ferroelectr. Freq. Control 37, 45–53. (doi:10.1109/58.46969) [DOI] [PubMed] [Google Scholar]
- 17.Sandrin L, et al. 2003. Transient elastography: a new noninvasive method for assessment of hepatic fibrosis. Ultrasound Med. Biol. 29, 1705–1713. (doi:10.1016/j.ultrasmedbio.2003.07.001) [DOI] [PubMed] [Google Scholar]
- 18.Sarvazyan AP, Rudenko OV, Swanson SD, Fowlkes JB, Emelianov SY. 1998. Shear wave elasticity imaging: a new ultrasonic technology of medical diagnostics. Ultrasound Med. Biol. 24, 1419–1435. (doi:10.1016/S0301-5629(98)00110-0) [DOI] [PubMed] [Google Scholar]
- 19.Parker KJ, Fu D, Graceswki SM, Yeung F, Levinson SF. 1998. Vibration sonoelastography and the detectability of lesions. Ultrasound Med. Biol. 24, 1437–1447. (doi:10.1016/S0301-5629(98)00123-9) [DOI] [PubMed] [Google Scholar]
- 20.Bercoff J, Tanter M, Fink M. 2004. Supersonic shear imaging: a new technique for soft tissue elasticity mapping. IEEE Trans. Ultrason. Ferroelectr. Freq. Control 51, 396–409. (doi:10.1109/TUFFC.2004.1295425) [DOI] [PubMed] [Google Scholar]
- 21.Nightingale K, Soo MS, Nightingale R, Trahey G. 2002. Acoustic radiation force impulse imaging: in vivo demonstration of clinical feasibility. Ultrasound Med. Biol. 28, 227–235. (doi:10.1016/S0301-5629(01)00499-9) [DOI] [PubMed] [Google Scholar]
- 22.Muthupillai R, Lomas DJ, Rossman PJ, Greenleaf JF, Manduca A, Ehman RL. 1995. Magnetic resonance elastography by direct visualization of propagating acoustic strain waves. Science 269, 1854–1857. (doi:10.1126/science.7569924) [DOI] [PubMed] [Google Scholar]
- 23.Rogowska J, Patel NA, Fujimoto JG, Brezinski ME. 2004. Optical coherence tomographic elastography technique for measuring deformation and strain of atherosclerotic tissues. Heart 90, 556–562. (doi:10.1136/hrt.2003.016956) [DOI] [PMC free article] [PubMed] [Google Scholar]
- 24.Tanter M, Bercoff J, Sandrin L, Fink M. 2002. Ultrafast compound imaging for 2-D motion vector estimation: application to transient elastography. IEEE Trans. Ultrason. Ferroelectr. Freq. Control 49, 1363–1374. (doi:10.1109/TUFFC.2002.1041078) [DOI] [PubMed] [Google Scholar]
- 25.Konofagou E, Ophir J. 1998. A new elastographic method for estimation and imaging of lateral displacements, lateral strains, corrected axial strains and Poisson's ratios in tissues. Ultrasound Med. Biol. 24, 1183–1199. (doi:10.1016/S0301-5629(98)00109-4) [DOI] [PubMed] [Google Scholar]
- 26.Gennisson J-L, Rénier M, Catheline S, Barrière C, Bercoff J, Tanter M, Fink M. 2007. Acoustoelasticity in soft solids: assessment of the nonlinear shear modulus with the acoustic radiation force. J. Acoust. Soc. Am. 122, 3211–3219. (doi:10.1121/1.2793605) [DOI] [PubMed] [Google Scholar]
- 27.Jiang Y, Li G, Qian L-X, Liang S, Destrade M, Cao Y. 2015. Measuring the linear and nonlinear elastic properties of brain tissue with shear waves and inverse analysis. Biomech. Biomech. Model. 14, 1119–1128. (doi:10.1007/s10237-015-0658-0) [DOI] [PubMed] [Google Scholar]
- 28.Bernal M, Chammings F, Couade M, Bercoff J, Tanter M, Gennisson J. 2016. In vivo quantification of the nonlinear shear modulus in breast lesions: feasibility study. IEEE Trans. Ultrason. Ferroelectr. Freq. Control 63, 101–109. (doi:10.1109/TUFFC.2015.2503601) [DOI] [PubMed] [Google Scholar]
- 29.Deffieux T, Montaldo G, Tanter M, Fink M. 2009. Shear wave spectroscopy for in vivo quantification of human soft tissues visco-elasticity. IEEE Trans. Med. Imaging 28, 313–322. (doi:10.1109/tmi.2008.925077) [DOI] [PubMed] [Google Scholar]
- 30.Rouze NC, Palmeri ML, Nightingale KR. 2015. An analytic, Fourier domain description of shear wave propagation in a viscoelastic medium using asymmetric Gaussian sources. J. Acous. Soc. Amer. 138, 1012–1022. (doi:10.1121/1.4927492) [DOI] [PMC free article] [PubMed] [Google Scholar]
- 31.Nenadic I, Urban MW, Qiang B, Chen S, Greenleaf J. 2013. Model-free quantification of shear wave velocity and attenuation in tissues and its in vivo application. J. Acous. Soc. Am. 134, 4011 (doi:10.1121/1.4830632) [Google Scholar]
- 32.Nightingale KR, Rouze NC, Rosenzweig SJ, Wang MH, Abdelmalek MF, Guy CD, Palmeri ML. 2015. Derivation and analysis of viscoelastic properties in human liver: impact of frequency on fibrosis and steatosis staging. IEEE Trans. Ultrason. Ferroelectr. Freq. Control 62, 165–175. (doi:10.1109/tuffc.2014.006653) [DOI] [PMC free article] [PubMed] [Google Scholar]
- 33.Li G-Y, He Q, Qian L-X, Geng H, Liu Y, Yang X-Y, Luo J, Cao Y. 2016. Elastic Cherenkov effects in transversely isotropic soft materials-II: ex vivo and in vivo experiments. J. Mech. Phys. Solids 94, 181–190. (doi:10.1016/j.jmps.2016.04.028) [Google Scholar]
- 34.Li G-Y, Zheng Y, Liu Y, Destrade M, Cao Y. 2016. Elastic Cherenkov effects in transversely isotropic soft materials-I: theoretical analysis, simulations and inverse method. J. Mech. Phys. Solids 96, 388–410. (doi:10.1016/j.jmps.2016.05.023) [Google Scholar]
- 35.Rouze NC, Wang MH, Palmeri ML, Nightingale KR. 2013. Finite element modeling of impulsive excitation and shear wave propagation in an incompressible, transversely isotropic medium. J. Biomech. 46, 2761–2768. (doi:10.1016/j.jbiomech.2013.09.008) [DOI] [PMC free article] [PubMed] [Google Scholar]
- 36.Gennisson J-L, Deffieux T, Macé E, Montaldo G, Fink M, Tanter M. 2010. Viscoelastic and anisotropic mechanical properties of in vivo muscle tissue assessed by Supersonic Shear Imaging. Ultrasound Med. Biol. 36, 789–801. (doi:10.1016/j.ultrasmedbio.2010.02.013) [DOI] [PubMed] [Google Scholar]
- 37.Cosgrove D, et al. 2013. EFSUMB guidelines and recommendations on the clinical use of ultrasound elastography. Part 2: clinical applications. Ultraschall Med. 34, 238–253. (doi:10.1055/s-0033-1335375) [DOI] [PubMed] [Google Scholar]
- 38.Bamber J, et al. 2013. EFSUMB guidelines and recommendations on the clinical use of ultrasound elastography. Part 1: basic principles and technology. Ultraschall Med. 34, 169–184. (doi:10.1055/s-0033-1335205) [DOI] [PubMed] [Google Scholar]
- 39.Shiina T, et al. 2015. WFUMB guidelines and recommendations for clinical use of ultrasound elastography: part 1: basic principles and terminology. Ultrasound Med. Biol. 41, 1126–1147. (doi:10.1016/j.ultrasmedbio.2015.03.009) [DOI] [PubMed] [Google Scholar]
- 40.Kallel F, Ophir J, Magee K, Krouskop T. 1998. Elastographic imaging of low-contrast elastic modulus distributions in tissue. Ultrasound Med. Biol. 24, 409–425. (doi:10.1016/S0301-5629(97)00287-1) [DOI] [PubMed] [Google Scholar]
- 41.Ponnekanti H, Ophir J, Huang Y, Céspedes I. 1995. Fundamental mechanical limitations on the visualization of elasticity contrast in elastography. Ultrasound Med. Biol. 21, 533–543. (doi:10.1016/0301-5629(94)00136-2) [DOI] [PubMed] [Google Scholar]
- 42.Thitaikumar A, Ophir J. 2007. Effect of lesion boundary conditions on axial strain elastograms: a parametric study. Ultrasound Med. Biol. 33, 1463–1467. (doi:10.1016/j.ultrasmedbio.2007.03.011) [DOI] [PMC free article] [PubMed] [Google Scholar]
- 43.Doyley MM, Meaney PM, Bamber JC. 2000. Evaluation of an iterative reconstruction method for quantitative elastography. Phys. Med. Biol. 45, 1521 (doi:10.1088/0031-9155/45/6/309) [DOI] [PubMed] [Google Scholar]
- 44.Skovoroda AR, Lubinski LA, Emelianov SY, Donnell MO. 1999. Reconstructive elasticity imaging for large deformations. IEEE Trans. Ultrason. Ferroelectr. Freq. Control 46, 523–535. (doi:10.1109/58.764839) [DOI] [PubMed] [Google Scholar]
- 45.Hiltawsky KM, Krüger M, Starke C, Heuser L, Ermert H, Jensen A. 2001. Freehand ultrasound elastography of breast lesions: clinical results. Ultrasound Med. Biol. 27, 1461–1469. (doi:10.1016/S0301-5629(01)00434-3) [DOI] [PubMed] [Google Scholar]
- 46.Stafford RJ, Kallel F, Price RE, Cromeens DM, Krouskop TA, Hazle JD, Ophir J. 1998. Elastographic imaging of thermal lesions in soft tissue: a preliminary study in vitro. Ultrasound Med. Biol. 24, 1449–1458. (doi:10.1016/S0301-5629(98)00099-4) [DOI] [PubMed] [Google Scholar]
- 47.Chino K, Akagi R, Dohi M, Fukashiro S, Takahashi H. 2012. Reliability and validity of quantifying absolute muscle hardness using ultrasound elastography. PLoS One 7, e45764 (doi:10.1371/journal.pone.0045764) [DOI] [PMC free article] [PubMed] [Google Scholar]
- 48.Kallel F, Bertrand M, Ophir J. 1996. Fundamental limitations on the contrast-transfer efficiency in elastography: an analytic study. Ultrasound Med. Biol. 22, 463–470. (doi:10.1016/0301-5629(95)02079-9) [DOI] [PubMed] [Google Scholar]
- 49.Garra BS, Cespedes EI, Ophir J, Spratt SR, Zuurbier RA, Magnant CM, Pennanen MF. 1997. Elastography of breast lesions: initial clinical results. Radiology 202, 79–86. (doi:10.1148/radiology.202.1.8988195) [DOI] [PubMed] [Google Scholar]
- 50.Kallel F, Stafford RJ, Price RE, Righetti R, Ophir J, Hazle JD. 1999. The feasibility of elastographic visualization of HIFU-induced thermal lesions in soft tissues. Ultrasound Med. Biol. 25, 641–647. (doi:10.1016/S0301-5629(98)00184-7) [DOI] [PubMed] [Google Scholar]
- 51.Lyshchik A, et al. 2005. Thyroid gland tumor diagnosis at US elastography. Radiology 237, 202–211. (doi:10.1148/radiol.2363041248) [DOI] [PubMed] [Google Scholar]
- 52.Palmeri ML, Nightingale KR. 2011. Acoustic radiation force-based elasticity imaging methods. Interface Focus 1, 553–564. (doi:10.1098/rsfs.2011.0023) [DOI] [PMC free article] [PubMed] [Google Scholar]
- 53.Torr GR. 1984. The acoustic radiation force. Am. J. Phys. 52, 402–408. (doi:10.1119/1.13625) [Google Scholar]
- 54.Sanada M, et al. 2000. Clinical evaluation of sonoelasticity measurement in liver using ultrasonic imaging of internal forced low-frequency vibration. Ultrasound Med. Biol. 26, 1455–1460. (doi:10.1016/S0301-5629(00)00307-0) [DOI] [PubMed] [Google Scholar]
- 55.Gao L, Parker KJ, Alam SK, Lerner RM. 1995. Sonoelasticity imaging: theory and experimental verification. J. Acoust. Soc. Am. 97, 3875–3886. (doi:10.1121/1.412399) [DOI] [PubMed] [Google Scholar]
- 56.Lerner RM, Huang SR, Parker KJ. 1990. ‘Sonoelasticity’ images derived from ultrasound signals in mechanically vibrated tissues. Ultrasound Med. Biol. 16, 231–239. (doi:10.1016/0301-5629(90)90002-T) [DOI] [PubMed] [Google Scholar]
- 57.Wu Z, Taylor LS, Rubens DJ, Parker KJ. 2004. Sonoelastographic imaging of interference patterns for estimation of the shear velocity of homogeneous biomaterials. Phys. Med. Biol. 49, 911 (doi:10.1088/0031-9155/49/6/003) [DOI] [PubMed] [Google Scholar]
- 58.Levinson SF, Shinagawa M, Sato T. 1995. Sonoelastic determination of human skeletal muscle elasticity. J. Biomech. 28, 1145–1154. (doi:10.1016/0021-9290(94)00173-2) [DOI] [PubMed] [Google Scholar]
- 59.Hadj Henni A, Schmitt C, Trop I, Cloutier G. 2012. Shear wave induced resonance elastography of spherical masses with polarized torsional waves. Appl. Phys. Lett. 100, 133702 (doi:10.1063/1.3696300) [DOI] [PMC free article] [PubMed] [Google Scholar]
- 60.Hadj Henni A, Schmitt C, Cloutier G. 2010. Shear wave induced resonance elastography of soft heterogeneous media. J. Biomech. 43, 1488–1493. (doi:10.1016/j.jbiomech.2010.01.045) [DOI] [PubMed] [Google Scholar]
- 61.Schmitt C, Montagnon E, Henni AH, Qi S, Cloutier G. 2013. Shear wave induced resonance elastography of venous thrombi: a proof-of-concept. IEEE Trans. Med. Imaging 32, 565–577. (doi:10.1109/tmi.2012.2231093) [DOI] [PubMed] [Google Scholar]
- 62.Fatemi M, Greenleaf JF. 1998. Ultrasound-stimulated vibro-acoustic spectrography. Science 280, 82–85. (doi:10.1126/science.280.5360.82) [DOI] [PubMed] [Google Scholar]
- 63.Fatemi M, Greenleaf JF. 1999. Vibro-acoustography: an imaging modality based on ultrasound-stimulated acoustic emission. Proc. Natl Acad. Sci. USA 96, 6603–6608. (doi:10.1073/pnas.96.12.6603) [DOI] [PMC free article] [PubMed] [Google Scholar]
- 64.Urban MW, Alizad A, Aquino W, Greenleaf JF, Fatemi M. 2011. A review of vibro-acoustography and its applications in medicine. Curr. Med. Imaging Rev. 7, 350–359. (doi:10.2174/157340511798038648) [DOI] [PMC free article] [PubMed] [Google Scholar]
- 65.Mitri FG, Trompette P, Chapelon JY. 2004. Improving the use of vibro-acoustography for brachytherapy metal seed imaging: a feasibility study. IEEE Trans. Med. Imaging 23, 1–6. (doi:10.1109/tmi.2003.819934) [DOI] [PubMed] [Google Scholar]
- 66.Brigham JC, Aquino W, Mitri FG, Greenleaf JF, Fatemi M. 2007. Inverse estimation of viscoelastic material properties for solids immersed in fluids using vibroacoustic techniques. J. Appl. Phys. 101, 023509 (doi:10.1063/1.2423227) [Google Scholar]
- 67.Mitri FG, Davis BJ, Urban MW, Alizad A, Greenleaf JF, Lischer GH, Wilson TM, Fatemi M. 2009. Vibro-acoustography imaging of permanent prostate brachytherapy seeds in an excised human prostate – preliminary results and technical feasibility. Ultrasonics 49, 389–394. (doi:10.1016/j.ultras.2008.10.011) [DOI] [PMC free article] [PubMed] [Google Scholar]
- 68.Konofagou E, Thierman J, Hynynen K. 2001. A focused ultrasound method for simultaneous diagnostic and therapeutic applications—a simulation study. Phys. Med. Biol. 46, 2967 (doi:10.1088/0031-9155/46/11/314) [DOI] [PubMed] [Google Scholar]
- 69.Konofagou EE, Hynynen K. 2003. Localized harmonic motion imaging: theory, simulations and experiments. Ultrasound Med. Biol. 29, 1405–1413. (doi:10.1016/S0301-5629(03)00953-0) [DOI] [PubMed] [Google Scholar]
- 70.Konofagou EE, Maleke C, Vappou J. 2012. Harmonic motion imaging (HMI) for tumor imaging and treatment monitoring. Curr. Med. Imaging Rev. 8, 16–26. (doi:10.2174/157340512799220616) [DOI] [PMC free article] [PubMed] [Google Scholar]
- 71.Maleke C, Konofagou EE. 2008. Harmonic motion imaging for focused ultrasound (HMIFU): a fully integrated technique for sonication and monitoring of thermal ablation in tissues. Phys. Med. Biol. 53, 1773 (doi:10.1088/0031-9155/53/6/018) [DOI] [PubMed] [Google Scholar]
- 72.Vappou J, Maleke C, Konofagou EE. 2009. Quantitative viscoelastic parameters measured by harmonic motion imaging. Phys. Med. Biol. 54, 3579 (doi:10.1088/0031-9155/54/11/020) [DOI] [PubMed] [Google Scholar]
- 73.Maleke C, Konofagou EE. 2010. In vivo feasibility of real-time monitoring of focused ultrasound surgery (FUS) using harmonic motion imaging (HMI). IEEE Trans. Biomed. Eng. 57, 7–11. (doi:10.1109/tbme.2009.2027423) [DOI] [PubMed] [Google Scholar]
- 74.Chen S, Fatemi M, Greenleaf JF. 2004. Quantifying elasticity and viscosity from measurement of shear wave speed dispersion. J. Acoust. Soc. Am. 115, 2781–2785. (doi:10.1121/1.1739480) [DOI] [PubMed] [Google Scholar]
- 75.Chen S, Urban MW, Pislaru C, Kinnick R, Zheng Y, Yao A, Greenleaf JF. 2009. Shearwave dispersion ultrasound vibrometry (SDUV) for measuring tissue elasticity and viscosity. IEEE Trans. Ultrason. Ferroelectr. Freq. Control 56, 55–62. (doi:10.1109/TUFFC.2009.1005) [DOI] [PMC free article] [PubMed] [Google Scholar]
- 76.Urban MW, Chen S, Greenleaf JF. 2009. Error in estimates of tissue material properties from shear wave dispersion ultrasound vibrometry. IEEE Trans. Ultrason. Ferroelectr. Freq. Control 56, 748–758. (doi:10.1109/tuffc.2009.1097) [DOI] [PMC free article] [PubMed] [Google Scholar]
- 77.Zheng Y, Chen S, Tan W, Kinnick R, Greenleaf JF. 2007. Detection of tissue harmonic motion induced by ultrasonic radiation force using pulse-echo ultrasound and Kalman filter. IEEE Trans. Ultrason. Ferroelectr. Freq. Control 54, 290–300. (doi:10.1109/TUFFC.2007.243) [DOI] [PubMed] [Google Scholar]
- 78.Nenadic IZ, Urban MW, Mitchell SA, Greenleaf JF. 2011. Lamb wave dispersion ultrasound vibrometry (LDUV) method for quantifying mechanical properties of viscoelastic solids. Phys. Med. Biol. 56, 2245 (doi:10.1088/0031-9155/56/7/021) [DOI] [PMC free article] [PubMed] [Google Scholar]
- 79.Amador C, Urban MW, Chen S, Chen Q, An KN, Greenleaf JF. 2011. Shear elastic modulus estimation from indentation and SDUV on gelatin phantoms. IEEE Trans. Biomed. Eng. 58, 1706–1714. (doi:10.1109/tbme.2011.2111419) [DOI] [PMC free article] [PubMed] [Google Scholar]
- 80.Parker KJ, Huang SR, Musulin RA, Lerner RM. 1990. Tissue response to mechanical vibrations for ‘sonoelasticity imaging’. Ultrasound Med. Biol. 16, 241–246. (doi:10.1016/0301-5629(90)90003-U) [DOI] [PubMed] [Google Scholar]
- 81.Wu Z, Hoyt K, Rubens DJ, Parker KJ. 2006. Sonoelastographic imaging of interference patterns for estimation of shear velocity distribution in biomaterials. J. Acoust. Soc. Am. 120, 535–545. (doi:10.1121/1.2203594) [DOI] [PubMed] [Google Scholar]
- 82.Huang SR, Lerner RM, Parker KJ. 1990. On estimating the amplitude of harmonic vibration from the Doppler spectrum of reflected signals. J. Acoust. Soc. Am. 88, 2702–2712. (doi:10.1121/1.399673) [Google Scholar]
- 83.Huang SR, Lerner RM, Parker KJ. 1992. Time domain Doppler estimators of the amplitude of vibrating targets. J. Acoust. Soc. Am. 91, 965–974. (doi:10.1121/1.402502) [Google Scholar]
- 84.Hoyt K, Parker KJ, Rubens DJ. 2007. Real-time shear velocity imaging using sonoelastographic techniques. Ultrasound Med. Biol. 33, 1086–1097. (doi:10.1016/j.ultrasmedbio.2007.01.009) [DOI] [PubMed] [Google Scholar]
- 85.Zhang M, Castaneda B, Wu Z, Nigwekar P, Joseph JV, Rubens DJ, Parker KJ. 2007. Congruence of imaging estimators and mechanical measurements of viscoelastic properties of soft tissues. Ultrasound Med. Biol. 33, 1617–1631. (doi:10.1016/j.ultrasmedbio.2007.04.012) [DOI] [PMC free article] [PubMed] [Google Scholar]
- 86.Hoyt K, Castaneda B, Parker KJ. 2008. Two-dimensional sonoelastographic shear velocity imaging. Ultrasound Med. Biol. 34, 276–288. (doi:10.1016/j.ultrasmedbio.2007.07.011) [DOI] [PubMed] [Google Scholar]
- 87.Hoyt K, Castaneda B, Zhang M, Nigwekar P, di Sant'agnese PA, Joseph JV, Strang J, Rubens DJ, Parker KJ. 2008. Tissue elasticity properties as biomarkers for prostate cancer. Cancer Biomark 4, 213–225. (doi:10.3233/CBM-2008-44-505) [DOI] [PMC free article] [PubMed] [Google Scholar]
- 88.Hoyt K, Kneezel T, Castaneda B, Parker KJ. 2008. Quantitative sonoelastography for the in vivo assessment of skeletal muscle viscoelasticity. Phys. Med. Biol. 53, 4063 (doi:10.1088/0031-9155/53/15/004) [DOI] [PMC free article] [PubMed] [Google Scholar]
- 89.Alizad A, Whaley DH, Greenleaf JF, Fatemi M. 2006. Critical issues in breast imaging by vibro-acoustography. Ultrasonics 44(Supplement), e217–e220. (doi:10.1016/j.ultras.2006.06.021) [DOI] [PubMed] [Google Scholar]
- 90.Alizad A, Whaley DH, Greenleaf JF, Fatemi M. 2005. Potential applications of vibro-acoustography in breast imaging. Technol. Cancer Res. Treat. 4, 151–158. (doi:10.1177/153303460500400204) [DOI] [PubMed] [Google Scholar]
- 91.Hou GY, Provost J, Grondin J, Wang S, Marquet F, Bunting E, Konofagou EE. 2014. Sparse matrix beamforming and image reconstruction for real-time 2D HIFU monitoring using Harmonic Motion Imaging for Focused Ultrasound (HMIFU) with in vitro validation. IEEE Trans. Med. Imaging 33, 2107–2117. (doi:10.1109/TMI.2014.2332184) [DOI] [PMC free article] [PubMed] [Google Scholar]
- 92.Lakes RS. 2009. Viscoelastic materials. New York, NY: Cambridge University Press. [Google Scholar]
- 93.Mitri FG, Urban MW, Fatemi M, Greenleaf JF. 2011. Shear wave dispersion ultrasonic vibrometry for measuring prostate shear stiffness and viscosity: an in vitro pilot study. IEEE Trans. Biomed. Eng. 58, 235–242. (doi:10.1109/tbme.2010.2053928) [DOI] [PMC free article] [PubMed] [Google Scholar]
- 94.Nightingale K, McAleavey S, Trahey G. 2003. Shear-wave generation using acoustic radiation force: in vivo and ex vivo results. Ultrasound Med. Biol. 29, 1715–1723. (doi:10.1016/j.ultrasmedbio.2003.08.008) [DOI] [PubMed] [Google Scholar]
- 95.Tanter M, Bercoff J, Athanasiou A, Deffieux T, Gennisson J-L, Montaldo G, Muller M, Tardivon A, Fink M. 2008. Quantitative assessment of breast lesion viscoelasticity: initial clinical results using supersonic shear imaging. Ultrasound Med. Biol. 34, 1373–1386. (doi:10.1016/j.ultrasmedbio.2008.02.002) [DOI] [PubMed] [Google Scholar]
- 96.Song P, Zhao H, Manduca A, Urban MW, Greenleaf JF, Chen S. 2012. Comb-push ultrasound shear elastography (CUSE): a novel method for two-dimensional shear elasticity imaging of soft tissues. IEEE Trans. Med. Imaging 31, 1821–1832. (doi:10.1109/tmi.2012.2205586) [DOI] [PMC free article] [PubMed] [Google Scholar]
- 97.Zhao H, Song P, Urban MW, Greenleaf JF, Chen S. 2012. Shear wave speed measurement using an unfocused ultrasound beam. Ultrasound Med. Biol. 38, 1646–1655. (doi:10.1016/j.ultrasmedbio.2012.05.015) [DOI] [PMC free article] [PubMed] [Google Scholar]
- 98.Palmeri ML, Wang MH, Dahl JJ, Frinkley KD, Nightingale KR. 2008. Quantifying hepatic shear modulus in vivo using acoustic radiation force. Ultrasound. Med. Biol. 34, 546–558. (doi:10.1016/j.ultrasmedbio.2007.10.009) [DOI] [PMC free article] [PubMed] [Google Scholar]
- 99.Nightingale K. 2011. Acoustic radiation force impulse (ARFI) imaging: a review. Curr. Med. Imaging Rev. 7, 328–339. (doi:10.2174/157340511798038657) [DOI] [PMC free article] [PubMed] [Google Scholar]
- 100.Urban MW, Nenadic IZ, Qiang B, Bernal M, Chen S, Greenleaf JF. 2015. Characterization of material properties of soft solid thin layers with acoustic radiation force and wave propagation. J. Acoust. Soc. Am. 138, 2499–2507. (doi:10.1121/1.4932170) [DOI] [PMC free article] [PubMed] [Google Scholar]
- 101.Sandrin L, Tanter M, Gennisson JL, Catheline S, Fink M. 2002. Shear elasticity probe for soft tissues with 1-D transient elastography. IEEE Trans. Ultrason. Ferroelectr. Freq. Control 49, 436–446. (doi:10.1109/58.996561) [DOI] [PubMed] [Google Scholar]
- 102.Sandrin L, Tanter M, Catheline S, Fink M. 2002. Shear modulus imaging with 2-D transient elastography. IEEE Trans. Ultrason. Ferroelectr. Freq. Control 49, 426–435. (doi:10.1109/58.996560) [DOI] [PubMed] [Google Scholar]
- 103.Foucher J, Chanteloup E, Vergniol J, Castéra L, Le Bail B, Adhoute X, Bertet J, Couzigou P, de Lédinghen V. 2006. Diagnosis of cirrhosis by transient elastography (FibroScan): a prospective study. Gut 55, 403–408. (doi:10.1136/gut.2005.069153) [DOI] [PMC free article] [PubMed] [Google Scholar]
- 104.Nakamura Y, et al. 2016. Liver fibrosis assessment by FibroScan compared with pathological findings of liver resection specimen in Hepatitis C infection. Hepatol. Res. (doi:10.1111/hepr.12815) [DOI] [PubMed] [Google Scholar]
- 105.Palmeri ML, McAleavey SA, Fong KL, Trahey GE, Nightingale KR. 2006. Dynamic mechanical response of elastic spherical inclusions to impulsive acoustic radiation force excitation. IEEE Trans. Ultrason. Ferroelectr. Freq. Control 53, 2065–2079. (doi:10.1109/TUFFC.2006.146) [DOI] [PMC free article] [PubMed] [Google Scholar]
- 106.Wang M, Byram B, Palmeri M, Rouze N, Nightingale K. 2013. Imaging transverse isotropic properties of muscle by monitoring acoustic radiation force induced shear waves using a 2-D matrix ultrasound array. IEEE Trans. Med. Imaging 32, 1671–1684. (doi:10.1109/TMI.2013.2262948) [DOI] [PMC free article] [PubMed] [Google Scholar]
- 107.Bercoff J, Tanter M, Fink M. 2004. Sonic boom in soft materials: the elastic Cerenkov effect. Appl. Phys. Lett. 84, 2202–2204. (doi:10.1063/1.1667613) [Google Scholar]
- 108.McLaughlin J, Renzi D. 2006. Shear wave speed recovery in transient elastography and supersonic imaging using propagating fronts. Inverse Probl. 22, 681 (doi:10.1088/0266-5611/22/2/018) [Google Scholar]
- 109.Athanasiou A, Tardivon A, Tanter M, Sigal-Zafrani B, Bercoff J, Deffieux T, Gennisson J-L, Fink M, Neuenschwander S. 2010. Breast lesions: quantitative elastography with Supersonic Shear Imaging—preliminary results. Radiology 256, 297–303. (doi:10.1148/radiol.10090385) [DOI] [PubMed] [Google Scholar]
- 110.Sebag F, Vaillant-Lombard J, Berbis J, Griset V, Henry JF, Petit P, Oliver C. 2010. Shear wave elastography: a new ultrasound imaging mode for the differential diagnosis of benign and malignant thyroid nodules. J. Clin. Endocrinol. Metab. 95, 5281–5288. (doi:10.1210/jc.2010-0766) [DOI] [PubMed] [Google Scholar]
- 111.Bavu É, et al. 2011. Noninvasive in vivo liver fibrosis evaluation using Supersonic Shear Imaging: a clinical study on 113 Hepatitis C virus patients. Ultrasound Med. Biol. 37, 1361–1373. (doi:10.1016/j.ultrasmedbio.2011.05.016) [DOI] [PubMed] [Google Scholar]
- 112.Song P, Urban MW, Manduca A, Zhao H, Greenleaf JF, Chen S. 2013. Comb-push ultrasound shear elastography (CUSE) with various ultrasound push beams. IEEE Trans. Med. Imaging 32, 1435–1447. (doi:10.1109/tmi.2013.2257831) [DOI] [PMC free article] [PubMed] [Google Scholar]
- 113.Song P, et al. 2015. Two-dimensional shear-wave elastography on conventional ultrasound scanners with time-aligned sequential tracking (TAST) and comb-push ultrasound shear elastography (CUSE). IEEE Trans. Ultrason. Ferroelectr. Freq. Control 62, 290–302. (doi:10.1109/tuffc.2014.006628) [DOI] [PMC free article] [PubMed] [Google Scholar]
- 114.Nabavizadeh A, Song P, Chen S, Greenleaf JF, Urban MW. 2015. Multi-source and multi-directional shear wave generation with intersecting steered ultrasound push beams. IEEE Trans. Ultrason. Ferroelectr. Freq. Control 62, 647–662. (doi:10.1109/tuffc.2014.006805) [DOI] [PMC free article] [PubMed] [Google Scholar]
- 115.Denis M, et al. 2015. Comb-push ultrasound shear elastography of breast masses: initial results show promise. PLoS ONE 10, e0119398 (doi:10.1371/journal.pone.0119398) [DOI] [PMC free article] [PubMed] [Google Scholar]
- 116.Mehrmohammadi M, Song P, Meixner DD, Fazzio RT, Chen S, Greenleaf JF, Fatemi M, Alizad A. 2015. Comb-push ultrasound shear elastography (CUSE) for evaluation of thyroid nodules: preliminary in vivo results. IEEE Trans. Med. Imaging 34, 97–106. (doi:10.1109/tmi.2014.2346498) [DOI] [PMC free article] [PubMed] [Google Scholar]
- 117.Couade M, Pernot M, Prada C, Messas E, Emmerich J, Bruneval P, Criton A, Fink M, Tanter M. 2010. Quantitative assessment of arterial wall biomechanical properties using shear wave imaging. Ultrasound. Med. Biol. 36, 1662–1676. (doi:10.1016/j.ultrasmedbio.2010.07.004) [DOI] [PubMed] [Google Scholar]
- 118.Bernal M, Nenadic I, Urban MW, Greenleaf JF. 2011. Material property estimation for tubes and arteries using ultrasound radiation force and analysis of propagating modes. J. Acoust. Soc. Am. 129, 1344–1354. (doi:10.1121/1.3533735) [DOI] [PMC free article] [PubMed] [Google Scholar]
- 119.Li G-Y, He Q, Jia L, He P, Luo J, Cao Y. 2017. An inverse method to determine arterial stiffness with guided axial waves. Ultrasound Med. Biol. 43, 505–516. (doi:10.1016/j.ultrasmedbio.2016.10.006) [DOI] [PubMed] [Google Scholar]
- 120.Brum J, Bernal M, Gennisson JL, Tanter M. 2014. In vivo evaluation of the elastic anisotropy of the human Achilles tendon using shear wave dispersion analysis. Phys. Med. Biol. 59, 505–523. (doi:10.1088/0031-9155/59/3/505) [DOI] [PubMed] [Google Scholar]
- 121.Kanai H. 2005. Propagation of spontaneously actuated pulsive vibration in human heart wall and in vivo viscoelasticity estimation. IEEE Trans. Ultrason. Ferroelectr. Freq. Control 52, 1931–1942. (doi:10.1109/TUFFC.2005.1561662) [DOI] [PubMed] [Google Scholar]
- 122.Li G-Y, He Q, Xu G, Jia L, Luo J, Cao Y. 2017. An ultrasound elastography method to determine the local stiffness of arteries with guided circumferential waves. J. Biomech. 51, 97–104. (doi:10.1016/j.jbiomech.2016.12.006) [DOI] [PubMed] [Google Scholar]
- 123.Achenbach JD. 1973. Wave propagation in elastic solids. Amsterdam, The Netherlands: North-Holland Publishing Company. [Google Scholar]
- 124.Rose JL. 2014. Ultrasonic guided waves in solid media. Cambridge, UK: Cambridge University Press. [Google Scholar]
- 125.Alleyne D, Cawley P. 1991. A two-dimensional Fourier transform method for the measurement of propagating multimode signals. J. Acoust. Soc. Am. 89, 1159–1168. (doi:10.1121/1.400530) [Google Scholar]
- 126.Nenadic I, et al. 2016. Noninvasive evaluation of bladder wall mechanical properties as a function of filling volume: potential application in bladder compliance assessment. PLoS ONE 11, e0157818 (doi:10.1371/journal.pone.0157818) [DOI] [PMC free article] [PubMed] [Google Scholar]
- 127.Pau A, Lanza di Scalea F. 2015. Nonlinear guided wave propagation in prestressed plates. J. Acoust. Soc. Am. 137, 1529–1540. (doi:10.1121/1.4908237) [DOI] [PubMed] [Google Scholar]
- 128.Nam NT, Merodio J, Ogden RW, Vinh PC. 2016. The effect of initial stress on the propagation of surface waves in a layered half-space. Int. J. Solids Struct. 88–89, 88–100. (doi:10.1016/j.ijsolstr.2016.03.019) [Google Scholar]
- 129.Hadamard J. 1914. Lectures on Cauchy's problem in linear partial differential equations. Mineola, NY: Dover Publications. [Google Scholar]
- 130.Fung Y. 1965. Foundations of solid mechanics. Englewood Cliffs, NJ: Prentice Hall. [Google Scholar]
- 131.Ogden RW. 1997. Non-linear elastic deformations. New York, NY: Dover. [Google Scholar]
- 132.Lifshitz EM, Kosevich AM, Pitaevskii LP. 1986. Chapter I - Fundamental equations. In Theory of elasticity (third edition), pp. 1–37. Oxford, UK: Butterworth-Heinemann. [Google Scholar]
- 133.Ogden RW. 2007. Incremental statics and dynamics of pre-stressed elastic materials. In Waves in nonlinear pre-stressed materials (eds Destrade M, Saccomandi G), pp. 1–26. Vienna, Austria: Springer. [Google Scholar]
- 134.Destrade M. 2015. Incremental equations for soft fibrous materials. In Nonlinear mechanics of soft fibrous materials (eds Dorfmann L, Ogden RW), pp. 233–267. Vienna, Austria: Springer. [Google Scholar]
- 135.Kuo P-L, Li P-C, Li M-L. 2001. Elastic properties of tendon measured by two different approaches. Ultrasound Med. Biol. 27, 1275–1284. (doi:10.1016/S0301-5629(01)00442-2) [DOI] [PubMed] [Google Scholar]
- 136.Papazoglou S, Rump J, Braun J, Sack I. 2006. Shear wave group velocity inversion in MR elastography of human skeletal muscle. Magn. Reson. Med. 56, 489–497. (doi:10.1002/mrm.20993) [DOI] [PubMed] [Google Scholar]
- 137.Destrade M, Martin PA, Ting TCT. 2002. The incompressible limit in linear anisotropic elasticity, with applications to surface waves and elastostatics. J. Mech. Phys. Solids 50, 1453–1468. (doi:10.1016/S0022-5096(01)00121-1) [Google Scholar]
- 138.Holzapfel G, Gasser T, Ogden R. 2000. A new constitutive framework for arterial wall mechanics and a comparative study of material models. J. Elast. 61, 1–48. (doi:10.1023/A:1010835316564) [Google Scholar]
- 139.Destrade M, Ogden RW. 2010. On the third- and fourth-order constants of incompressible isotropic elasticity. J. Acoust. Soc. Am. 128, 3334–3343. (doi:10.1121/1.3505102) [DOI] [PubMed] [Google Scholar]
- 140.Demiray H. 1972. A note on the elasticity of soft biological tissues. J. Biomech. 5, 309–311. (doi:10.1016/0021-9290(72)90047-4) [DOI] [PubMed] [Google Scholar]
- 141.Fung YC, Fronek K, Patitucci P. 1979. Pseudoelasticity of arteries and the choice of its mathematical expression. Am. J. Physiol. 6, H620–H631. [DOI] [PubMed] [Google Scholar]
- 142.Gasser TC, Ogden RW, Holzapfel GA. 2006. Hyperelastic modelling of arterial layers with distributed collagen fibre orientations. J. R. Soc. Interface. 3, 15–35. (doi:10.1098/rsif.2005.0073) [DOI] [PMC free article] [PubMed] [Google Scholar]
- 143.ABAQUS. 2010. ABAQUS analysis user's manual, version 6.10. See http://www.simula.com.
- 144.Murphy JG. 2013. Transversely isotropic biological, soft tissue must be modelled using both anisotropic invariants. Eur. J. Mech. A-Solids 42, 90–96. (doi:10.1016/j.euromechsol.2013.04.003) [Google Scholar]
- 145.Humphrey JD, Yin FC. 1987. A new constitutive formulation for characterizing the mechanical behavior of soft tissues. Biophys. J. 52, 563–570. (doi:10.1016/S0006-3495(87)83245-9) [DOI] [PMC free article] [PubMed] [Google Scholar]
- 146.Raghavan KR, Yagle AE. 1994. Forward and inverse problems in elasticity imaging of soft tissues. IEEE Trans. Nuci. Sci. 41, 1639–1648. (doi:10.1109/23.322961) [Google Scholar]
- 147.Kallel F, Prihoda CD, Ophir J. 2001. Contrast-transfer efficiency for continuously varying tissue moduli: simulation and phantom validation. Ultrasound Med. Biol. 27, 1115–1125. (doi:10.1016/S0301-5629(01)00411-2) [DOI] [PubMed] [Google Scholar]
- 148.Srinivasan S, Krouskop T, Ophir J. 2004. Comparing elastographic strain images with modulus images obtained using nanoindentation: preliminary results using phantoms and tissue samples. Ultrasound Med. Biol. 30, 329–343. (doi:10.1016/j.ultrasmedbio.2003.10.021) [DOI] [PubMed] [Google Scholar]
- 149.Burnside ES, Hall TJ, Sommer AM, Hesley GK, Sisney GA, Svensson WE, Fine JP, Jiang J, Hangiandreou NJ. 2007. Differentiating benign from malignant solid breast masses with US strain imaging. Radiology 245, 401–410. (doi:10.1148/radiol.2452061805) [DOI] [PubMed] [Google Scholar]
- 150.Itoh A, Ueno E, Tohno E, Kamma H, Takahashi H, Shiina T, Yamakawa M, Matsumura T. 2006. Breast disease: clinical application of US elastography for diagnosis. Radiology 239, 341–350. (doi:10.1148/radiol.2391041676) [DOI] [PubMed] [Google Scholar]
- 151.Catheline S, Wu F, Fink M. 1999. A solution to diffraction biases in sonoelasticity: the acoustic impulse technique. J. Acoust. Soc. Am. 105, 2941–2950. (doi:10.1121/1.426907) [DOI] [PubMed] [Google Scholar]
- 152.Berenger J-P. 1994. A perfectly matched layer for the absorption of electromagnetic waves. J. Comput. Phys. 114, 185–200. (doi:10.1006/jcph.1994.1159) [Google Scholar]
- 153.Oestreicher HL. 1951. Field and impedance of an oscillating sphere in a viscoelastic medium with an application to biophysics. J. Acoust. Soc. Am. 23, 707–714. (doi:10.1121/1.1906828) [Google Scholar]
- 154.Carcione JM. 2007. Wave fields in real media: wave propagation in anisotropic, anelastic, porous and electromagnetic media. Amsterdam, The Netherlands: Elsevier. [Google Scholar]
- 155.Lamb H. 1904. On the propagation of tremors over the surface of an elastic solid. Phil. Trans. R. Soc. A 203, 1–42. (doi:10.1098/rsta.1904.0013) [Google Scholar]
- 156.Pekeris CL. 1955. The seismic surface pulse. Proc. Natl Acad. Sci. USA 41, 469–480. (doi:10.1073/pnas.41.7.469) [DOI] [PMC free article] [PubMed] [Google Scholar]
- 157.Catheline S, Benech N. 2015. Longitudinal shear wave and transverse dilatational wave in solids. J. Acoust. Soc. Am. 137, pEL200–EL205. (doi:10.1121/1.4907742) [DOI] [PubMed] [Google Scholar]
- 158.Aki K, Richards PG. 2002. Quantitative seismology. Sausalito, CA: University Science Books. [Google Scholar]
- 159.Bercoff J, Tanter M, Muller M, Fink M. 2004. The role of viscosity in the impulse diffraction field of elastic waves induced by the acoustic radiation force. IEEE Trans. Ultrason. Ferroelectr. Freq. Control 51, 1523–1536. (doi:10.1109/TUFFC.2004.1367494) [DOI] [PubMed] [Google Scholar]
- 160.Eason G, Fulton J, Sneddon IN. 1956. The generation of waves in an infinite elastic solid by variable body forces. Phil. Trans. R. Soc. Lond. A 248, 575–607. (doi:10.1098/rsta.1956.0010) [Google Scholar]
- 161.Wu K-C. 2002. A non-uniformly moving line force in an anisotropic elastic solid. Proc. R. Soc. A 458, 1761–1772. (doi:10.1098/rspa.2001.0940) [Google Scholar]
- 162.Lazar M, Pellegrini Y-P. 2016. Distributional and regularized radiation fields of non-uniformly moving straight dislocations, and elastodynamic Tamm problem. J. Mech. Phys. Solids 96, 632–659. (doi:10.1016/j.jmps.2016.07.011) [Google Scholar]
- 163.Su Z, Ye L, Lu Y. 2006. Guided Lamb waves for identification of damage in composite structures: a review. J. Sound Vib. 295, 753–780. (doi:10.1016/j.jsv.2006.01.020) [Google Scholar]
- 164.Rose JL. 2002. A baseline and vision of ultrasonic guided wave inspection potential. J. Press. Vessel Technol.-Trans. 124, 273–282. (doi:10.1115/1.1491272) [Google Scholar]
- 165.Yeh C-H, Yang C-H. 2011. Characterization of mechanical and geometrical properties of a tube with axial and circumferential guided waves. Ultrasonics 51, 472–479. (doi:10.1016/j.ultras.2010.11.013) [DOI] [PubMed] [Google Scholar]
- 166.Cès M, Royer D, Prada C. 2012. Characterization of mechanical properties of a hollow cylinder with zero group velocity Lamb modes. J. Acoust. Soc. Am. 132, 180–185. (doi:10.1121/1.4726033) [DOI] [PubMed] [Google Scholar]
- 167.Cecelja M, Chowienczyk P. 2012. Role of arterial stiffness in cardiovascular disease. JRSM Cardiovasc. Dis. 1, 1–10. (doi:10.1258/cvd.2012.012016) [DOI] [PMC free article] [PubMed] [Google Scholar]
- 168.Mattace-Raso FU, et al. 2006. Arterial stiffness and risk of coronary heart disease and stroke: the Rotterdam Study. Circulation 113, 657–663. (doi:10.1161/circulationaha.105.555235) [DOI] [PubMed] [Google Scholar]
- 169.Osborne MFM, Hart SD. 1945. Transmission, reflection, and guiding of an exponential pulse by a steel plate in water. I. Theory. J. Acoust. Soc. Am. 17, 1–18. (doi:10.1121/1.1916293) [Google Scholar]
- 170.Maksuti E, Widman E, Larsson D, Urban MW, Larsson M, Bjällmark A. 2016. Arterial stiffness estimation by shear wave elastography: validation in phantoms with mechanical testing. Ultrasound Med. Biol. 42, 308–321. (doi:10.1016/j.ultrasmedbio.2015.08.012) [DOI] [PubMed] [Google Scholar]
- 171.Li J, Rose JL. 2006. Natural beam focusing of non-axisymmetric guided waves in large-diameter pipes. Ultrasonics 44, 35–45. (doi:10.1016/j.ultras.2005.07.002) [DOI] [PubMed] [Google Scholar]
- 172.Thomsen L. 1986. Weak elastic anisotropy. Geophysics 51, 1954–1966. (doi:10.1190/1.1442051) [Google Scholar]
- 173.Dellinger J, Vernik L. 1994. Do traveltimes in pulse—transmission experiments yield anisotropic group or phase velocities? Geophysics 59, 1774–1779. (doi:10.1190/1.1443564) [Google Scholar]
- 174.Royer D, Gennisson J-L, Deffieux T, Tanter M. 2011. On the elasticity of transverse isotropic soft tissues. J. Acoust. Soc. Am. 129, 2757–2760. (doi:10.1121/1.3559681) [DOI] [PubMed] [Google Scholar]
- 175.Suga M, Matsuda T, Minato K, Oshiro O, Chihara K, Okamoto J, Takizawa O, Komori M, Takahashi T. 2003. Measurement of in vivo local shear modulus using MR elastography multiple-phase patchwork offsets. IEEE Trans. Biomed. Eng. 50, 908–915. (doi:10.1109/TBME.2003.813540) [DOI] [PubMed] [Google Scholar]
- 176.Nakamura M, Ikezoe T, Kobayashi T, Umegaki H, Takeno Y, Nishishita S, Ichihashi N. 2014. Acute effects of static stretching on muscle hardness of the medial gastrocnemius muscle belly in humans: an ultrasonic shear-wave elastography study. Ultrasound Med. Biol. 40, 1991–1997. (doi:10.1016/j.ultrasmedbio.2014.03.024) [DOI] [PubMed] [Google Scholar]
- 177.Guo J, Hirsch S, Scheel M, Braun J, Sack I. 2016. Three-parameter shear wave inversion in MR elastography of incompressible transverse isotropic media: application to in vivo lower leg muscles. Magn. Reson. Med. 75, 1537–1545. (doi:10.1002/mrm.25740) [DOI] [PubMed] [Google Scholar]
- 178.Murnaghan FD. 1937. Finite deformations of an elastic solid. Am. J. Math. 59, 235–260. (doi:10.2307/2371405) [Google Scholar]
- 179.Biot MA. 1940. The influence of initial stress on elastic waves. J. Appl. Phys. 11, 522–530. (doi:10.1063/1.1712807) [Google Scholar]
- 180.Hughes DS, Kelly JL. 1953. Second-order elastic deformation of solids. Phys. Rev. 92, 1145–1149. (doi:10.1103/PhysRev.92.1145) [Google Scholar]
- 181.Egle DM, Bray DE. 1976. Measurement of acoustoelastic and third-order elastic constants for rail steel. J. Acoust. Soc. Am. 60, 741–744. (doi:10.1121/1.381146) [Google Scholar]
- 182.Destrade M, Gilchrist MD, Saccomandi G. 2010. Third- and fourth-order constants of incompressible soft solids and the acousto-elastic effect. J. Acoust. Soc. Am. 127, 2759–2763. (doi:10.1121/1.3372624) [DOI] [PubMed] [Google Scholar]
- 183.Ogden RW, Singh B. 2011. Propagation of waves in an incompressible transversely isotropic elastic solid with initial stress: biot revisited. J. Mech. Mater. Struct. 6, 453–477. (doi:10.2140/jomms.2011.6.453) [Google Scholar]
- 184.Ogden RW, Singh B. 2014. The effect of rotation and initial stress on the propagation of waves in a transversely isotropic elastic solid. Wave Motion 51, 1108–1126. (doi:10.1016/j.wavemoti.2014.05.004) [Google Scholar]
- 185.Destrade M, Gilchrist MD, Ogden RW. 2010. Third- and fourth-order elasticities of biological soft tissues. J. Acoust. Soc. Am. 127, 2103–2106. (doi:10.1121/1.3337232) [DOI] [PubMed] [Google Scholar]
- 186.Thitaikumar A, Krouskop TA, Garra BS, Ophir J. 2007. Visualization of bonding at an inclusion boundary using axial-shear strain elastography: a feasibility study. Phys. Med. Biol. 52, 2615 (doi:10.1088/0031-9155/52/9/019) [DOI] [PubMed] [Google Scholar]
- 187.Luo C-C, Qian L-X, Li G-Y, Jiang Y, Liang S, Cao Y. 2015. Determining the in vivo elastic properties of dermis layer of human skin using the supersonic shear imaging technique and inverse analysis. Med. Phys. 42, 4106–4115. (doi:10.1118/1.4922133) [DOI] [PubMed] [Google Scholar]
- 188.Chan CW, Cawley P. 1998. Lamb waves in highly attenuative plastic plates. J. Acoust. Soc. Am. 104, 874–881. (doi:10.1121/1.423332) [Google Scholar]


