

Abstract
Although long non‐coding RNAs (lncRNAs) have been associated with a variety of cancers, the interplay between lncRNAs and androgen receptor signaling in prostate cancer is still unclear. We identified an androgen‐dependent lncRNA , POTEF‐AS1, whose expression was regulated by androgen receptor in two androgen‐dependent cells by using directional RNA sequencing analysis. POTEF‐AS1 promoted cell growth, repressed genes related to the Toll‐like receptor signaling and apoptosis pathways, and inhibited apoptosis in docetaxel‐treated LNCaP cells. These findings suggest that POTEF‐AS1 would play a key role in the progression of prostate cancer by repressing Toll‐like receptor signaling.
Keywords: AR, lncRNA, prostate cancer, TLR3, TNFSF10
Long non‐coding RNAs (lncRNAs) are RNA transcripts that are more than 200 nt long but have little protein‐coding potential. Evidence suggests that ncRNAs have essential roles in tumorigenesis and that aberrant expression of lncRNAs in prostate cancer is associated with disease progression.1
Androgen receptor (AR) and its downstream signaling have a crucial role in the development and progression of both localized and advanced metastatic prostate cancer.2, 3, 4 Although high‐risk localized prostate cancer is treated with androgen deprivation therapies in addition to surgery and radiotherapy, many prostate cancers inevitably escape from androgen dependence, leading to castration‐resistant prostate cancer (CRPC).5 Past studies have revealed that elevated AR expression,2 activation of AR transcription,6 and expression of AR variants7 were observed in the progression to CRPC, suggesting the importance of identifying AR downstream signals and new molecular mechanisms for AR activation to improve the treatment of CRPC.
In a previous study, we analyzed the global AR transcriptional network by mapping genome‐wide transcriptional start sites regulated by androgen and AR binding sites.8 We showed the functional role of an lncRNA located at the antisense (AS) region of the C‐terminal binding protein 1 (CTBP1) gene, CTBP1‐AS, in promoting castration‐resistant prostate tumor growth by regulating epigenetically cancer‐associated genes.9 We undertook further comprehensive study using directional RNA sequencing (RNA‐Seq) analysis in two AR‐positive prostate cancer cell lines and CRPC model cell lines.10 Then, we found another AR‐targeted lncRNA located at the AS region of suppressor of cytokine signaling 2 (SOCS2), SOCS2‐AS1. SOCS2‐AS1 is upregulated in CRPC model cells. It promotes androgen signaling by regulating epigenetic function of AR and inhibits apoptosis induced by docetaxel. These studies revealed the importance of androgen‐regulated AS lncRNAs for prostate cancer progression.
In the present study, we focused on lncRNAs located in the AS regions of genes from the NCBI Reference Sequence Database (RefSeq; https://www.ncbi.nlm.nih.gov/refseq/). We then found another androgen‐regulated lncRNA transcribed from the AS strand of prostate, ovary, testis expressed protein family member‐F (POTEF) gene and we named it POTEF‐AS1. POTEF belongs to the POTE gene family, which is primate‐specific and includes 13 paralogs dispersed among eight chromosomes.11 The POTE proteins were considered to be cancer‐testis antigens, because they were expressed in many cancers, but are restricted to only a few normal tissues in the reproductive system. 12, 13 Recently, some studies have suggested a role POTEF in cancer. Mutational data of breast cancer patients was analyzed to predict the probability of patient survival, and POTEF was found among the top driver oncogenic genes, with a mutation prevalence of over 5%.14 In another study, POTEF was identified as a binding partner of Ricinus communis agglutinin I, which may play a critical role in triple‐negative breast cancer metastasis.15 In the present study, we found that POTEF‐AS1 was higher in CRPC model cells compared with parental cells, promoted cell growth, and repressed several genes related to the Toll‐like receptor (TLR) signaling pathway and associated cytokines, including TLR3, chemokine (C‐X‐C motif) ligand 10 (CXCL10) and tumor necrosis factor (ligand) superfamily, member 10 (TNFSF10). Our findings suggest that androgen‐induced POTEF‐AS1 would play an important role in the progression of prostate cancer by modulating TLR signaling.
Materials and Methods
Cell lines and reagents
LNCaP and VCaP cells were grown in RPMI and DMEM, respectively, supplemented with 10% FBS. Long‐term androgen deprived (LTAD) cells were grown in phenol red‐free RPMI medium supplemented with 10% charcoal–dextran‐stripped FBS. For androgen deprivation, cells were cultured for 3 days in phenol red‐free RPMI medium (Nacalai Tesque, Kyoto, Japan) with 2.5% charcoal–dextran‐stripped FBS. All the cells were maintained at 37°C in 10% O2 and 5% CO2. LNCaP cells were obtained from ATCC (Manassas, VA, USA). Short tandem repeat analysis was carried out for the authentication of the cell line. Expression patterns of AR and its variants were checked to verify the prostate cancer cell lines. Cells were checked for mycoplasma contamination using a Mycoplasma Detection Kit (JENA Bioscience, Jena, Germany). 5α‐Dihydrotestosterone (DHT) and bicalutamide were purchased from Sigma (St. Louis, MO, USA).
Clinical samples
We prepared RNA samples obtained by surgeries performed at the University of Tokyo Hospital (Tokyo, Japan). The Tokyo University ethics committee approved this study (No. G10044‐(2)), and informed consent was obtained from each patient before surgery. We collected both prostate cancer tissues and benign prostate tissues from 10 patients by laser capture microdissection as described previously.9, 16
RNA sequencing data
RNA sequencing data has been described10 and is available in the NCBI's Gene Expression Omnibus database (GSE82225; https://www.ncbi.nlm.nih.gov/geo/). We calculated sequence tag distributions in the AS regions of RefSeq genes. Gene expression was determined as the number of reads per kilobase of exon model per million mapped reads. Integrative Genomics Viewer version 2.2, ( http://igv.org/) was used for visualization.
Quantitative RT‐PCR
The RNeasy Kit (Qiagen, Cambridge, Massachusetts) was used for total RNA isolation. First‐strand cDNA was generated using PrimeScript RT reagent kit (TaKaRa, Kyoto, Japan). Expression levels were quantified by quantitative PCR using KAPA SYBR FAST ABI Prism 2X qPCR Master Mix and ABI StepOne system (Life Technologies, Cambridge, Massachusetts). Relative mRNA levels were determined by normalization to GAPDH mRNA level. Primers used are listed in Table S1.
5′/3′ Rapid amplification of cDNA ends
The 5′/3′ RACE was carried out using a 5′/3′ RACE kit (Roche Molecular Biochemicals, Sandhofer Strasse, Germany) according to the manufacturer's instructions. Briefly, cDNA was synthesized using RNA (2 μg) extracted from LTAD cells treated with 10 nM DHT for 72 h. First‐strand cDNA was generated using PrimeScript RT reagent kit (TaKaRa). The PCR amplifications were carried out with specific primers whose locations were determined by predicting the transcription start site and transcription termination sites referring to the RNA‐Seq result (Fig. S1).
siRNA transfection
siRNAs (siPOTEF‐AS1 #1 and #2) were designed using siDirect version 2.0 and purchased from Sigma Genosys (Redwood City, CA). Cells were transfected with siRNAs using Lipofectamine RNAiMax transfection reagent (Thermo Fisher Scientific, Waltham, MA) at a final concentration of 20 nM, according to the manufacturer's protocol. POTEF‐AS1 siRNA sequences are listed in Table S1.
Cell proliferation assay
Cells were cultured in 96‐well plates (2 × 10³ cells) the previous day of siRNA transfection. Cell viability was assessed at different time points using CellTiter 96 AQueous One Solution Cell Proliferation Assay kit (Promega). Plates were incubated at 37°C for 50–90 min and optical density was measured at 490 nm using a microplate spectrophotometer (Benchmark Plus; Bio‐Rad, Richmond, CA, USA).
Microarray analysis
For expression microarrays, a GeneChip Human Exon 1.0 ST Array (Affymetrix, Santa Clara, CA, USA) was used according to the manufacturer's protocol as described.9, 10 Data analysis was undertaken using the Affymetrix Microarray Suite software (Santa Clara, CA). To compare arrays, normalization was performed on data from all probe sets. GO term and Pathway analysis was carried out using DAVID.17 These data are available in the Gene Expression Omnibus database (GSE92355).
Detection of apoptosis
LNCaP cells (5 × 10⁴) were reverse transfected with siPOTEF‐AS1 (#1 or #2) or si‐negative control and suspended on poly‐l‐lysine‐coated slides placed in each well of a 24‐well plate. After 24 h, cells were treated with 1 nM docetaxel and cultured for 24–48 h. The TUNEL assay was carried out using the DeadEnd Fluorometric TUNEL System (Promega). Briefly, slides were fixed with 4% paraformaldehyde, permeabilized with 0.2% Triton‐X, equilibrated with buffer, and stained with the reaction mix. The reaction was stopped with 2× SSC and cells were stained with 1 mg/mL DAPI. Slides were mounted onto glass slides and positively stained cells were counted with a Fluoview (FV10i) microscope (Olympus, Tokyo, Japan).
Statistical analysis
Statistical differences (P‐values) among groups were obtained using a two‐sided Student's t‐test. All experiments were carried out at least twice. Cell proliferation assay was carried out in triplicate. P‐values < 0.05 were considered to be statistically significant. Statistical procedures were undertaken using Excel (Microsoft, Redmond, WA).
Results
POTEF‐AS1 is an androgen‐induced lncRNA highly expressed in CRPC cells
To investigate the relationship between androgen and the expression of novel lncRNA in prostate cancer, AR‐positive prostate cancer cell lines, LNCaP and VCaP, and their corresponding castration‐resistant cell lines, LTAD and VCaP‐LTAD cell lines,9 respectively, were treated with 10 nM DHT, DHT plus anti‐androgen bicalutamide, or DHT plus siRNA targeting AR (siAR). After 24 h, total RNAs were extracted for RNA sequencing analysis as described in the previous study.10 In the present study, the enrichments of sequence tags in the AS region of RefSeq genes were calculated and identified these transcripts as lncRNAs. The lncRNAs that were upregulated more than 1.5‐fold by DHT treatment, and repressed to <0.75‐fold by bicalutamide and siAR treatment, were identified in both LNCaP and VCaP cell lines. Ten transcripts were common in both cell lines which represented lncRNAs transcribed from five different genes (Fig. 1a,b).
Figure 1.
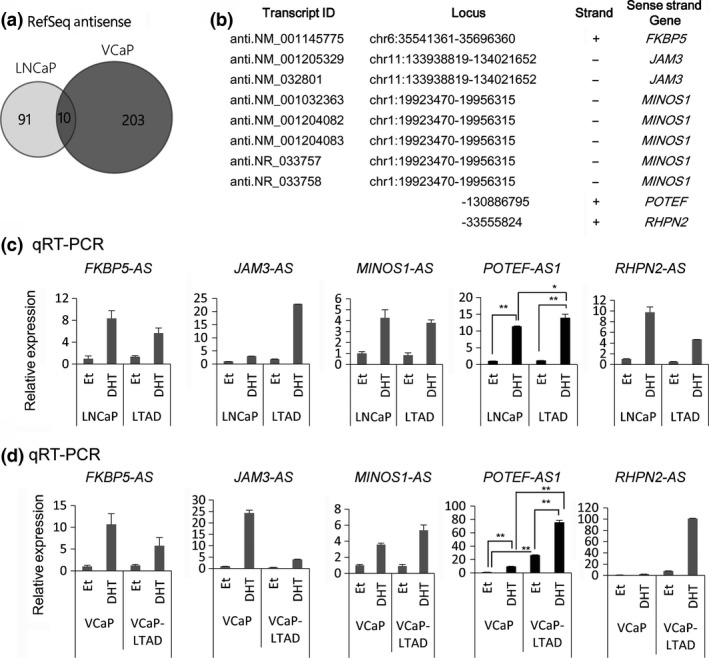
Analysis of androgen‐induced long non‐coding RNAs in prostate cancer. (a) Venn diagram showing the number of antisense transcripts of Reference Sequence (RefSeq) genes detected by RNA sequencing analysis in prostate cancer cells. (b) Summary of antisense transcripts regulated by androgen in the present study. (c, d) Quantitative RT‐PCR analysis of long non‐coding RNAs induced by androgen in LNCaP (c) and VCaP (d) cells (n = 3). Cells were treated with 100 nM 5α‐dihydrotestosterone (DHT) or ethanol (Et) for 24 h. RNA expression levels are presented relative to the value of GAPDH as reference gene. Values represent mean ± SD. *P < 0.05; **P < 0.01.
Next, we used quantitative RT‐PCR (qRT‐PCR) to analyze the expression of five lncRNAs in both LNCaP and VCaP cell lines and their corresponding castration‐resistant model cell lines, LTAD and VCaP‐LTAD. Out of the five lncRNAs, only POTEF‐AS1 was significantly upregulated in LTAD cells compared to LNCaP cells in the presence of DHT, but not in the absence of it (Fig. 1c) and highly expressed in VCaP‐LTAD compared to parental VCaP cell line in the presence and absence of DHT (Fig. 1d). In addition, while its expression was repressed after 48 h of androgen treatment in LNCaP cells, it was further induced even after 72 h of androgen stimulation in LTAD cells, showing a different pattern of induction in CRPC model cells compared to hormone‐naïve prostate cancer cells (Fig. S2a). Interestingly, expression of the sense‐strand gene, POTEF, was significantly lower than POTEF‐AS1, although its induction pattern by androgen in both cell lines was similar to that of POTEF‐AS1 (Fig. S1b). Thus, among the five androgen‐induced lncRNAs, we focused on POTEF‐AS1 which might be involved in CRPC.
Our previous ChIP‐Seq analysis data18, 19 revealed a strong AR binding site at the promoter region of POTEF‐AS1 (Fig. 2a), suggesting that its expression is directly regulated by AR. In order to validate that POTEF‐AS1 is regulated by AR, we treated LNCaP and VCaP cells with bicalutamide and then with 10 nM DHT for 24 h. Cells pretreated with bicalutamide showed lower POTEF‐AS1 expression compared to those treated with vehicle (DMSO) (Fig. 2b,c). Similarly, LNCaP and VCaP cells transfected with siAR before DHT treatment were shown to express lower levels of POTEF‐AS1 compared to negative control siRNA (siNC)‐transfected cells (Fig. 2b,c). These experiments showed that POTEF‐AS1 induction by androgen is directly regulated by AR. Furthermore, analysis of our clinical samples by qRT‐PCR revealed that POTEF‐AS1 expression is significantly higher in prostate cancer compared to benign prostate hyperplasia (Fig. 2d). This result suggests the importance of POTEF‐AS1 expression in prostate cancer development by AR.
Figure 2.
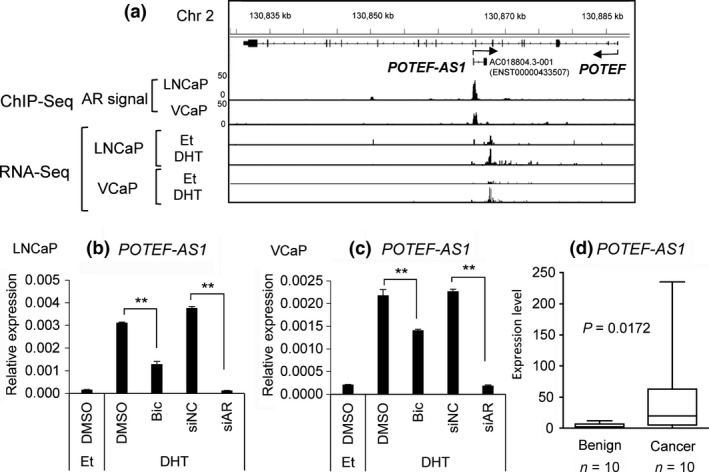
POTEF‐AS1 is regulated by androgen in LNCAP cells. (a) RNA sequencing (RNA‐Seq) and ChIP sequencing (ChIP‐Seq) analyses of POTEF‐AS1 in LNCaP and VCaP cells treated with 10 nM 5α‐dihydrotestosterone (DHT) or ethanol (Et) for 24 h. For ChIP‐Seq data18, 19 of androgen receptor (AR), signal ratios compared with input sample are shown as peaks. (b, c) Quantitative RT‐PCR analysis of POTEF‐AS1 levels following 1 μM bicalutamide (Bic) or DMSO treatment and 10 nM siAR or negative control siRNA (siNC) transfection, following Et or 10 nM DHT treatment for 24 h in LNCaP (b) and VCaP (c) cells (n = 3). AR knockdown was also confirmed by quantitative RT‐PCR analysis. Values represent mean ± SD. *P < 0.05; **P < 0.01. (d) POTEF‐AS1 expression in clinical samples. P‐value was calculated by Mann–Whitney U‐test.
POTEF‐AS1 regulates the expression of apoptosis and TLR signaling pathway‐related genes
To investigate the role of POTEF‐AS1 in prostate cancer, we designed two siRNAs to deplete its expression. In order to design these siRNAs, we searched in Ensembl genome browser ( http://asia.ensembl.org/) and Gencode version 1920 and Noncode version 4 ( http://www.noncode.org/) annotations of the transcription region of POTEF‐AS1. All of the databases showed a two‐exon transcript expressed from the opposite strand of POTEF, but we noticed that its second exon was significantly shorter than our results obtained by direct RNA‐Seq (Figs. 2a,S1). Thus, we determined the transcription start site and the transcription termination site by 5′/3′ RACE. By this experiment, we found that POTEF‐AS1 was transcribed as at least two transcripts of different lengths, one of 1.2 knt (chr2:130865222‐130867939/hg19) and the other of 1.6 knt (chr2:130865222‐130868313/hg19). Compared to the 578‐nt transcript found in the Ensembl genome browser (AC018804.3‐001, ENST00000433507), POTEF‐AS1 was shown to be longer, in line with the results from RNA‐Seq. According to the results obtained by sequencing analysis, the siRNAs were designed at the second exon of POTEF‐AS1 (Fig. S1), and their knockdown efficiency was assessed. LNCaP and LTAD cells cultured for 2 days in androgen‐deprived medium were transfected with 20 nM siPOTEF‐AS1 (#1, #2, and #3). After 24 h, cells were treated with 10 nM DHT for another 24 h. The qRT‐PCR analysis showed that knockdown efficiency of these siRNAs was approximately 20–50% or more in both cell lines (Figs. 3a,S3a). We then examined whether POTEF‐AS1 regulates POTEF expression by cis‐regulatory mechanism, however, knockdown of POTEF‐AS1 did not significantly affect POTEF mRNA expression in these cell lines (Fig. S2c). Therefore, we next undertook microarray analysis to investigate trans‐regulatory effects of POTEF‐AS1 in LNCaP cells. We compared the gene expression profiles in LNCaP cells treated with siPOTEF‐AS1 #1 or siNC. We searched for genes that were downregulated to <0.75‐fold with DHT treatment compared to ethanol‐treated cells in siNC‐transfected cells, whose expression was rescued with siPOTEF‐AS1 transfection in DHT‐treated cells. Kyoto Encyclopedia of Genes and Genomes pathway analysis (Table S2) of these top 100 of these genes using the DAVID bioinformatics platform17 indicated an enrichment of genes involved in the TLR signaling pathway (P = 4.4E‐2) such as TLR3, as well as genes involved in cytokine activity (P = 1.3E‐3) such as CXCL10, also known as IP‐10, and TNFSF10 also known as TRAIL. TLR3 and TNFSF10 expression was totally repressed in LTAD cells (Fig. 3b). The expression of these genes increased in LNCaP cells treated with siPOTEF‐AS1 (Figs. 3c,S3b). We also observed de‐repression of these signals by siPOTEF‐AS1 treatment (Fig. S3c). These data suggest the role of POTEF‐AS1 in repressing TLR‐ and apoptosis‐related genes in prostate cancer.
Figure 3.
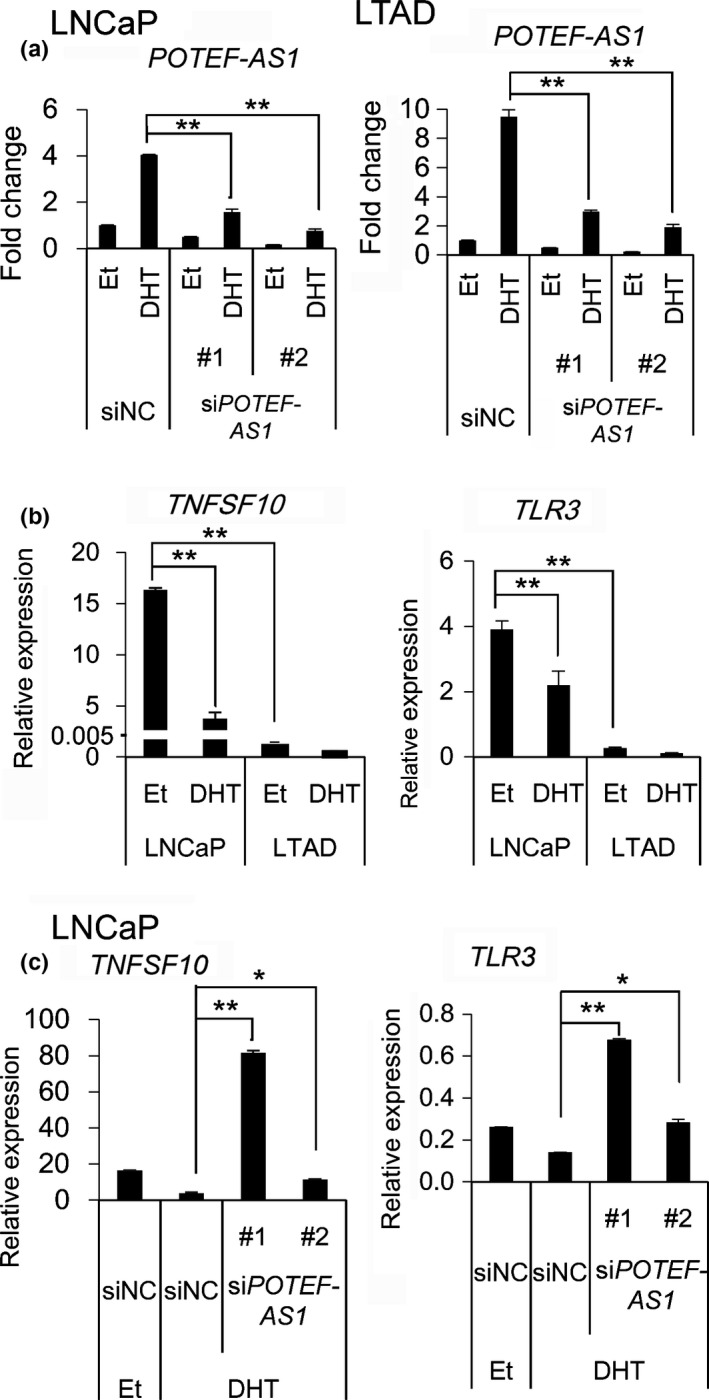
POTEF‐AS1 inhibits Toll‐like receptor (TLR) signaling and apoptosis‐related genes. (a) Knockdown efficiency of POTEF‐AS1 by siRNA, analyzed by quantitative RT‐PCR (n = 3) in LNCaP and LTAD cells treated with 10 nM 5α‐dihydrotestosterone (DHT) or ethanol (Et) for 18 h. LNCaP and LTAD cells were transfected with 20 nM and 50 nM siRNA, respectively. The value of vehicle and negative control siRNA (siNC)‐treated cells was set to 1. (b) TLR3 and TNFSF10 mRNA expressions analyzed by quantitative RT‐PCR in LNCaP and LTAD cells treated with Et or 10 nM DHT for 24 h. (c) TLR3 and TNFSF10 mRNA expression in siPOTEF‐AS1 or siNC‐transfected LNCaP (20 nM siRNA) cells for 24 h. Values represent mean ± SD. *P < 0.05; **P < 0.01.
Knockdown of POTEF‐AS1 inhibited prostate cancer cell growth
It has been suggested that TLR3 signaling, CXCL10, and TNFSF10 trigger apoptosis and growth arrest of prostate cancer cells.21, 22 To examine whether POTEF‐AS1 depletion influences cell proliferation, we transfected these siRNAs into LNCaP and LTAD cells precultured in androgen‐deprived medium for 2 days. Twenty‐four hours after transfection, cells were treated with 10 nM DHT or ethanol; the following day, cell proliferation changes were measured by MTS cell proliferation assay. We found that POTEF‐AS1 knockdown reduced cell proliferation in both ethanol‐ and DHT‐treated cells, suggesting that POTEF‐AS1 enhances prostate cancer cell growth (Fig. 4a,b).
Figure 4.
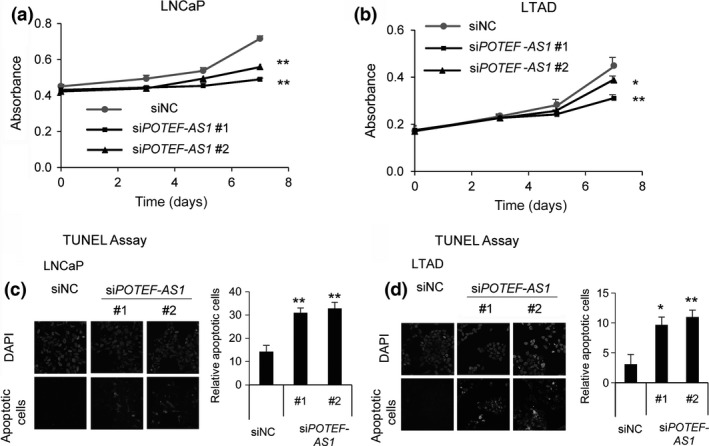
POTEF‐AS1 knockdown inhibits cell growth and increases apoptosis. (a, b) Cell proliferation (MTS) assay in LNCaP (a) and LTAD (b) cells transfected with 20 nM siPOTEF‐AS1 or negative control siRNA (siNC) for indicated time points, following 10 nM 5α‐dihydrotestosterone treatment. (c, d) DAPI (upper panels) and apoptotic cells detected with 488‐nm laser (lower panels) stained siPOTEF‐AS1 (#1 and #2) transfected LNCaP (c) and LTAD (d) cells treated with 1 nM docetaxel for 24 or 48 h, respectively. Graph represents quantification of apoptotic cells. Data represent the average of three different views (n = 3). Values represent mean ± SD. *P < 0.05; **P < 0.01.
Knockdown of POTEF‐AS1 promoted apoptosis in docetaxel‐treated prostate cancer cells
Next, to examine whether siPOTEF‐AS1 triggers apoptosis, we carried out TUNEL assays in LNCaP and LTAD cells transfected with 20 nM siPOTEF‐AS1 or control siRNA and treated with 1 nM docetaxel for 24 or 48 h. Green fluorescence‐stained cells, representing cells undergoing apoptosis, were observed in siPOTEF‐AS1 transfected cells, whereas apoptotic cells were not significantly observed in control cells (Fig. 4c,d), suggesting that POTEF‐AS1 inhibits apoptosis. Taken together, these data suggest that POTEF‐AS1 is involved in growth and survival of CRPC, probably through TLR signaling and apoptosis pathways.
Discussion
Antisense transcripts, which were initially considered as transcriptional noise, are increasingly being recognized as important regulators of gene expression, including cancer.23 Our analysis indicated that POTEF‐AS1 is an androgen‐dependent transcriptional regulator that affects the gene expression profiles in several pathways linked to TLR signaling and apoptosis, by targeting TLR3 and TNFSF10. Toll‐like receptors are a family of transmembrane receptors that mediate the production of cytokines necessary for the development of effective immunity, such as CXCL10.24 The role of TLR3 in prostate cancer is controversial. TLR3 mRNA has been detected in prostate cancer, and high TLR3 expression level was significantly associated with high probability of recurrence of prostate cancer.25 In LNCaP cells, TLR3 activation by poly(I:C) treatment upregulated several cytokines, including CXCL10, which may result in suppression of tumor growth. A recent study in human prostate cancer cells suggests that TLR3 signaling triggers apoptosis and growth arrest of LNCaP cells partially through the inactivation of the phosphatidylinositol 3‐kinase/protein kinase B pathway.21 TNFSF10 is a cytokine that belongs to a small subset of pro‐apoptotic protein ligands in the TNF superfamily and causes apoptosis primarily in tumor cells by binding to certain death receptors.26, 27 Therefore, our results suggest that POTEF‐AS1 would inhibit apoptosis by targeting TLR and apoptosis pathway‐related gene expressions. Further study to examine whether knockdown of these genes can rescue the apoptosis in POTEF‐AS1 knockdown cells is intriguing to validate the importance of this pathway. More importantly, de‐repression of TLR3 and TNFSF10 by siPOTEF‐AS1 in LTAD cells was not so evident as in LNCaP cells in our qRT‐PCR analysis (Fig. S3c), suggesting the possibility that target pathways by POTEF‐AS1 are different in CRPC cells. We consider that microarray analysis in LTAD cells is necessary to identify such specific signals in CRPC.
In a previous study, we reported that another androgen‐regulated lncRNA, SOCS2‐AS1, also represses TNFSF10 and expression of other apoptosis‐related genes.10 Our experimental results indicated that SOCS2‐AS1 modulates AR epigenetic activity by interacting with AR. In the microarray analysis, we observed that androgen repression of TLR3 and TNFSF10 was rescued with siPOTEF‐AS1 transfection, which was confirmed by qRT‐PCR analysis. Although further analyses are required to elucidate its precise mechanism to regulate gene expression by POTEF‐AS1, it is tempting to speculate that POTEF‐AS1 may modulate AR activity in combination with SOCS2‐AS1 because both TNFSF10 and TLR3 are androgen‐regulated genes. It is important to find the interacting partners of lncRNA to analyze the molecular mechanism for gene regulation because previous studies, including ours, have revealed the functions of lncRNAs by showing the interacting proteins or RNAs.1, 9
We have used LTAD cells to investigate the biological characteristics of CRPC. In our RNA‐Seq study, POTEF‐AS1 was found to be regulated by AR in both LNCaP and VCaP systems. Although LNCaP cells was mainly used in this study, further analysis in VCaP cells is necessary to investigate the role of POTEF‐AS1 in CRPC because POTEF‐AS1 is upregulated in VCaP‐LTAD cells compared with parental VCaP cells, as shown in Figure 1(c). In the LNCaP system, POTEF‐AS1 is upregulated in LTAD cells in the presence of DHT, not in its absence. However, androgen responsiveness to DHT is enhanced in LTAD cells, as shown in Figure S2. Upregulation of gene expression in CRPC is also related with AR hypersensitivity,2, 6 reflecting the important role of AR in CRPC. In addition, in the absence of androgen by hormone therapy, low doses of androgen production in intratumor tissues have been described.28 Thus, we speculate that the hypersensitivity of AR to induce POTEF‐AS1 by DHT is also important for CRPC.
In the present study, we investigated AS lncRNAs putatively induced by AR binding in two AR‐positive prostate cancer cells using directional RNA‐Seq methods. POTEF‐AS1 knockdown upregulated genes related to TLR signaling and apoptosis pathways, such as TLR3 and TNFSF10, and inhibited cell growth and apoptosis in docetaxel‐treated cells. POTEF‐AS1 could play a key role in the development of CRPC by repressing apoptosis and the TLR signaling pathway and therefore it would provide a promising novel strategy for cancer treatment.
Disclosure Statement
The authors have no conflict of interest.
Supporting information
Fig. S1. Determination of 5′‐ and 3′‐ends of POTEF‐AS1 by the 5′/3′ RACE method. RNA extracted from LTAD cells treated with 10 nM 5α‐dihydrotestosterone (DHT) for 72 h was used as a template to synthesize cDNA. Short arrows indicate location of primers for RACE PCR amplification. Long arrows indicate exon length of the transcribed products determined by sequencing. Short lines indicate location of siPOTEF‐AS1 (#1, #2).
Fig. S2. POTEF‐AS1 is induced by androgen in LNCAP cells and is highly expressed in castration‐resistant prostate cancer model LTAD cells. (a, b) Time course analysis of POTEF‐AS1 (a) and POTEF mRNA (b) expression levels after androgen (10 nM 5α‐dihydrotestosterone, DHT) treatment in LNCaP and LTAD cell lines determined by quantitative RT‐PCR (qRT‐PCR). (c) POTEF mRNA expression levels after 20 nM siPOTEF‐AS1 transfection and DHT treatment for 18 h in LNCaP and LTAD cell lines determined by qRT‐PCR. RNA expression levels are presented relative to the value of GAPDH as reference gene. Values represent mean ± SD. *P < 0.05; **P < 0.01.
Fig. S3. Regulation of and tumor necrosis factor (ligand) superfamily, member 10 (TNFSF10) and Toll‐like receptor 3 (TLR3) by POTEF‐AS1 in LNCaP and LTAD cells. (a) Knockdown efficiency of POTEF‐AS1 by three siRNAs, analyzed by quantitative RT‐PCR (n = 3) in LNCaP and LTAD cells treated with 10 nM 5α‐dihydrotestosterone (DHT) or ethanol (Et) for 24 h. Both cell lines were transfected with 20 nM siRNA. (b) TLR3 and TNFSF10 mRNA expression in siPOTEF‐AS1 or negative control siRNA (siNC)‐transfected LNCaP (20 nM siRNA) cells for 24 h. (b) TLR3 and TNFSF10 mRNA expressions in siPOTEF‐AS1‐ or siNC‐transfected LTAD (20 nM siRNA) cells for 24 h. Values represent mean ± SD. *P < 0.05; **P < 0.01.
Table S1. Sequences of PCR primers and siRNAs.
Table S2. Kyoto Encyclopedia of Genes and Genomes pathway analysis of genes repressed with androgen treatment and induced by siPOTEF‐AS1 transfection.
Acknowledgments
The authors thank RIKEN for sequencing our samples. We are grateful to N. Sasaki and T. Oishi for technical assistance (microarray and bioinformatics analyses). This work was supported by grants from: the Cell Innovation Program, P‐DIRECT, and P‐CREATE from the Ministry of Education, Culture, Sports, Science and Technology, Japan (to S.I.); the Japan Society for the Promotion of Science (15K15581 to K.T.; 15K15353 to S.I.); the Program for Promotion of Fundamental Studies in Health Sciences from the National Institute of Biomedical Innovation, Japan (to S.I.); Grants‐in‐Aid (S.I.) from the Ministry of Health, Labor and Welfare, Japan; the Yasuda Memorial Foundation; and the Princess Takamatsu Cancer Research Fund (K.T.), Japan.
Cancer Sci 108 (2017) 373–379
Funding Information
Ministry of Education, Culture, Sports, Science and Technology, Japan; Japan Society for the Promotion of Science; National Institute of Biomedical Innovation, Japan; Ministry of Health, Labor and Welfare, Japan; Yasuda Memorial Foundation; Princess Takamatsu Cancer Research Fund
References
- 1. Takayama K, Inoue S. The emerging role of noncoding RNA in prostate cancer progression and its implication on diagnosis and treatment. Brief Funct Genomics 2016; 15: 257–65. [DOI] [PubMed] [Google Scholar]
- 2. Chen CD, Welsbie DS, Tran C et al Molecular determinants of resistance to antiandrogen therapy. Nat Med 2004; 10: 33–9. [DOI] [PubMed] [Google Scholar]
- 3. Takayama K, Inoue S. Transcriptional network of androgen receptor in prostate cancer progression. Int J Urol 2013; 20: 756–68. [DOI] [PubMed] [Google Scholar]
- 4. Wang Q, Li W, Zhang Y et al Androgen receptor regulates a distinct transcription program in androgen‐independent prostate cancer. Cell 2009; 138: 245–56. [DOI] [PMC free article] [PubMed] [Google Scholar]
- 5. Smith MR, Cook R, Lee KA, Nelson JB. Disease and host characteristics as predictors of time to first bone metastasis and death in men with progressive castration‐resistant nonmetastatic prostate cancer. Cancer 2011; 117: 2077–85. [DOI] [PMC free article] [PubMed] [Google Scholar]
- 6. Waltering KK, Helenius MA, Sahu B et al Increased expression of androgen receptor sensitizes prostate cancer cells to low levels of androgens. Cancer Res 2009; 69: 8141–9. [DOI] [PubMed] [Google Scholar]
- 7. Sun S, Sprenger CC, Vessella RL et al Castration resistance in human prostate cancer is conferred by a frequently occurring androgen receptor splice variant. J Clin Invest 2010; 120: 2715–30. [DOI] [PMC free article] [PubMed] [Google Scholar]
- 8. Takayama K, Tsutsumi S, Katayama S et al Integration of cap analysis of gene expression and chromatin immunoprecipitation analysis on array reveals genome‐wide androgen receptor signaling in prostate cancer cells. Oncogene 2011; 30: 619–30. [DOI] [PubMed] [Google Scholar]
- 9. Takayama K, Horie‐Inoue K, Katayama S et al Androgen‐responsive long noncoding RNA CTBP1‐AS promotes prostate cancer. EMBO J 2013; 32: 1665–80. [DOI] [PMC free article] [PubMed] [Google Scholar]
- 10. Misawa A, Takayama K, Urano T, Inoue S. Androgen‐induced lncRNA SOCS2‐AS1 promotes cell growth and inhibits apoptosis in prostate cancer cells. J Biol Chem 2016; 291: 17861–80. [DOI] [PMC free article] [PubMed] [Google Scholar]
- 11. Bera TK, Zimonjic DB, Popescu NC et al POTE, a highly homologous gene family located on numerous chromosomes and expressed in prostate, ovary, testis, placenta, and prostate cancer. Proc Natl Acad Sci USA 2002; 99: 16975–80. [DOI] [PMC free article] [PubMed] [Google Scholar]
- 12. Bera TK, Saint Fleur A, Lee Y et al POTE paralogs are induced and differentially expressed in many cancers. Cancer Res, 2006; 66: 52–6. [DOI] [PubMed] [Google Scholar]
- 13. Bera TK, Walker DA, Sherins RJ, Pastan I. POTE protein, a cancer‐testis antigen, is highly expressed in spermatids in human testis and is associated with apoptotic cells. Biochem Biophys Res Commun 2012; 417: 1271–4. [DOI] [PMC free article] [PubMed] [Google Scholar]
- 14. Pongor L, Kormos M, Hatzis C, Pusztai L, Szabó A, Győrffy B. A genome‐wide approach to link genotype to clinical outcome by utilizing next generation sequencing and gene chip data of 6,697 breast cancer patients. Genome Med 2015; 7: 104. [DOI] [PMC free article] [PubMed] [Google Scholar]
- 15. Zhou SM, Cheng L, Guo SJ et al Lectin RCA‐I specifically binds to metastasis‐associated cell surface glycans in triple‐negative breast cancer. Breast Cancer Res 2015; 17: 36. [DOI] [PMC free article] [PubMed] [Google Scholar]
- 16. Fujimura T, Takahashi S, Urano T et al Expression of androgen and estrogen signaling components and stem cell markers to predict cancer progression and cancer‐specific survival in patients with metastatic prostate cancer. Clin Cancer Res 2014; 20: 4625–35. [DOI] [PubMed] [Google Scholar]
- 17. Huang DW, Sherman BT, Lempicki RA. Bioinformatics enrichment tools: paths toward the comprehensive functional analysis of large gene lists. Nucleic Acids Res 2009; 37: 1–13. [DOI] [PMC free article] [PubMed] [Google Scholar]
- 18. Takayama K, Suzuki T, Fujimura T et al CtBP2 modulates the androgen receptor to promote prostate cancer progression. Cancer Res 2014; 74: 6542–53. [DOI] [PubMed] [Google Scholar]
- 19. Takayama K, Misawa A, Suzuki T et al TET2 repression by androgen hormone regulates global hydroxymethylation status and prostate cancer progression. Nat Commun 2015; 6: 8219. [DOI] [PubMed] [Google Scholar]
- 20. Harrow J, Frankish A, Gonzalez JM et al GENCODE: the reference human genome annotation for The ENCODE Project. Genome Res, 2012; 22: 1760–74. [DOI] [PMC free article] [PubMed] [Google Scholar]
- 21. Harashima N, Inao T, Imamura R, Okano S, Suda T, Harada M. Roles of the PI3K/Akt pathway and autophagy in TLR3 signaling‐induced apoptosis and growth arrest of human prostate cancer cells. Cancer Immunol Immunother 2012; 61: 667–76. [DOI] [PMC free article] [PubMed] [Google Scholar]
- 22. Yu R, Mandlekar S, Ruben S, Ni J, Kong AN. Tumor necrosis factor‐related apoptosis‐inducing ligand‐mediated apoptosis in androgen‐independent prostate cancer cells. Cancer Res 2000; 60: 2384–9. [PubMed] [Google Scholar]
- 23. Pelechano V, Steinmetz LM. Gene regulation by antisense transcription. Nat Rev Genet 2013; 14: 880–93. [DOI] [PubMed] [Google Scholar]
- 24. Galli R, Starace D, Busà R et al TLR stimulation of prostate tumor cells induces chemokine‐mediated recruitment of specific immune cell types. J Immunol 2010; 184: 6658–69. [DOI] [PubMed] [Google Scholar]
- 25. González‐Reyes S, Fernández JM, González LO et al Study of TLR3, TLR4, and TLR9 in prostate carcinomas and their association with biochemical recurrence. Cancer Immunol Immunother 2011; 60: 217–26. [DOI] [PMC free article] [PubMed] [Google Scholar]
- 26. Farooqi AA, Bhatti S, Ismail M. TRAIL and vitamins: opting for keys to castle of cancer proteome instead of open sesame. Cancer Cell Int 2012; 12: 22. [DOI] [PMC free article] [PubMed] [Google Scholar]
- 27. Farooqi AA, Rana A, Riaz AM et al NutriTRAILomics in prostate cancer: time to have two strings to one's bow. Mol Biol Rep 2012; 39: 4909–14. [DOI] [PubMed] [Google Scholar]
- 28. Wadosky KM, Koochekpour S. Molecular mechanisms underlying resistance to androgen deprivation therapy in prostate cancer. Oncotarget, 2016; 7: 64447–70; doi: 10.18632/oncotarget.10901. [DOI] [PMC free article] [PubMed] [Google Scholar]
Associated Data
This section collects any data citations, data availability statements, or supplementary materials included in this article.
Supplementary Materials
Fig. S1. Determination of 5′‐ and 3′‐ends of POTEF‐AS1 by the 5′/3′ RACE method. RNA extracted from LTAD cells treated with 10 nM 5α‐dihydrotestosterone (DHT) for 72 h was used as a template to synthesize cDNA. Short arrows indicate location of primers for RACE PCR amplification. Long arrows indicate exon length of the transcribed products determined by sequencing. Short lines indicate location of siPOTEF‐AS1 (#1, #2).
Fig. S2. POTEF‐AS1 is induced by androgen in LNCAP cells and is highly expressed in castration‐resistant prostate cancer model LTAD cells. (a, b) Time course analysis of POTEF‐AS1 (a) and POTEF mRNA (b) expression levels after androgen (10 nM 5α‐dihydrotestosterone, DHT) treatment in LNCaP and LTAD cell lines determined by quantitative RT‐PCR (qRT‐PCR). (c) POTEF mRNA expression levels after 20 nM siPOTEF‐AS1 transfection and DHT treatment for 18 h in LNCaP and LTAD cell lines determined by qRT‐PCR. RNA expression levels are presented relative to the value of GAPDH as reference gene. Values represent mean ± SD. *P < 0.05; **P < 0.01.
Fig. S3. Regulation of and tumor necrosis factor (ligand) superfamily, member 10 (TNFSF10) and Toll‐like receptor 3 (TLR3) by POTEF‐AS1 in LNCaP and LTAD cells. (a) Knockdown efficiency of POTEF‐AS1 by three siRNAs, analyzed by quantitative RT‐PCR (n = 3) in LNCaP and LTAD cells treated with 10 nM 5α‐dihydrotestosterone (DHT) or ethanol (Et) for 24 h. Both cell lines were transfected with 20 nM siRNA. (b) TLR3 and TNFSF10 mRNA expression in siPOTEF‐AS1 or negative control siRNA (siNC)‐transfected LNCaP (20 nM siRNA) cells for 24 h. (b) TLR3 and TNFSF10 mRNA expressions in siPOTEF‐AS1‐ or siNC‐transfected LTAD (20 nM siRNA) cells for 24 h. Values represent mean ± SD. *P < 0.05; **P < 0.01.
Table S1. Sequences of PCR primers and siRNAs.
Table S2. Kyoto Encyclopedia of Genes and Genomes pathway analysis of genes repressed with androgen treatment and induced by siPOTEF‐AS1 transfection.