

Abstract
Chemoresistance, the major obstacle in breast cancer chemotherapy, results in unnecessary chemotherapy and wasting of medical resources. No feasible method has been available to predict chemoresistance before chemotherapy. In our previous study, elevated expression of transient receptor potential channel TRPC5 was found to be an essential element for chemoresistance in breast cancer cells, and it was determined that it could be transferred to chemosensitive breast cancer cells through releasing extracellular vesicles (EV) containing TRPC5 from chemoresistant cells, resulting in acquired chemoresistance. Exosomes, a type of EV, are secreted membrane‐enclosed vesicles of 50–150‐nm diameter. In this study we found that circulating exosomes in peripheral blood from breast cancer patients carried TRPC5. In the present study, circulating exosome‐carrying TRPC5 (cirExo‐TRPC5) level was significantly correlated with TRPC5 expression level in breast cancer tissues and tumor response to chemotherapy. Furthermore, increased cirExo‐TRPC5 level after chemotherapy preceded progressive disease (PD) based on imaging examination and strongly predicted acquired chemoresistance. Taken together, our study demonstrated that cirExo‐TRPC5 might act as a noninvasive chemoresistance marker and might serve as an adjuvant to the current imaging examination‐based chemoresistance.
Keywords: Breast cancer, chemoresistance, exosome, prediction, transient receptor potential canonical 5
Breast cancer is the leading cause of morbidity and mortality worldwide.1 It is the third most common malignant tumor, and the fifth cause of cancer‐related death in China.2 Chemotherapy is the most common treatment option for breast cancer. In most cases, its failure is due to chemoresistance, which results in tumor progression, thereby contributing to the major cause of cancer‐related death. However, the detailed mechanism underlying chemoresistance in breast cancer is still poorly understood.
In our previous study, we demonstrate that elevated expression of transient receptor potential channel TRPC5 induces chemoresistance in breast cancer cells.3 This ability to resist to chemotherapy could be transferred to chemosensitive breast cancer cells through extracellular vesicles (EV) containing TRPC5 released from chemoresistant cells, leading to acquired chemoresistance.4 Furthermore, EV‐containing TRPC5 were found in peripheral blood from breast cancer patients undergoing chemotherapy but not in patients not undergoing chemotherapy. Therefore, because a feasible method is not available to predict chemoresistance before chemotherapy, we aimed to evaluate the potential role of EV‐containing TRPC5 as a chemoresistance biomarker.
Exosomes, a kind of EV, are secreted membrane‐enclosed vesicles of 50–150‐nm in diameter.5 They contain a common set of proteins and RNA, including the specific molecular signature depending upon the nature and conditions of the cell type of origin.6, 7 Here, we explore the potential involvement of exosomes in TRPC5 transfer and the role of circulating exosomes containing TRPC5 (cirExo‐TRPC5) as a potential chemoresistance biomarker in breast cancer.
Materials and Method
Antibodies and reagents
The primary antibodies anti‐CD63 (ab59479), anti‐MUC1 (ab70475), anti‐TRPC5 (ab63151) and anti‐Flotillin1 (ab133497) were purchased from Abcam Biotechnology (Cambridge, MA, USA), while the primary antibody anti‐β‐actin (AA128) was purchased from Beyotime Biotechnology (Nantong, Jiangsu Province, China). Proteinase K (ST532) and Triton X‐100 (ST795) were purchased from Beyotime Biotechnology. The secondary antibodies goat anti‐rabbit IgG (A0277) and goat anti‐mouse IgG (A0286) were purchased from Beyotime Biotechnology, while donkey anti‐mouse IgG (H+L) (Alexa Fluor 488, A‐21202) and goat anti‐rabbit IgG (H+L) (Alexa Fluor 568, A‐11011) were purchased from Thermo Fisher Scientific (Waltham, MA, USA). RIPA (P0013B) and the Bradford Protein Assay Kit (P0006) were purchased from Beyotime Biotechnology. Fluorophore‐labeled donkey anti‐rabbit IgG antibody (A11374) and fluorophore‐labeled donkey anti‐mouse IgG antibody (A‐21202) and Total Exosome Isolation Kit (from plasma) (4484450) were purchased from Invitrogen (Camarillo, CA, USA). The syringe filter unit (0.22 μm) was purchased from Millipore (Darmstadt, Germany).
Patients and follow up
Breast cancer patients with unresectable metastasis (diameter more than 1 cm, as displayed by computed tomography [CT scan]) who received first‐line chemotherapy were enrolled in this study. MUC1, frequently expressed in breast cancer, is sorted into rafts by a flotillin‐dependent mechanism and exported through exosomes.8, 9, 10 Thus, In this study, patients with serum MUC1 level less than 10 ng/mL were excluded. Complete pathological and clinical information of the patients was recorded, including age, sex, serum MUC1 level, tumor grade, estrogen receptor (ER)/progesterone receptor (PR) status, human epidermal growth factor receptor‐2 (HER2) status, and Ki‐67 score. Plasma was obtained from each of the 131 breast cancer patients, while tumor tissue was obtained from 54 patients before chemotherapy. All patients received first‐line anthracycline/taxane‐based chemotherapy for at least two cycles until disease progression, unacceptable toxicity or patient refusal. Patients who ceased chemotherapy due to unacceptable toxicity or refusal to continue treatment were excluded. Table 1 shows the clinical and pathological characteristics of the 131 breast cancer female patients enrolled in this study, who were 27–85 years old (median age 61 years). Tumor assessment was performed after every two cycles by CT scan. Patients were classified according to the Response Evaluation Criteria in Solid Tumors 1.1 (RECIST 1.1) into the following categories: complete response (CR), partial response (PR), stable disease (SD) and progressive disease (PD).11 Progression free survival (PFS) was defined as the interval from the first target lesion CT scan evaluation (less than 2 weeks before the first chemotherapy) to PD. Ethical permission was obtained from the Ethics Committee at the Affiliated Hospital of Jiangnan University (the Fourth People's Hospital of Wuxi) and conformed to the provisions of the Declaration of Helsinki (as revised in Fortaleza, Brazil, October 2013).
Table 1.
Clinical and tumor characteristics for breast cancer patients
| Characteristic | All patients (n = 131) | |
|---|---|---|
| n | % | |
| Age(years) | ||
| Mean | 62.6 | |
| SD | 10.7 | |
| ≤60 | 57 | 43.51 |
| >60 | 74 | 56.49 |
| Sex | ||
| Male | 0 | 0 |
| Female | 131 | 100 |
| Histology | ||
| Ductal | 131 | 100 |
| Tumor grade | ||
| Well or moderately differentiated | 63 | 48.09 |
| Poorly differentiated | 68 | 51.91 |
| ER/PR status | ||
| Positive | 77 | 58.78 |
| Negetaive | 54 | 41.22 |
| HER‐2 status | ||
| Positive | 53 | 40.46 |
| Negetaive | 78 | 59.54 |
| Ki‐67 score | ||
| <14% | 20 | 15.27 |
| ≥14% | 111 | 84.73 |
| Chemotherapy | ||
| Anthracycline | 43 | 32.82 |
| Taxane | 33 | 25.19 |
| Anthracycline/t axane | 55 | 41.98 |
| Outcome of chemotherapya | ||
| CR | 0 | 0.00 |
| PR | 69 | 52.67 |
| SD | 22 | 16.79 |
| PD | 40 | 30.53 |
Outcome of 2 cycles of first‐line chemotherapy in 131 breast cancer patients was classified according to the Response Evaluation Criteria in Solid Tumours 1.1 (RECIST 1.1) categories (complete response (CR), partial response (PR), stable disease (SD), progressive disease (PD)). ER, estradiol receptor; PR, progesterone receptor; HER‐2, human epidermal growth factor receptor‐2.
Exosomes isolation
Exosomes were collected from patient plasma as previously described.4, 12, 13 The exosomes pellet was stored at −80°C until use for further research. Exosomes were lysed in RIPA buffer containing 1 mM PMSF to release the proteins and the total protein content was quantified using a Bradford Protein Assay Kit (P0006, Beyotime, China). FACS analysis and confocal analysis (see following paragraphs) were performed using 30 μg exosomes incubated with 10 μL 3‐μm diameter aldehyde/sulfate latex beads for 15 min at room temperature under continuous rotation. The reaction was stopped by incubation in 100 mM glycine for 30 min and the exosome‐bound beads were blocked with 10% BSA. Coated beads were washed three times in PBS and stained with specific antibodies, as explained in the following paragraphs.
Western blot
Exosomes proteins were loaded into each lane of an 8% polyacrylamide gel containing 0.1%SDS. The resolved proteins were transferred to a PVDF membrane. Primary antibodies anti‐CD63 (1:1000), anti‐MUC1 (1:500), anti‐TRPC5 (1:500), anti‐β‐actin (1:1000) and anti‐Flotillin1 (1:1000) were used to detect the proteins of interest. Flotillin‐113 was used as the internal reference. The antigen–antibody complexes were visualized by an enhanced chemiluminescent reaction. Protein bands were analyzed using ImageJ software (NIH, Bethesda, MD, USA).
Immunofluorescent and immunohistochemical staining
The exosome‐bound beads were seeded in culture dishes. Primary antibodies anti‐TRPC5 (1:1000), anti‐CD63 (1:500) and anti‐MUC1 (1:200) were used to detect the expression of the related protein. Latex beads were visualized under a confocal laser scanning microscope (Leica TCS SP8, Wetzlar, Germany) and analyzed using Image J software. Breast cancer tissue slides were deparaffinized with xylene and rehydrated in a graded alcohol series. After incubation in 10% BSA, the slides were subsequently incubated with primary antibody anti‐TRPC5 overnight at 4°C in a humidified chamber, followed by second antibody incubation at room temperature for 1 h. The immunostaining results were assessed by two pathologists. Five visual fields were selected from each slide. The results were obtained according to the German semi‐quantitative scoring system (no staining = 0; weak staining = 1, moderate staining = 2, strong staining = 3) and the extent of stained cells (0% = 0, 1–24% = 1, 25–49% = 2, 50–74% = 3, 75–100% = 4).14 The final immunoreactive score was determined by multiplying the intensity score with the score extent of stained cells, ranging from 0 (the minimum score) to 12 (the maximum score) and was defined as follows: ± (0–3), + (3.1–6), ++ (6.1–9), +++ (9.1–12).
Flow cytometry
Exosome‐bound beads collected by centrifugation were stained with primary antibody against TRPC5 (1:200) for 2 h and incubated at room temperature with Alexa‐568‐tagged secondary antibody (1:1000) for 1 h. Finally, samples were re‐suspended in PBS and analyzed using a FACSCalibur Flow Cytometer (BD Biosciences, Mountain View, USA).
Statistical analysis
Results are expressed as mean ± SE. Statistical significance was determined by Student's t‐test. The relationship between the cirExo‐TRPC5 level and various pathological and clinical factors was analyzed using the Mann–Whitney U‐test. The most appropriate cirExo‐TRPC5 score change ratio cut‐off value was obtained by Cox hazard proportional model according to PFS. Factors deemed of potential importance in the univariate analyses (P < 0.05) were included in the multivariate analyses. Multivariate analysis was performed using the Cox regression method in order to search for independent prognostic factors for PFS. The Kaplan–Meier method was used to plot the PFS curve and the log‐rank test was used to determine significance. P < 0.05 was considered statistically significant.
Results
Chemotherapy outcome
After the first two chemotherapy cycles, 69 patients achieved CR or PR (considered as responders) and the remaining 62 patients achieved SD or PD (considered as non‐responders). The termination of follow up was PD. A total of 656 cycles (2–10 cycles, median 4 cycles) of first‐line chemotherapy was performed in all 131 breast cancer patients enrolled in this study, with 192 cycles of first‐line chemotherapy in non‐responders. The most common adverse events were nausea (84 [64.1%]), vomiting (61 [46.6%]) and neutropenia (66 [50.4%]).
CirExo‐TRPC5 level was correlated with TRPC5 expression level in breast cancer tissues
CD63, an established exosomal marker,15 was used to examine exosomes adsorption by the latex beads. Western blot showed the presence of CD63, MUC1 and TRPC5 in the final exosomes pellet from patient plasma (Fig. 1a). We next investigated the possible cell contamination in the exosomes proteins. The circulating exosomes acquired from 400 uL plasm of the same patient were treated with 0.5 mg/mL proteinase K (1 h, 37°C) and 1% Triton X‐100 (20 min), and subsequent western blot showed that the β‐actin protein level in exosomes was unchanged upon proteinase K treatment alone, while significantly decreased when treated with proteinase K and Triton X‐100 simultaneously (Fig. 1b). These results indicated the exosomes proteins used in our study did not cause cell contamination. Likewise, further immunofluorescent staining showed different fluorescence intensity when detecting CD63, MUC1 and TRPC5 in exosomes from plasma, while no fluorescence was observed in the absence of exosomes or primary antibodies (Fig. 1c). Latex beads without incubation with exosomes or primary antibody were considered as controls. These results indicated the exosomes presence in the patients’ plasma containing MUC1 and TRPC5 protein. Immunohistochemistry staining showed different TRPC5 expression levels in different breast cancer tissues (Fig. 2a), while flow cytometry (FCM) showed different cirExo‐TRPC5 levels in plasma from different patients (Fig. 2b). Pearson correlation analysis showed that TRPC5 expression levels in breast cancer tissues were positively correlated to cirExo‐TRPC5 levels (Fig. 2c). Similar positive correlation was observed between cirExo‐TRPC5 levels detected by western blot and cirExo‐TRPC5 levels detected by FCM (Fig. 2d).
Figure 1.
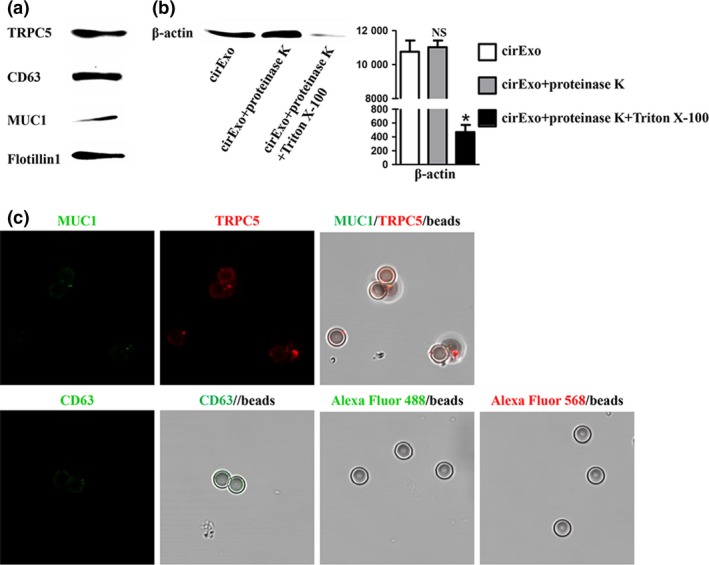
Adsorption of exosomes by the latex beads. Western blot (a) showed different levels of TRPC5, CD63 and MUC1 protein in peripheral blood of representative metastatic breast cancer patients. Western blot (b) showed different β‐actin protein levels in exosomes in cirExo treated with proteinase K alone or combined with Triton X‐100. NS, no significant versus cirExo; *P < 0.05 versus cirExo. Immunofluorescent staining (c) showed different fluorescence intensity when detecting CD63, MUC1 and TRPC5 in exosomes from plasma, while no fluorescence was observed in the absence of exosomes or primary antibodies.
Figure 2.
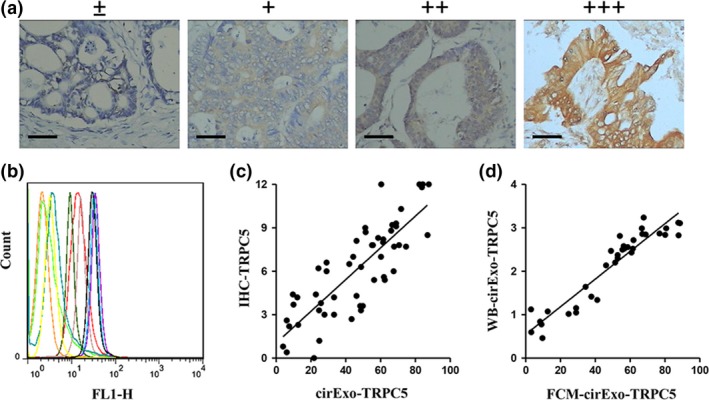
CirExo‐TRPC5 level was correlated with TRPC5 expression level in breast cancer tissues. Representative images from immunohistochemical staining (a) of TRPC5 expression in human breast cancer tissues (scale bars, 100 μM). Flow cytometry (b) showed different cirExo‐TRPC5 levels in plasma from different breast cancer patients. (c) Pearson correlation analysis showed that TRPC5 expression levels in breast cancer tissues were positively correlated to cirExo‐TRPC5 levels (P < 0.001). (d) cirExo‐TRPC5 levels detected by western blot (flotillin1 as the internal reference) (WB‐cirExo‐TRPC5) were significantly positively correlated to cirExo‐TRPC5 levels detected by FCM (FCM‐cirExo‐TRPC5) (P < 0.05).
CirExo‐TRPC5 level before chemotherapy (initial cirExo‐TRPC5 level) was significantly correlated with tumor response
We next explored the relationship between cirExo‐TRPC5 levels and chemotherapy outcome. FCM showed that the mean of TRPC5 immunofluorescence in latex beads in the 131 breast cancer patients before chemotherapy ranged from 3.1 to 88.6 (median 45.7). Less than 45.7 was defined as low level while more was defined as high level. Table 2 shows the correlation between cirExo‐TRPC5 levels and breast cancer patients’ characteristics. The cirExo‐TRPC5 level before chemotherapy was significantly negatively correlated with chemotherapy outcome, and the cirExo‐TRPC5 levels from responders were significantly lower than the level from non‐responders. The median of cirExo‐TRPC5 levels in responders and non‐responders was 38.5 and 56.6, respectively (Fig. 3a). Further Pearson correlation analysis showed that initial cirExo‐TRPC5 levels were significantly negatively correlated with tumor shrinkage ratio (Fig. 3b), which was defined as the ratio of the post‐chemotherapy tumor diameter divided by pre‐chemotherapy tumor diameter.
Table 2.
Characteristics of breast cancer patients according to cirExo‐TRPC5 level
| Characteristic | cirExo‐TRPC5 level | ||
|---|---|---|---|
| Low (N = 65) | High (N = 66) | P # | |
| Age(years) | |||
| ≤60 | 29 | 28 | 0.80 |
| >60 | 36 | 38 | |
| Sex | |||
| Female | 65 | 66 | NA |
| Histology | |||
| Ductal | 65 | 66 | NA |
| Tumor grade | |||
| Well or moderately | 31 | 32 | 0.93 |
| Poorly | 34 | 34 | |
| ER/PR status | |||
| Positive | 39 | 38 | 0.78 |
| Negetaive | 26 | 28 | |
| HER‐2 status | |||
| Positive | 29 | 24 | 0.34 |
| Negetaive | 36 | 42 | |
| Ki‐67 score | |||
| <14% | 12 | 11 | 0.79 |
| ≥14% | 53 | 55 | |
| Chemotherapy | |||
| Anthracycline | 30 | 25 | 0.13 |
| Taxane | 16 | 27 | |
| Anthracycline/t axane | 19 | 14 | |
| Outcome of chemotherapy* | |||
| CR/PR | 42 | 27 | <0.01 |
| SD/PD | 23 | 39 | |
*Outcome of first‐line chemotherapy in 131 breast patients was classified according to the Response Evaluation Criteria in Solid Tumours 1.1 (RECIST 1.1) categories (complete response (CR), partial response (PR), stable disease (SD), progressive disease (PD)).#P < 0.05 by the chi‐squared test. ER, estradiol receptor; PR, progesterone receptor; HER‐2, human epidermal growth factor receptor‐2.
Figure 3.
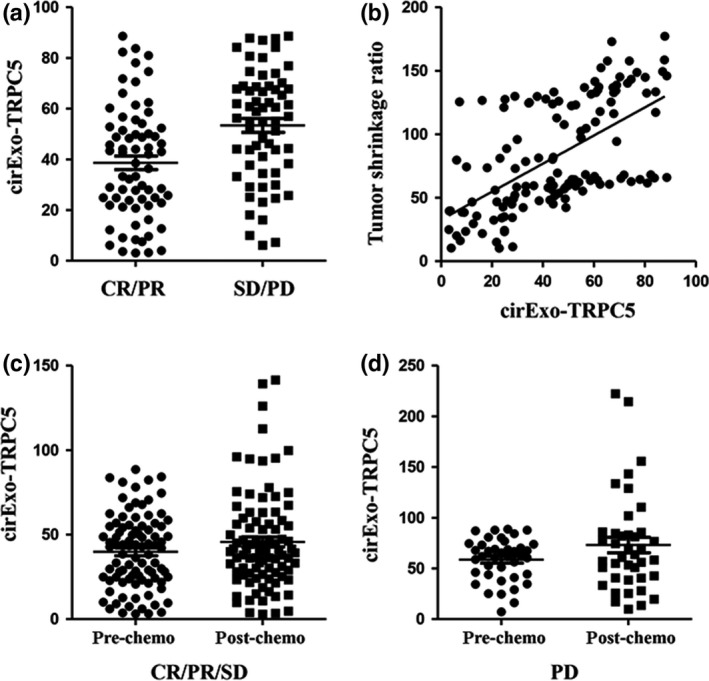
Initial cirExo‐TRPC5 level (cirExo‐TRPC5 level before chemotherapy) was significantly correlated with tumor response. (a) Median mean of cirExo‐TRPC5 levels in responders was significantly lower than in non‐responders (P < 0.05). (b) Pearson correlation analysis showed that initial cirExo‐TRPC5 levels were significantly negatively correlated with the tumor shrinkage ratio (P < 0.05). Student's t‐test showed no significant change of cirExo‐TRPC5 level after chemotherapy in the 91 patients who achieved complete response (CR)/partial response (PR)/stable disease (SD) (P = 0.47) (c) and in the 40 patients who achieved progressive disease (PD) (P = 0.41) (d).
Increased cirExo‐TRPC5 level after chemotherapy predicted acquired chemoresistance
Cancer bulk is usually difficult to access inside the body, while exosomes can easily be harvested in peripheral blood. Because exosomes contain many molecular features of the donor cancer cells, cancer bulk characteristics can be evaluated through examining the circulating exosomes. We next explored the dynamic change of cirExo‐TRPC5 levels in the peripheral blood of each patient during first‐line chemotherapy. No significant change of cirExo‐TRPC5 level was observed in the 40 patients who achieved PD (P = 0.41) and in the 91 patients who achieved CR/PR/SD (P = 0.47) after the first two cycles of chemotherapy (Fig. 3c,d). Among the 91 patients who achieved CR/PR/SD after the first two chemotherapy cycles, cirExo‐TRPC5 levels decreased in 37 patients and increased in 53 patients, while no change was observed in 1 patient after two chemotherapy cycles, as shown by FCM. Table 3 shows the different ratios of the cirExo‐TRPC5 levels after two chemotherapy cycles divided by the cirExo‐TRPC5 levels before chemotherapy. The ratios ranged from 0.57 to 6.22. Results of the ratios’ cut‐off values for PFS are listed in Table 3 and 1.09 was selected as the appropriate cut‐off value. Among the 91 patients who achieved CR/PR/SD after the first two chemotherapy cycles, patients with a cirExo‐TRPC5 increase of more than 1.09 times (n = 36) showed a median PFS of 4 months, while patients with a cirExo‐TRPC5 increase of not more than 1.09 times (n = 55) showed a median PFS of 10 months (P = 0.0042) (Fig. 4). Univariate analysis showed that none of the other factors (age, sex, tumor grade, ER/PR status, HER2 status and Ki‐67 score) were significantly associated with PFS. Consecutive detection of the latter 55 patients showed that the cirExo‐TRPC5 level increased prior to PD in 29 patients (the interval ranged from 2 to 12 months [median 4 months]), while it did not increase in only 5 patients who achieve PD and 12 patients who remained with no PD until flow‐up termination.
Table 3.
Cutoff values of TrpC5 score change ratio in circulating exosomes according to PFS
| Cutoff value of TrpC5 score change ratio | Wald | Sig. | HR(95.0% CI) |
|---|---|---|---|
| 0.57 | 0.562 | 0.454 | 2.127 (0.295–15.317) |
| 0.58 | 0.076 | 0.783 | 1.219 (0.299–4.969) |
| 0.59 | 0.006 | 0.939 | 1.036 (0.418–2.568) |
| 0.60 | 0.05 | 0.824 | 0.909 (0.395–2.096) |
| 0.63 | 0.028 | 0.867 | 0.936 (0.429–2.039) |
| 0.64 | 0.137 | 0.712 | 0.877 (0.436–1.762) |
| 0.66 | 0.621 | 0.431 | 1.307 (0.671–2.545) |
| 0.68 | 0.621 | 0.431 | 1.282 (0.691–2.378) |
| 0.71 | 0.771 | 0.38 | 1.308 (0.719–2.38) |
| 0.72 | 0.469 | 0.493 | 1.225 (0.685–2.191) |
| 0.73 | 0.245 | 0.621 | 1.154 (0.655–2.031) |
| 0.75 | 0.176 | 0.675 | 1.125 (0.648–1.955) |
| 0.82 | 0.055 | 0.814 | 1.067 (0.622–1.831) |
| 0.84 | 0.013 | 0.909 | 1.031 (0.608–1.751) |
| 0.86 | 0.019 | 0.891 | 1.037 (0.617–1.744) |
| 0.87 | 0.002 | 0.969 | 0.99 (0.594–1.65) |
| 0.88 | 0.61 | 0.435 | 1.219 (0.742–2.003) |
| 0.91 | 0.445 | 0.505 | 1.177 (0.729–1.902) |
| 0.92 | 0.358 | 0.549 | 1.155 (0.721–1.849) |
| 0.93 | 0.243 | 0.622 | 1.125 (0.705–1.794) |
| 0.94 | 0.716 | 0.397 | 1.224 (0.767–1.952) |
| 0.95 | 0.55 | 0.458 | 1.192 (0.75–1.895) |
| 0.96 | 0.465 | 0.495 | 1.174 (0.74–1.861) |
| 0.97 | 0.335 | 0.563 | 1.145 (0.724–1.811) |
| 1.00 | 0.179 | 0.672 | 1.103 (0.699–1.741) |
| 1.01 | 0.503 | 0.478 | 1.178 (0.749–1.851) |
| 1.02 | 1.129 | 0.288 | 1.278 (0.813–2.01) |
| 1.04 | 1.738 | 0.187 | 1.356 (0.862–2.131) |
| 1.05 | 4.194 | 0.041 | 1.608 (1.021–2.533) |
| 1.06 | 3.59 | 0.058 | 1.55 (0.985–2.44) |
| 1.07 | 3.716 | 0.054 | 1.562 (0.993–2.458) |
| 1.08 | 4.336 | 0.037 | 1.626 (1.029–2.568) |
| 1.09 | 5.76 | 0.016 | 1.757 (1.109–2.783) |
| 1.10 | 4.433 | 0.035 | 1.649 (1.035–2.626) |
| 1.12 | 3.778 | 0.052 | 1.59 (0.996–2.538) |
| 1.15 | 2.788 | 0.095 | 1.502 (0.932–2.422) |
| 1.36 | 2.256 | 0.133 | 1.447 (0.894–2.342) |
| 1.39 | 1.51 | 0.219 | 1.361 (0.832–2.226) |
| 1.40 | 1.115 | 0.291 | 1.307 (0.795–2.15) |
| 1.44 | 1.221 | 0.269 | 1.33 (0.802–2.203) |
| 1.46 | 2.492 | 0.114 | 1.504 (0.906–2.495) |
| 1.51 | 1.957 | 0.162 | 1.443 (0.863–2.411) |
| 1.55 | 3.656 | 0.056 | 1.653 (0.987–2.768) |
| 1.56 | 2.989 | 0.084 | 1.586 (0.94–2.677) |
| 1.63 | 2.638 | 0.104 | 1.555 (0.913–2.648) |
| 1.69 | 2.057 | 0.152 | 1.487 (0.865–2.558) |
| 1.70 | 1.539 | 0.215 | 1.42 (0.816–2.47) |
| 1.79 | 1.087 | 0.297 | 1.352 (0.767–2.382) |
| 1.90 | 0.85 | 0.357 | 1.315 (0.735–2.352) |
| 1.94 | 0.51 | 0.475 | 1.244 (0.684–2.262) |
| 1.97 | 0.251 | 0.617 | 1.171 (0.631–2.172) |
| 2.00 | 0.201 | 0.654 | 1.164 (0.598–2.266) |
| 2.05 | 0.045 | 0.833 | 1.078 (0.537–2.163) |
| 2.07 | 0.709 | 0.4 | 1.349 (1–0.568) |
| 2.42 | 0.346 | 0.556 | 1.247 (0.598–2.597) |
| 2.45 | 0.104 | 0.747 | 1.137 (0.522–2.478) |
| 2.58 | 0.31 | 0.578 | 1.268 (0.55–2.924) |
| 2.67 | 0.457 | 0.499 | 1.368 (0.552–3.391) |
| 2.84 | 1.247 | 0.264 | 1.781 (0.647–4.905) |
| 3.43 | 0.532 | 0.466 | 1.539 (0.483–4.903) |
| 4.34 | 0.075 | 0.784 | 1.217 (0.298–4.977) |
| 5.17 | 0.008 | 0.929 | 0.914 (0.127–6.597) |
HR, hazard ratio; CI, confidence interval.
Figure 4.
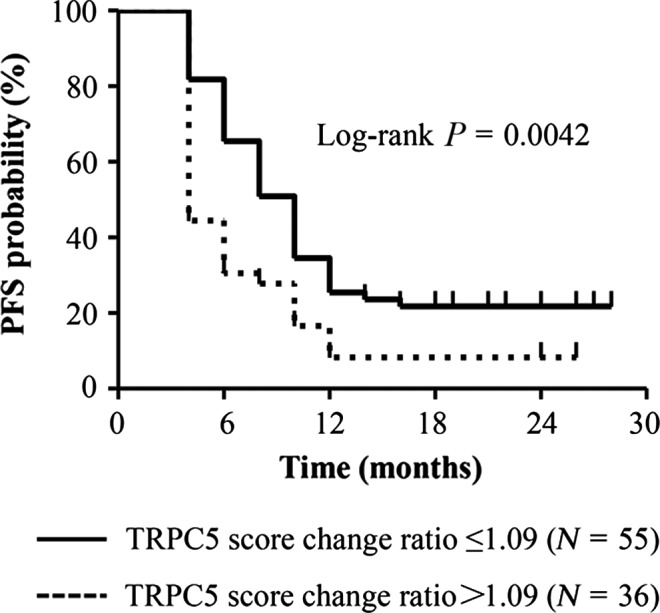
Increased cirExo‐TRPC5 level after chemotherapy predicted acquired chemoresistance. Metastatic breast cancer patients with a cirExo‐TRPC5 increase of more than 1.09 times (n = 36) after the first 2 chemotherapy cycles showed a significantly shorter progression free survival than patients with a cirExo‐TRPC5 increase of not more than 1.09 times (n = 55) (log‐rank, P = 0.0042).
Discussion
Chemoresistance is believed to cause treatment failure in >90% of patients with metastatic cancer.16 Predicting chemoresistance before chemotherapy may avoid unnecessary chemotherapy and save medical resources. Hence, the identification of chemoresistance biomarkers is of utmost importance to pursue this target, which reflects the aim of this study. The detailed chemoresistance mechanism at a cellular level has already been elucidated,16 while little is known regarding chemoresistance prediction in clinical chemotherapy.17, 18
The most frequent approach used in clinical studies has been to analyze the correlation between the chemoresistance‐related gene/protein expression level in tumor tissue and chemotherapy outcomes. The critical point is that tumor cells in a tumor mass are heterogeneous.19, 20 In addition, studies have identified a dynamic alteration of key genes expression in tumor cells,21 probably leading to the failure of chemoresistance prediction by single biopsy in clinical chemotherapy. Thus, a more appropriate method may be consecutive biopsies before each chemotherapy treatment to dynamically detect molecular change in cancer cells. However, such a method is not feasible in most cases as malignant lesions are often difficult to access, such as in the brain, liver or lung.
The analysis of EV released from viable cells might abolish the above difficulties and make possible the evaluation of chemoresistance before chemotherapy is undertaken. Studies have demonstrated that EV can be secreted constitutively22 and contain numerous tumor‐specific molecules mirroring the donor cancer cells,23, 24, 25, 26, 27 including chemoresistance‐related proteins.4, 28, 29 This property makes EV the ideal molecular biomarker mirror of the malignant lesions difficult to access. EV can be divided into three main classes: exosomes, microvescicles and apoptotic bodies. Among them, exosomes have recently received most of the attention.
In this study, cirExo‐TRPC5 level was significantly and positively related with TRPC5 protein level in cancer tissues in advanced breast cancer patients before chemotherapy, suggesting that exosomes might act as the rational mirror of this malignant lesion.
Our previous study found that low TRPC5 expression is specific for chemosensitive breast cancer cells, while elevated TRPC5 expression was essential for acquired chemoresistant.3 This result indicated the importance of real‐time monitoring of chemoresistance by examining TRPC5 expression in patients’ breast cancer cells. Furthermore, circulating EV‐containing TRPC5 was released from chemoresistant breast cancer cells and could enter into chemosensitive breast cancer cells, resulting in a switch to chemoresistance.4 These results not only demonstrated a novel chemoresistance mechanism, but also indicated that different cirExo‐TRPC5 levels might represent a critical difference between chemoresistant and chemosensitive breast cancer cells. In contrast to chemosensitive breast cancer cells, high cirExo‐TRPC5 level should be the rational mirror of the chemoresistant breast cancer cells. In addition, in accordance with our previous study,4 cirExo‐TRPC5 was found in peripheral blood of breast cancer patients in this study, indicating that cirExo‐TRPC5 might be a promising chemoresistance marker for breast cancer patients.
Exosomes are not detectable by clinical routine examination through FCM (500‐nm diameter) due to their small size (50–150‐nm diameter). In this study, aldehyde/sulfate latex beads (3‐μm diameter) were used to adsorb the exosomes as previously described,13 and we validated the existence of exosomes attached to the beads.
We next explored whether cirExo‐TRPC5 levels were related to tumor response to chemotherapy. As similar results were found in numerous studies regarding other chemoresistance‐related molecules,4 a χ2‐test showed significantly positive correlation between initial exosome‐carrying TRPC5 level and tumor response, while survival analysis showed that no cut‐off value of initial cirExo‐TRPC5 level could predict PD in patients who achieved CR/PR/SD after the first two chemotherapy cycles (data not shown).
In theory, as a potential chemoresistance marker, the cirExo‐TRPC5 level was dependent on the amount of the chemoresistant cancer cells, while the chemoresistant tumor burden was different in each patient. This might represent an explanation for the inconsistence between initial cirExo‐TRPC5 level and tumor response to chemotherapy in a certain number of patients and the failure for cirExo‐TRPC5 level in predicting PFS.
The easy accessibility of circulating exosomes allowed us to undertake real‐time monitoring of cirExo‐TRPC5. As a result, our data indicated the feasibility of predicting chemoresistance through examining cirExo‐TRPC5.
As exosomes could be released from a variety of cells, and no biomarker can be used to diagnose malignant tumors, the inevitable consequence was the involvement of exosomes from non‐malignant cells. We enrolled patients with serum MUC1 levels >10 ng/mL to use MUC1 for exosomes screening. In this way, exosomes from non‐malignant cells could be avoided as much as possible.
The definition of an ideal chemoresistance marker should include an appropriate cut‐off value, which could discriminate the chemoresistance among all breast cancer patients. As mentioned above, the quantity of released exosomes depends on different factors, including tumor burden and exterior pressure, which are completely different in each patient. Although the plausible cut‐off value of the initial cirExo‐TRPC5 level was identified to predict tumor response in this study, we did not validate its value in predicting PFS.
The current chemoresistance evaluation was based on imaging examination, such as CT and magnetic resonance imaging. However, chemoresistance could be not evaluated before the increase of the target. Hysteresis indicates patients receiving inefficient and unnecessary final chemotherapy cycles and the consequent waste of medical resources would delay the appropriate therapy. In addition, the increase of target lesions suggests not only chemoresistance, but other phenomena, including higher growth rate than death rate induced by chemotherapy and heterogeneous response to chemotherapy. Under these circumstances, switching to a wholly new chemotherapy regimen might not be suitable despite no better choice being currently available.
The main purpose of this study was describing a method to predict molecular chemoresistance. Our results indicated that circulating exosomes might serve to evaluate chemoresistance based on imaging examination.
Disclosure Statement
The authors have no conflict of interest to declare.
Acknowledgments
This work was supported by the Jiangsu Province Clinical Medical Science and Technology Specialized Research Fund (No. BL2014019); the Key Program from Wuxi Health Bureau (No. Z201401); the National Natural Science Foundation of China (No. 81541156); the Natural Science Foundation of Jiangsu Province of China (No. BK20150162; NO. BK2012101); the Scientific and Technological Development Fund from Wuxi Science and Technology Bureau (No. CSE31N1419); and the Key Program from Wuxi Hospital Management Center (No.YGZXG1406).
Cancer Sci 108 (2017) 448–454
Funding Information
Jiangsu Province Clinical Medical Science and Technology Specialized Research Fund, (Grant / Award Number: ‘BL2014019‘) Natural Science Foundation of Jiangsu Province of China, (Grant / Award Number: ‘BK20150162‘) Key Program from Wuxi Science and Technology Bureau, (Grant / Award Number: ‘Z201401‘) Key Program from Wuxi Hospital Management Center , (Grant / Award Number: ‘YGZXG1406‘) Scientific and Technological Development Fund from Wuxi Science and Technology Bureau , (Grant / Award Number: ‘CSE31N1419‘) National Natural Science Foundation of China, (Grant / Award Number: ‘81541156‘).
References
- 1. Haggar FA, Boushey RP. Colorectal cancer epidemiology: Incidence, mortality, survival, and risk factors. Clin Colon Rectal Surg 2009; 22: 191–7. [DOI] [PMC free article] [PubMed] [Google Scholar]
- 2. Chen W, Zheng R, Baade PD et al Cancer statistics in China, 2015. CA Cancer J Clin 2016; 66: 115–32. [DOI] [PubMed] [Google Scholar]
- 3. Ma X, Cai Y, He D et al Transient receptor potential channel TRPC5 is essential for P‐glycoprotein induction in drug‐resistant cancer cells. Proc Nat Acad Sci USA 2012; 109: 16282–7. [DOI] [PMC free article] [PubMed] [Google Scholar]
- 4. Ma X, Chen Z, Hua D et al Essential role for TrpC5‐containing extracellular vesicles in breast cancer with chemotherapeutic resistance. Proc Nat Acad Sci USA 2014; 111: 6389–94. [DOI] [PMC free article] [PubMed] [Google Scholar]
- 5. Pan BT, Teng K, Wu C, Adam M, Johnstone RM. Electron microscopic evidence for externalization of the transferrin receptor in vesicular form in sheep reticulocytes. J Cell Biol 1985; 101: 942–8. [DOI] [PMC free article] [PubMed] [Google Scholar]
- 6. Mathivanan S, Lim JW, Tauro BJ, Ji H, Moritz RL, Simpson RJ. Proteomics analysis of A33 immunoaffinity‐purified exosomes released from the human colon tumor cell line LIM1215 reveals a tissue‐specific protein signature. Mol Cell Proteomics 2010; 9: 197–208. [DOI] [PMC free article] [PubMed] [Google Scholar]
- 7. Corrado C, Raimondo S, Chiesi A, Ciccia F, De Leo G, Alessandro R. Exosomes as intercellular signaling organelles involved in health and disease: Basic science and clinical applications. Int J Mol Sci 2013; 14: 5338–66. [DOI] [PMC free article] [PubMed] [Google Scholar]
- 8. Cho JA, Yeo DJ, Son HY et al Exosomes: A new delivery system for tumor antigens in cancer immunotherapy. Int J Cancer 2005; 114: 613–22. [DOI] [PubMed] [Google Scholar]
- 9. Staubach S, Razawi H, Hanisch FG. Proteomics of MUC1‐containing lipid rafts from plasma membranes and exosomes of human breast carcinoma cells MCF‐7. Proteomic 2009; 9: 2820–35. [DOI] [PubMed] [Google Scholar]
- 10. Gion M, Mione R, Leon AE, Dittadi R. Comparison of the diagnostic accuracy of CA27.29 and CA15.3 in primary breast cancer. Clin Chem 1999; 45: 630–7. [PubMed] [Google Scholar]
- 11. Eisenhauer EA, Therasse P, Bogaerts J et al New response evaluation criteria in solid tumours: revised RECIST guideline (version 1.1). Eur J Cancer 2009; 45: 228–47. [DOI] [PubMed] [Google Scholar]
- 12. Kahlert C, Melo SA, Protopopov A et al Identification of double‐stranded genomic DNA spanning all chromosomes with mutated KRAS and p53 DNA in the serum exosomes of patients with pancreatic cancer. J Biol Chem 2014; 289: 3869–75. [DOI] [PMC free article] [PubMed] [Google Scholar]
- 13. Melo SA, Luecke LB, Kahlert C et al Glypican‐1 identifies cancer exosomes and detects early pancreatic cancer. Nature 2015; 523: 177–82. [DOI] [PMC free article] [PubMed] [Google Scholar]
- 14. Koo CL, Kok LF, Lee MY et al Scoring mechanisms of p16INK4a immunohistochemistry based on either independent nucleic stain or mixed cytoplasmic with nucleic expression can significantly signal to distinguish between endocervical and endometrial adenocarcinomas in a tissue microarray study. J Trans Med 2009; 7: 25. [DOI] [PMC free article] [PubMed] [Google Scholar]
- 15. Thery C, Amigorena S, Raposo G, Clayton A. Isolation and characterization of exosomes from cell culture supernatants and biological fluids. Curr Protoc Cell Biol 2006; Chapter 3: Unit 3.22. [DOI] [PubMed] [Google Scholar]
- 16. Longley DB, Johnston PG. Molecular mechanisms of drug resistance. J Pathol 2005; 205: 275–92. [DOI] [PubMed] [Google Scholar]
- 17. Edelman MJ, Schneider CP, Tsai CM et al Randomized phase II study of ixabepilone or paclitaxel plus carboplatin in patients with non‐small‐cell lung cancer prospectively stratified by beta‐3 tubulin status. J Clin Oncol 2013; 31: 1990–6. [DOI] [PubMed] [Google Scholar]
- 18. Wislez M, Barlesi F, Besse B et al Customized adjuvant phase II trial in patients with non‐small‐cell lung cancer: IFCT‐0801 TASTE. J Clin Oncol 2014; 32: 1256–61. [DOI] [PubMed] [Google Scholar]
- 19. Ellsworth RE, Blackburn HL, Shriver CD, Soon‐Shiong P, Ellsworth DL. Molecular heterogeneity in breast cancer: State of the science and implications for patient care. Semin Cell Dev Biol 2016; doi: 10.1016/j.semcdb.2016.08.025 [DOI] [PubMed] [Google Scholar]
- 20. Beca F, Polyak K. Intratumor heterogeneity in breast cancer. Adv Exp Med Biol 2016; 882: 169–89. [DOI] [PubMed] [Google Scholar]
- 21. Jordan NV, Bardia A, Wittner BS et al HER2 expression identifies dynamic functional states within circulating breast cancer cells. Nature 2016; 537: 102–6. [DOI] [PMC free article] [PubMed] [Google Scholar]
- 22. Zhang HG, Grizzle WE. Exosomes and cancer: A newly described pathway of immune suppression. Clin Cancer Res 2011; 17: 959–64. [DOI] [PMC free article] [PubMed] [Google Scholar]
- 23. Ratajczak J, Wysoczynski M, Hayek F, Janowska‐Wieczorek A, Ratajczak MZ. Membrane‐derived microvesicles: Important and underappreciated mediators of cell‐to‐cell communication. Leukemia 2006; 20: 1487–95. [DOI] [PubMed] [Google Scholar]
- 24. Pap E. The role of microvesicles in malignancies. Adv Exp Med Biol 2011; 714: 183–99. [DOI] [PubMed] [Google Scholar]
- 25. Saleem SN, Abdel‐Mageed AB. Tumor‐derived exosomes in oncogenic reprogramming and cancer progression. Cell Mol Life Sci 2015; 72: 1–10. [DOI] [PMC free article] [PubMed] [Google Scholar]
- 26. Raposo G, Stoorvogel W. Extracellular vesicles: Exosomes, microvesicles, and friends. J Cell Biol 2013; 200: 373–83. [DOI] [PMC free article] [PubMed] [Google Scholar]
- 27. van der Pol E, Boing AN, Harrison P, Sturk A, Nieuwland R. Classification, functions, and clinical relevance of extracellular vesicles. Pharmacol Rev 2012; 64: 676–705. [DOI] [PubMed] [Google Scholar]
- 28. Bebawy M, Combes V, Lee E et al Membrane microparticles mediate transfer of P‐glycoprotein to drug sensitive cancer cells. Leukemia 2009; 23: 1643–9. [DOI] [PubMed] [Google Scholar]
- 29. Pasquier J, Magal P, Boulange‐Lecomte C, Webb G, Le Foll F. Consequences of cell‐to‐cell P‐glycoprotein transfer on acquired multidrug resistance in breast cancer: A cell population dynamics model. Biol Direct 2011; 6: 5. [DOI] [PMC free article] [PubMed] [Google Scholar]