Abstract
FK506 binding protein 51 (FKBP51), a member of the immunophilin family, is involved in multiple signaling pathways, tumorigenesis, and chemoresistance. FKBP51 expression correlates with metastatic potential in melanoma and prostate cancer. However, the functions of FKBP51, particularly involving the regulation of cell motility and invasion, are not fully understood. We discovered two novel interacting partner proteins of FKBP51, i.e., deleted in liver cancer 1 (DLC1) and deleted in liver cancer 2 (DLC2), using immunoprecipitation and mass spectrometry. DLC1 and DLC2 are Rho GTPase‐activating proteins that are frequently downregulated in various cancers. Next, we demonstrated that overexpression of FKBP51 enhances cell motility and invasion of U2OS cells via upregulation of RhoA activity and enhanced Rho‐ROCK signaling. Moreover, FKBP51‐depleted cells displayed a cortical distribution of actin filaments and decreased cell motility and invasion. Consistent with this phenotype, FKBP51 depletion caused a downregulation of RhoA activity. Considered together, our results demonstrate that FKBP51 positively controls cell motility by promoting RhoA and ROCK activation; thus, we have revealed a novel role for FKBP51 in cytoskeletal rearrangement and cell migration and invasion.
Keywords: Deleted in liver cancer 1, deleted in liver cancer 2, FKBP51, RhoA, ROCK
The FK506 binding protein FKBP51 (also referred as FKBP5) is highly expressed in prostate cancer, lymphoma, and melanoma; furthermore, FKBP51 expression correlates with metastatic potential in melanoma and prostate cancer, and its silencing restores resistance to apoptosis in these two cancers.1, 2, 3, 4, 5, 6, 7 FKBP51 promotes melanoma growth by modulating TGF‐β expression and activating NF‐κB, which induces interleukin‐8 (IL‐8).3, 4, 5 Moreover, FKBP51 acts as an anti‐apoptotic factor in cancer development and progression by enhancing the telomerase activity of hTERT.6 FKBP51 controls androgen‐dependent growth of prostate cancer by enhancing activity of androgen receptor transcription.8, 9, 10 By contrast, some reports have shown that FKBP51 functions as a tumor suppressor.11, 12 The expression of FKBP51 is downregulated in pancreatic and colon cancer. FKBP51 and PH domain leucine‐rich repeat protein phosphatase (PHLPP) influence the kinase activity of Akt by acting as a scaffold complex that promotes the dephosphorylation of Akt.11 FKBP51 knockdown in a xenograft mouse model that produced a significant increase in tumor burden when compared with wild type mice.12 Thus, both the overexpression and downregulation of FKBP51 have been detected in several human cancers.
FKBP51 is also an immunophilin co‐chaperone for the heat shock protein 90 (Hsp90) molecular chaperone machine and has been identified as an important component of steroid hormone receptor‐Hsp90 heterocomplexes.13, 14, 15 FKBP51 is a regulator of glucocorticoid and progesterone receptor signaling16, 17, 18 and was recently shown to interact with the androgen receptor (AR) and estrogen receptor (ER).19
This study explores a novel role for FKBP51. To this end, we attempted to identify new FKBP51 targeting proteins via a mass spectrometry analysis of anti‐FKBP51 immunoprecipitates from MCF7 cells. We identified deleted in liver cancer 1 (DLC1, also known as ARHGAP7 and STARD12) and deleted in liver cancer 2 (DLC2/ARHGAP37/STARD13), which are structurally similar and share the same functional domains (sterile α motif (SAM), Rho‐GAP, and START domains).20, 21, 22, 23 Both proteins are underexpressed in certain cancers, and they suppresses tumor cell growth by inhibiting RhoA activity via the Rho‐GAP domain.24, 25, 26, 27 Their Rho‐GAP activity strongly hydrolyzes Rho‐GTP, weakly hydrolyzes Cdc42‐GTP, and has no detectable activity against Rac‐GTP.28, 29 We determined that overexpression of FKBP51 increased the active GTP‐bound state of the RhoA protein. GTP‐RhoA has a critical role in cell motility and invasion via actin remodeling.30, 31 Consistent with our hypothesis, depletion of FKBP51 impaired RhoA activation and decreased cell motility and invasion via perturbation of cytoskeleton. Thus, we newly report that FKBP51 regulates RhoA activation via interactions with DLC proteins.
Materials and Methods
Cell culture
MCF7 cells were cultured in MEM supplemented with 10% FBS, 1% sodium pyruvate, 1% glutamine, and 0.1% insulin. U2OS and HEK293T cells were cultured in DMEM supplemented with 10% FBS. All cells were cultured at 37°C in a humidified chamber.
Antibodies and reagents
Mouse monoclonal anti‐FKBP51 antibody was obtained from Santa Cruz Biotechnology (Dallas, TX, USA). Rabbit polyclonal anti‐FKBP51, mouse monoclonal anti‐FLAG, and rabbit polyclonal anti‐StARD13 antibodies were obtained from Sigma‐Aldrich (St. Louis, MO, USA). Mouse monoclonal anti‐HALO antibody was obtained from Promega (Madison, WI, USA). Mouse monoclonal anti‐RhoA antibody was obtained from Cytoskeleton, Inc. (Denver, CO, USA). Mouse monoclonal anti‐cortactin antibody was obtained from Merck Millipore (Billerica, MA, USA). Rabbit polyclonal anti‐Smad2 and rabbit polyclonal anti‐Phospho‐Smad2 (Ser465/467) antibodies were obtained from Cell Signaling Technology (Danvers, MA, USA). Fluorescent secondary antibodies (Alexa Fluor 488) were obtained from Life Technologies (Carlsbad, CA, USA). To visualize the actin cytoskeleton, cells were stained with rhodamine phalloidin (Sigma‐Aldrich). Hoechst staining was used to detect nuclei.
Plasmid constructs
FKBP51 constructs were created by annealing double‐stranded oligonucleotides into the p3xflag‐myc‐cmv‐23‐24_expression_vector. The oligonucleotides 5′‐TGCGGCCGCGAATTCAATGACTACTGATGAAGGTGCC‐3′ and 5′‐ATCTATCGATGAATTCTACGTGGCCCTCAGGTTT‐3′ were annealed and ligated into the vector. The PCR product was inserted into the EcoRI site of p3xflag‐myc‐cmv‐23‐24. The plasmid was verified by DNA sequencing and protein expression, and plasmid sizes were confirmed by Western blot analysis. Halo‐RhoA was a Flexi Halo Tag clone from Kazusa Genome Technologies Inc. (Promega).
siRNA treatment
Cells were transfected in suspension with 20 nM ON‐TARGET plus non‐targeting siRNA, 20 nM FKBP51 siRNA duplex (Dharmacon, Lafayette, CO, USA), and Lipofectamine RNAiMAX (Invitrogen, Carlsbad, CA, USA) as described by the manufacturer.
Immunoprecipitation and Western blot analysis
Immunoprecipitation and Western blotting were performed as previously described.32 The following antibodies were used for immunoprecipitation: FKBP51 (sc‐271547; Santa Cruz Biotechnology), StARD13 (HPA035535; Sigma), and Halo (G9281; Promega). The following primary antibodies were used for immunoblotting: FKBP51 (ab126715; Abcam, Cambridge, UK and A301‐430A; Bethyl Laboratories, Inc., Montgomery, TX, USA), StARD13 (HPA035535; Sigma), Halo (G9281; Promega), and β‐actin (Sigma). Horseradish peroxidase‐conjugated secondary antibodies (Amersham Biosciences, Amersham, UK) were used to detect immunoreactive proteins by enhanced chemiluminescence (Thermo Scientific, Waltham, MA, USA).
Immunofluorescence microscopy
The cells were fixed with 3.7% formaldehyde in phosphate‐buffered saline (PBS) for 10 min on ice and permeabilized sequentially with 50%, 75%, and 95% ethanol on ice for 5 min each. The slides were blocked with a PBS‐containing blocking solution for 30 min at room temperature and then incubated with the primary antibodies, anti‐Cortactin and phalloidin‐Atto 565 (Sigma‐Aldrich) for 1 h at room temperature. Slides were then washed three times with PBS for 5 min each and incubated with an Alexa488 secondary antibody (Molecular Probes, Eugene, OR, USA) for 30 min at 37°C. After washing twice with PBS, DNA was stained with 1 μg/mL of bisbenzimide (Hoechst 33258) in the final PBS wash. The samples were examined using a TCS SP8 and AF6000 confocal microscope (Leica Microsystems, Wetzlar, Germany).
Mass spectrometry
MS was performed via LC‐MS/MS (QTRAP 5500 system). Peak lists for the protein database searches (ProteinPilot; Applied Biosystems, Carlsbad, CA, USA) were extracted from the resulting data. The peptide enrichment ratio was calculated to evaluate the certainty of peptide identification.
Wound‐healing assay
Confluent cell monolayers were wounded (lightly scratched) with a pipet tip. After careful washing to remove detached cells, the cells were cultured for 24 h. Phase‐contrast images were taken every 30 min for 24 h. The width of the wound was monitored using an FW4000‐TZ time‐lapse microscope (Leica Microsystems). For the ROCK inhibitor (Y27632) assay, cells were treated with the inhibitor (50 μM) for 24 h and then wounded. Phase‐contrast images were taken immediately after scratching (0 h) and 5 h later.
Cell invasion assays
Cell invasion assays were conducted with a CytoSelect 96‐well cell invasion assay kit according to the manufacturer's protocol. A total of 1.5 × 10⁵ cells in serum‐free medium were harvested from a 96‐well cell invasion plate from the basement membrane layer. The plate was then placed in an incubator at 37°C in 5% CO2 for 24 h. Next, the membrane chamber was transferred to the Cell Harvesting Tray containing a cell detachment solution. The invasion cells were stained with a CyQuant GR dye solution, and absorbance at 480/520 nm was measured with a microplate reader.
RhoA activation assay
RhoA activation was assessed with a Rho Activation Assay Biochem Kit according to the manufacturer's protocol. Full‐length FLAG‐FKBP51 and RhoA‐Halo proteins were expressed in 293T cells. GTP‐RhoA was isolated from cell extracts using glutathione‐sepharose beads coated with a rhotekin Rho binding domain (RBD) expressed as a GST fusion. An equal volume of cell lysate was incubated with Rhotekin‐RBD Protein Beads at 4°C for 1 h. Next, the beads were rinsed with wash buffer. The samples were eluted and subjected to Western blotting with anti‐RhoA.
ROCK activity assay
U2OS cells were transfected with FLAG‐FKBP51 or mock (FLAG) vector in medium with 10% FBS for 48 h at 37°C and 5% CO2. After PBS washes, the cells were suspended in a sonication buffer (50 mM Tris–HCl, pH 8.0, 1 mM ethylenediaminetetraacetic acid [EDTA], 1 mM EGTA) containing protease inhibitors (Sigma‐Aldrich). The samples were then processed with sonication for 15 s followed by centrifugation (14 000 g for 30 min) to obtain cell extract. The protein content was determined using a protein assay kit (Bio‐Rad Laboratories, Hercules, CA, USA). The crude extracts were applied to a HiTrap Q HP column (GE Healthcare Life Science, Buckinghamshire, UK) that was equilibrated with Q‐buffer (20 mM Tris–HCl, pH 8.0, 0.5 mM EDTA, 1 mM EGTA, 5 mM beta‐glycerophosphate, 2 mM NaF, 2 mM Na3VO4, 5 mM beta‐mercaptoethanol) containing 50 mM NaCl. The protein was eluted with a linear gradient of NaCl (0.05–0.6 M) in Q‐buffer. The collected 1‐mL fractions were then washed with Q‐buffer. ROCK protein in fractions were detected with immunoblotting using an anti‐ROCK1 antibody. ROCK activity was measured using the fraction containing ROCK1 with a Cyclex Rho‐kinase Assay Kit (MBL, Nagoya, Japan) according to the manufacturer's protocol. The inhibitory effect of the ROCK inhibitor on ROCK activity was evaluated with the direct addition of Y27632 (10 μM) to the ROCK1 fraction. The kinase activity in the vehicle control was defined as 1 (n = 3).
Statistical analysis
A Student's t‐test was used to evaluate the data from the proliferation, migration, and invasion assays. P‐values of <0.05 were considered statistically significant. All statistical analyses were performed using spss software (IBM, Armonk, NY, USA).
Results
Analysis of FKBP51‐binding proteins using mass spectrometry
To identify new FKBP51‐binding partners, we subjected lysates prepared from MCF7 cells to immunoprecipitation with an anti‐FKBP51 antibody. Immunoprecipitated protein complexes were subjected to SDS‐PAGE and analyzed by CBB staining (Fig. 1a). Bands distinct from the control were cut and digested with trypsin and then analyzed by tandem mass spectroscopy LC/MS/MS (QTRAP 5500 system). Analysis of the tryptic peptides revealed the presence of DLC1 (ARHGAP7/STARD12), DLC2 (ARHGAP37/STARD13), the glucocorticoid and progesterone receptors, and Hsp90 proteins, including FKBP51 (Fig. 1b and Fig. S1a). These proteins were not detected in the samples immunoprecipitated with normal rabbit IgG. The glucocorticoid receptor, progesterone receptor, and Hsp90 are known to interact with FKBP51, which functions as a co‐chaperone with Hsp90 for glucocorticoid and progesterone receptors. The immunoprecipitation of MCF7 cell lysates using the anti‐DLC2 antibody detected the FKBP51 protein (Fig. 1c). DLC1 and 2 show GAP activity that specifically inhibits RhoA function. The Rho‐GAP domain is highly conserved between DLC1 (residues 1078‐1284) and DLC2 (residues 663‐867) (Fig. S1b). These results suggest that both DLC proteins, which exhibit high homology in their GAP domains, are novel FKBP51‐associated proteins.
Figure 1.
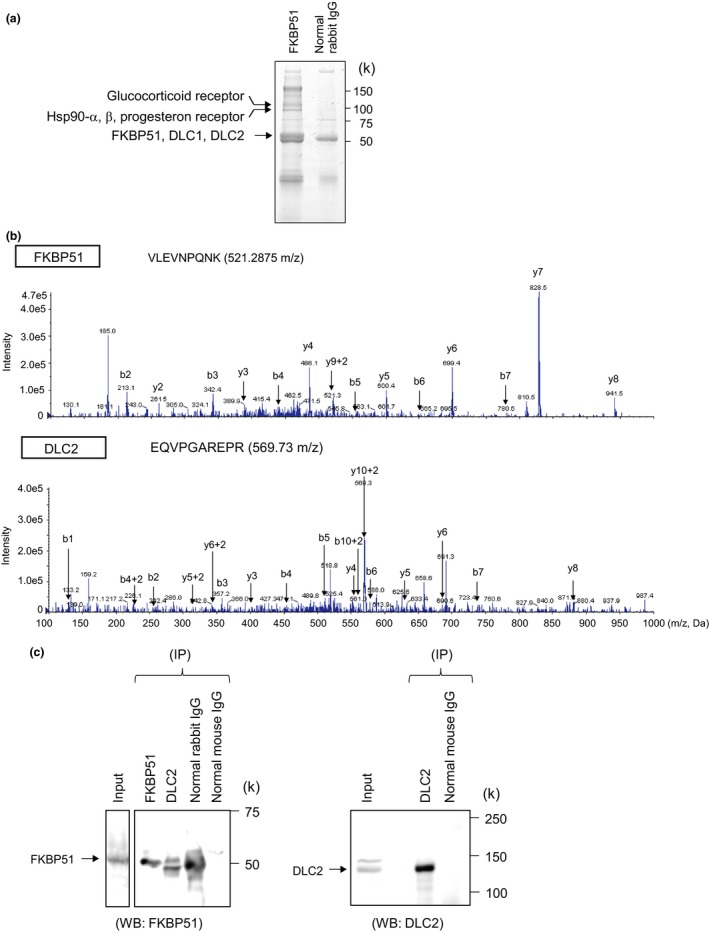
Identification of FKBP51‐interacting proteins. (a) MCF7 cell lysates were immunoprecipitated with normal rabbit IgG or anti‐FKBP51 antibody. The immunoprecipitates were subjected to SDS‐PAGE and visualized by CBB staining. The protein bands specific to FKBP51 were analyzed with LC/MS/MS. In addition to FKBP51, other proteins were identified. (b) MS/MS product ion spectra obtained by nanoflow LC/MS/MS of immunoprecipitated protein complexes from MCF7 cells using an anti‐FKBP51 antibody. (c) MCF7 cell lysates were immunoprecipitated (IP) with rabbit IgG, mouse IgG, anti‐FKBP51, or anti‐DLC2. Total cell lysates and immunoprecipitates were analyzed using anti‐FKBP51 or anti‐DLC2 antibodies.
Overexpression of FKBP51 influences Rho‐GAP activity
Given that FKBP51 and DLCs (1 and 2) associate in cells, we speculated that FKBP51 affects GAP activity. To determine whether FKBP51 influences Rho‐GAP activity, we examined GAP assays using recombinant proteins. GTP‐RhoA was assessed semiquantitatively by Western blotting, and the data were used to calculate Rho activation [(GTP‐RhoA/Total RhoA‐Halo) × 100] (Fig. 2a). Cells expressing FLAG‐FKBP51 or Halo‐DLC2 were visualized with anti‐Halo and anti‐FLAG antibodies (Fig. 2b). Western blot analysis revealed an approximate 2.5‐fold increase in Rho activation in FLAG‐FKBP51‐overexpressing 293T cells when compared with FLAG overexpressing control cells (Fig. 2a,c; lanes 1 and 2). By contrast, Rho activation in Halo‐DLC2‐overexpressing 293T cells was decreased when compared with control cells (Fig. 2a; lanes 2 and 3). These results suggest that the interaction of FKBP51 with GAP proteins decreases GAP activity, thus increasing GTP‐RhoA expression.
Figure 2.
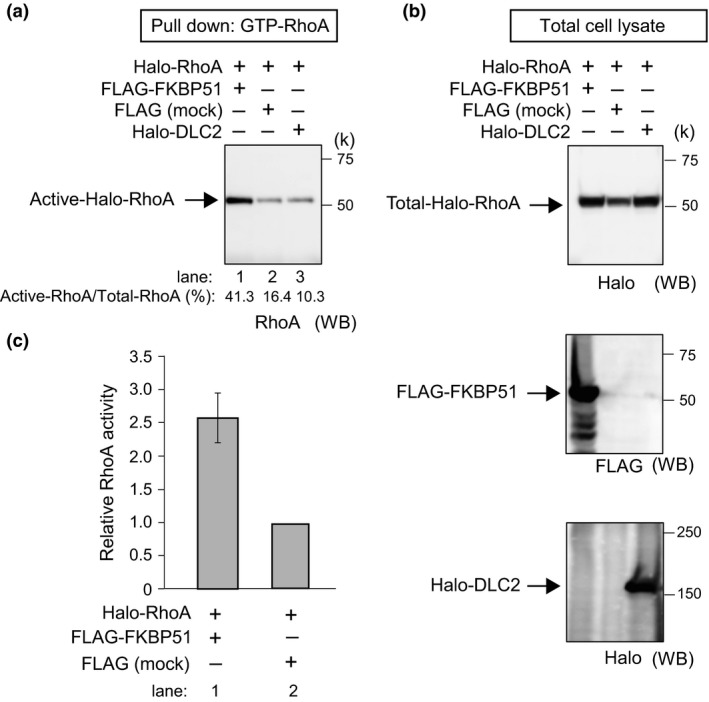
FKBP51 overexpression increases RhoA activation. (a) 293T cells were transfected with the indicated expression vectors for 24 h and then subjected to the RhoA activation assay. Western blotting was completed after the pull‐down of activated forms of RhoA in cells expressing FKBP51 or DLC2. (b) Cells expressing FLAG‐FKBP51 or Halo‐DLC2 were visualized by anti‐Halo and anti‐FLAG antibodies. (c) Corresponding quantification from independent pull‐down experiments (normalization of the GTP‐bound forms to total RhoA) (left figure and column graph). Data in the column graph are represented as the mean ± SEM (n = 3; FLAG‐FKBP51 and FLAG‐mock for the RhoA pull‐down assay).
Overexpression of FKBP51 enhances cells motility and invasion
To determine whether FKBP51 overexpression correlates with cell motility and invasion, we expressed FLAG‐FKBP51 in U2OS cells (Fig. S2a). Cell numbers were measured using a water‐soluble tetrazolium‐1 (WST‐1) assay. The relative fluorescence units (RFU) indicate the relative level of proliferation. Column graphs show the mean ± SEM from six samples. In U2OS cells, the expression of FLAG‐FKBP51 had no effect on proliferation (Fig. 3a and Fig. S2b). A confluent monolayer of U2OS cells was scratched, and cell motility was measured in a wound‐healing assay using time‐lapse microscopy (Fig. 3b). Phase contrast images are shown for 0 and 24 h. The dotted lines indicate cells at the start of the experiment, and white lines show the tips of migrated cells after 24 h. Bar graphs show the proportion of cell motility as the mean ± SEM from three samples (Fig. 3c). U2OS cells transfected with FLAG‐FKBP51 exhibited significantly increased motility relative to cells transfected with the FLAG‐mock vector (P = 0.017, Student's t‐test; n = 3). The ROCK inhibitor Y‐27632 decreased cell motility (P < 0.01, Student's t‐test; n = 4) (Fig. 3d). Cell invasion was measured using the CytoSelect 96‐well collagen I cell invasion assay (Cell Biolabs, San Diego, CA, USA). Invasive cells pass through the basement membrane layer, whereas noninvasive cells remain in the upper chamber. After removal of non‐invasive cells, invading cells were stained and counted. Column graphs show the mean ± SEM from three samples (Fig. 3e). Cell invasion was increased by overexpression of FLAG‐FKBP51 (P = 0.034, Student's t‐test; n = 3).
Figure 3.
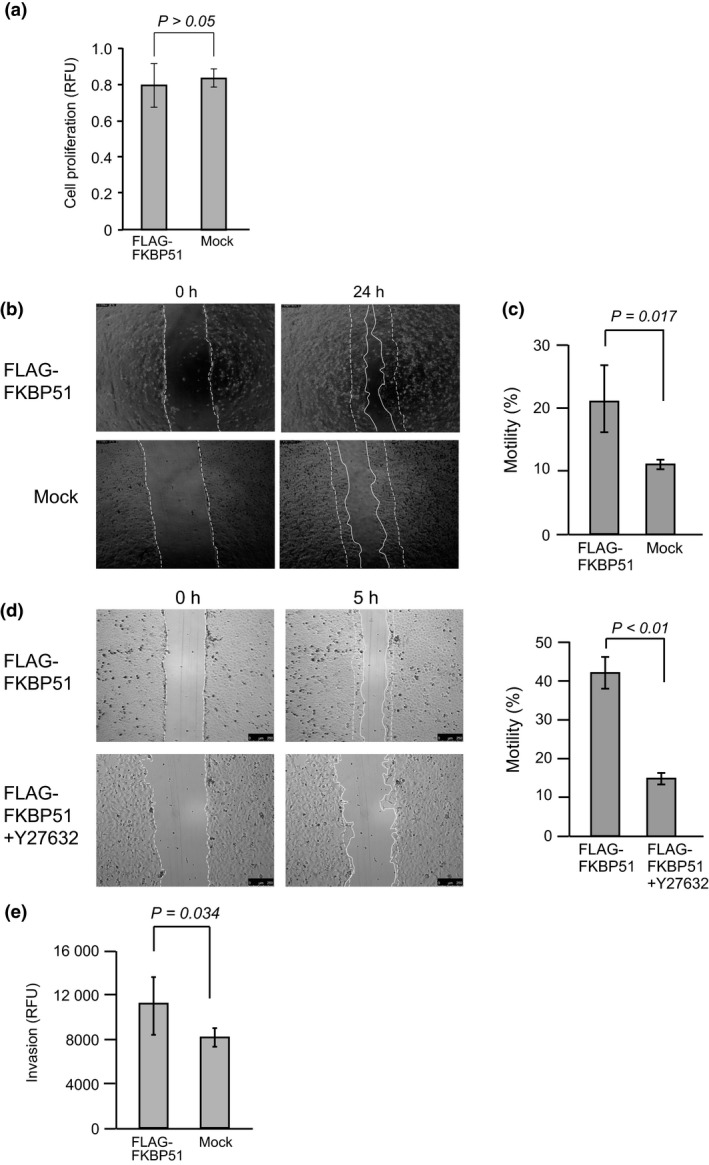
Cell motility and invasion assay following overexpression of FKBP51. (a) U2OS cells were transfected with FLAG‐FKBP51 or the FLAG‐mock expression vector for 24 h. Next, proliferation was measured using the WST‐1 assay. Relative fluorescence units (RFU) indicate the relative amount of proliferation. Column graphs show the mean ± SEM from six samples. (b) U2OS cells were transfected with FLAG‐FKBP51 or the FLAG‐mock expression vector for 24 h and then subjected to the wound‐healing assay. Phase contrast images are shown for 0 and 24 h. The dotted lines indicate cells at the start of the experiment, and white lines show the tips of migrated cells after 24 h. (c) Column graphs show the mean ± SEM from three samples. (d) U2OS cells were transfected with FLAG‐FKBP51 for 24 h and then treated with the ROCK inhibitor Y‐27632 (50 μM). After the 24‐h inhibitor treatment, cells were subjected to the wound‐healing assay. Phase contrast images are shown for time points 0 and 5 h. The dotted lines indicate cells at the start of the experiment, and the white lines show the tips of migrated cells after 5 h. Column graphs show the mean ± SEM from four samples. (e) U2OS cells were transfected with FLAG‐FKBP51 or the FLAG‐mock expression vector for 24 h and then subjected to the cell invasion assay. Relative fluorescence units (RFU) indicate the relative amount of proliferation. Column graphs show the mean ± SEM from three samples.
Knockdown of FKBP51 influences Rho‐GAP activity
We assessed whether the knockdown of FKBP51 affects GAP activity. We knocked down FKBP51 expression in U2OS cells and examined the levels of GTP‐RhoA using a pull‐down assay. A Western blot analysis revealed that RhoA activity was decreased in FKBP51 siRNA‐transfected cells compared with control siRNA‐transfected cells (Fig. 4a,b). Cells expressing FLAG‐ FKBP51 or Halo‐DLC2 were visualized by anti‐Halo, anti‐FKBP51 and anti‐GAPDH antibodies (Fig. 4c). These results indicate that knocking down of FKBP51 induces RhoA inactivation.
Figure 4.
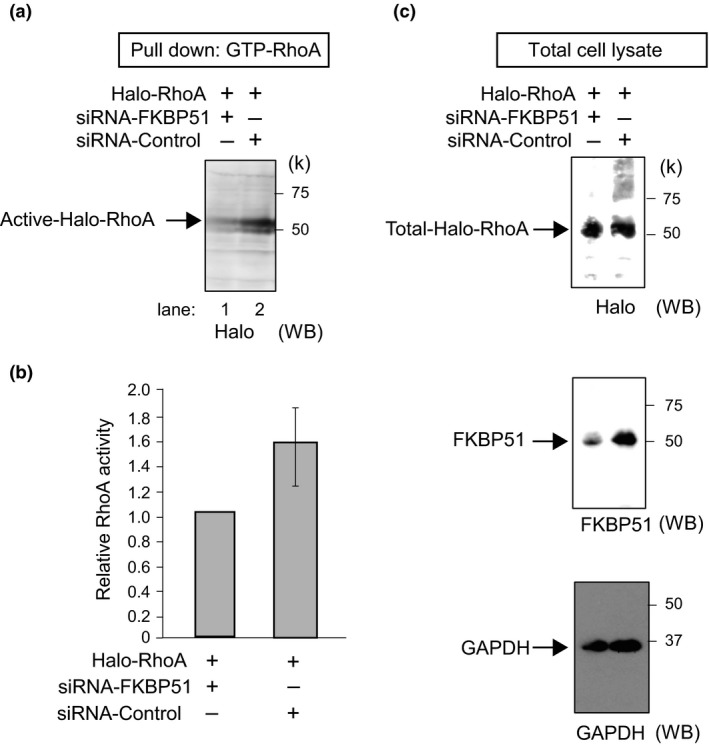
FKBP51 silencing decreases RhoA activation. (a) U2OS cells were transfected with Halo‐RhoA for 24 h followed by treatment with siRNA‐FKBP51 or siRNA‐control for 48 h. Cells were then subjected to the RhoA activation assay. We completed a Western blot analysis of the pulled‐down activated forms of RhoA after depletion of FKBP51. (b) The corresponding quantification of independent pull‐down experiments is shown (normalization of the GTP‐bound forms to total RhoA). Column graphs are represented as the mean ± SEM (n = 3; siRNA‐FKBP51 and siRNA‐control for the RhoA pull‐down assay). (c) Cells expressing endogenous FKBP51 or Halo‐DLC2 were visualized by anti‐FKBP51 and anti‐Halo antibodies. Glyceraldehyde 3‐phosphate dehydrogenase (GAPDH) was used as a loading control.
Knockdown of FKBP51 prevents cell motility and invasion
We next assessed whether the knockdown of FKBP51 inhibited cell motility and invasion. We treated U2OS cells with siRNA‐FKBP51. FKBP51 knockdown did not affect cell proliferation for 72 h, as determined by the WST‐1 assay (Fig. 5a and Fig. S3a). Each sample was subjected to SDS‐PAGE, followed by immunoblot analysis with anti‐FKBP51 (Fig. S3b). β–actin was used as a loading control. We compared the motility and invasion of U2OS cells treated with siRNA‐FKBP51 to cells treated with the siRNA‐control. Cell motility was measured in a wound‐healing assay using time‐lapse microscopy (Fig. 5b). Phase contrast images are shown for 0 and 24 h. Cells treated with siRNA‐FKBP51 exhibited significantly reduced motility (Fig. 5c) and invasion (Fig. 5d), compared with cells treated with the siRNA‐control (motility; P = 0.031 [FKBP51‐1 vs control] and 0.001 [FKBP51‐2 vs control], Student's t‐test; n = 3, invasion; P = 0.041 [FKBP51‐1 vs control] and 0.0001 [FKBP51‐2 vs control], Student's t‐test; n = 4). These data demonstrate that FKBP51 plays a functional role in promoting cell motility and invasion.
Figure 5.
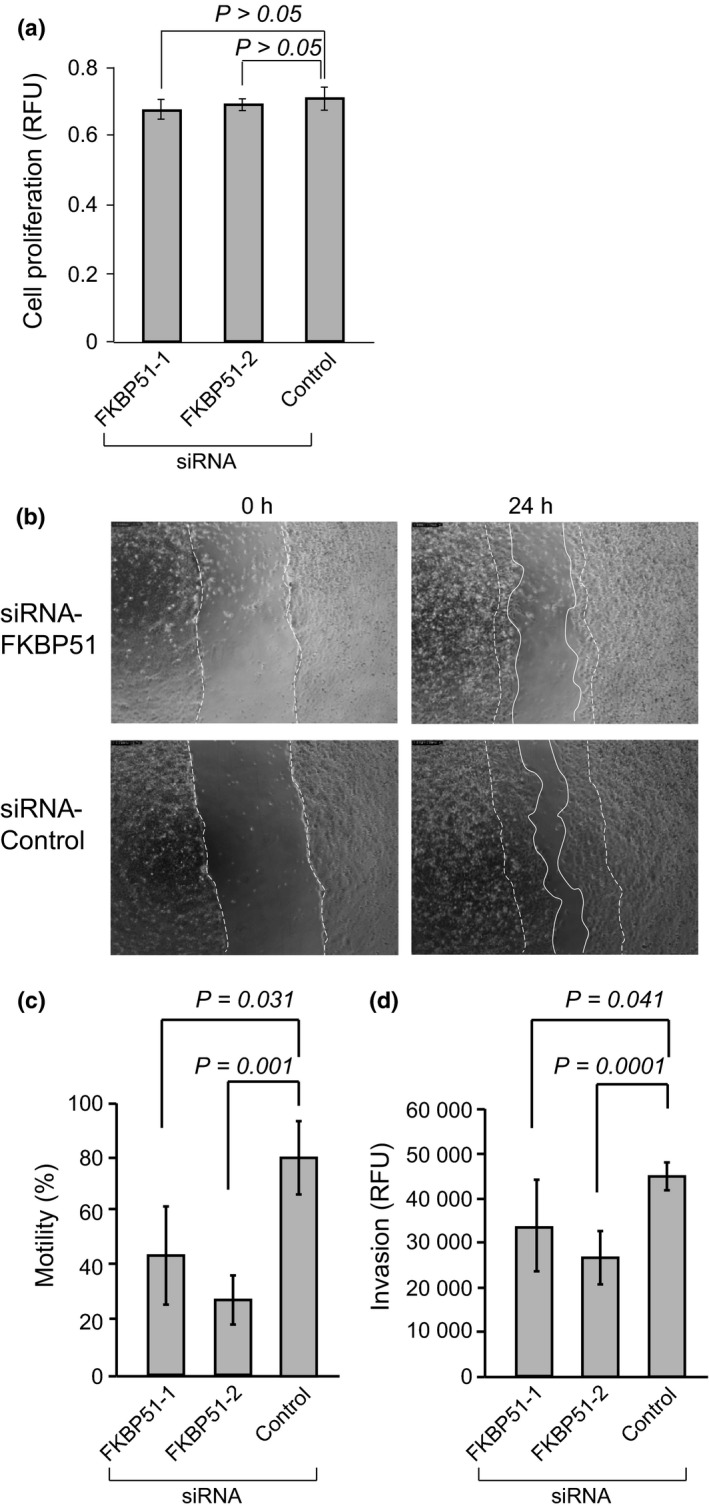
Cell motility and invasion assay following knockdown of FKBP51. (a) U2OS cells were treated with siRNA‐FKBP51 or siRNA‐control for 48 h. Next, proliferation was measured using the WST‐1 assay. Relative fluorescence units (RFU) indicate the relative amount of proliferation. Column graphs show the mean ± SEM from five samples. (b) U2OS cells were treated with siRNA‐FKBP51 or siRNA‐control for 48 h and then subjected to the wound‐healing assay. Phase contrast images are shown for 0 and 24 h. The dotted lines indicate cells at the start of the experiment, and white lines show the tips of migrated cells after 24 h. (c) Column graphs show the mean ± SEM from three samples. (d) U2OS cells were treated with siRNA‐FKBP51 or siRNA‐control for 48 h and then subjected to the cell invasion assay. Relative fluorescence units (RFU) indicate the relative amount of proliferation. Column graphs show the mean ± SEM from three samples.
Knockdown of FKBP51 prevents RhoA activity and alters the actin cytoskeleton
GTP‐RhoA plays a key role in cytoskeleton reorganization and the formation of actin stress fibers.33 Thus, we investigated whether the knockdown of FKBP51 altered the actin cytoskeleton, which was visualized by staining cells with phalloidin‐ATTO565. siRNA control cells showed cytoplasmic bundles of actin fibers. By contrast, siRNA FKBP51‐treated cells showed markedly reduced bundles and the cortical localization of F‐actin (Fig. 6a‐c; panels 2, 4, and 6). The knockdown of FKBP51 showed the formation of lamellipodia visualized by cortactin staining (Fig. 6a,b; panels 1 and 3), unlike the siRNA control (Fig. 6c; panel 5). The fraction of abnormal cells (exhibiting a collapse of F‐actin fibers) was 69.6 ± 12.2% in the knockdown cells and 12.4 ± 6.6% in the control cells (Fig. 6e). F‐actin was quantified by measuring the intensity of phalloidin fluorescence using an EnSpire plate reader (PerkinElmer, Waltham, MA, USA). The fluorescence intensity of phalloidin‐labeled actin was reduced in siRNA FKBP51‐treated cells when compared with the siRNA control (Fig. 6f). These results indicate that FKBP51 is required for the organization of the actin cytoskeleton.
Figure 6.
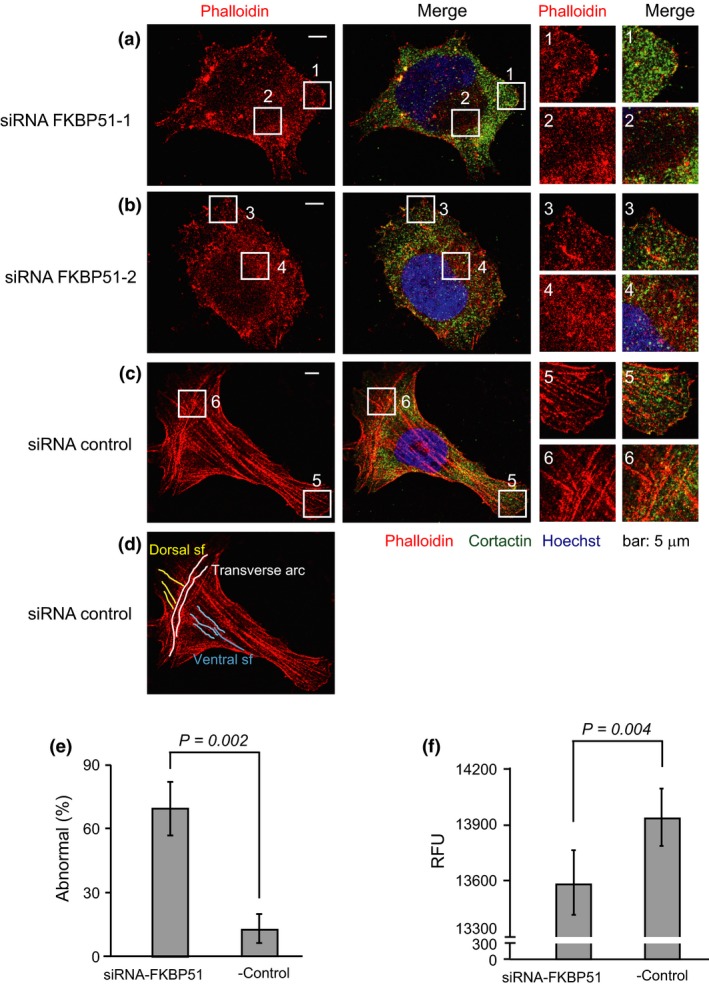
Inhibition of stress fiber formation by FKBP51 knockdown. (a–d) Staining of F‐actin with phalloidin‐ATTO565 (red) and cortactin (green) in U2OS cells treated with siRNA‐FKBP51 or siRNA‐control. Nuclei were stained with Hoechst 33258 (blue). The areas indicated by the boxes are magnified in the right panels. Control siRNA‐treated U2OS cells stained for F‐actin displayed all three categories of actin stress fibers (dorsal stress fibers, yellow; transverse arc, white; and ventral stress fibers, blue). (e) The graph shows the mean fraction (±SD) of cells with inhibited stress fibers based on three independent experiments (n = 50). (f) U2OS cells were treated with FKBP51 siRNA for 48 h and then stained with phalloidin‐Atto 565. The fluorescence intensity was measured with an EnSpire plate reader (PerkinElmer). Relative fluorescence units (RFU) indicate the relative amount of F‐actin. Column graphs show the mean ± SEM from four samples.
ROCK activity in FLAG‐FKBP51‐expressing U2OS cells
To focus on the mechanism by which FKBP51 promotes in vitro cell motility and invasion of cancer cells, we investigated the potential downstream targets of Rho activity. There are two major effectors for Rho signaling, ROCK and mDia. The balance of these two signaling molecules determines stress fiber formation and membrane ruffles. Rho‐mDia signaling produces membrane ruffles through Rac activation, and this signaling is suppressed by Rho‐ROCK activity, which is required for stress fiber formation. To determine whether FKBP51 influences Rho‐mDia or Rho‐ROCK signaling, we assessed the formation of membrane ruffles and actin stress fiber by immunostaining with a cortactin antibody and phalloidin‐ATTO565, respectively. We observed differences in the formation of membrane ruffles between FLAG‐FKBP51‐expressing U2OS cells and mock‐treated cells (Fig. 7a). FLAG‐FKBP51‐expressing cells showed decreased membrane ruffles when compared with mock‐treated cells. To investigate whether FKBP51 overexpression altered Rho‐ROCK activity, ROCK1 protein was fractionated with anion‐exchange chromatography (Fig. 7b). The expression of FLAG‐FKBP5 significantly activated ROCK activity in an immunoblot assay, and this effect was attenuated by a specific ROCK inhibitor Y27632 and a lack of ATP (Fig. 7c, n = 3, P < 0.05).
Figure 7.
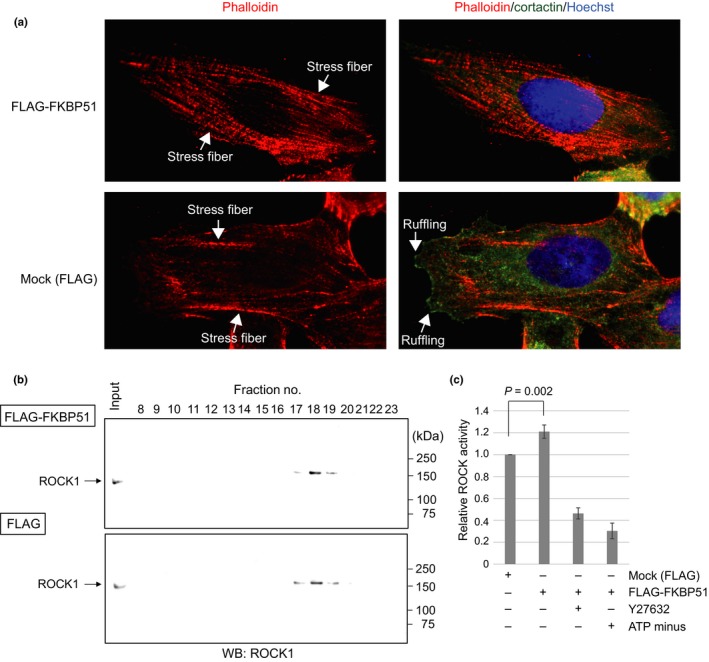
ROCK activity in FLAG‐FKBP51‐expressing U2OS cells. (a) U2OS cells were transfected with FLAG‐FKBP51 or the FLAG‐mock expression vector for 24 h. Next, cells were immunostained with anti‐cortactin antibody (green) and phalloidin‐ATTO565 (red). Nuclei were stained with Hoechst 33258 (blue). (b) The immunoblot analysis of ROCK1 in U2OS cells treated with FLAG‐FKBP51 or the FLAG vector (left panel), and the relative ROCK activity with or without the ROCK inhibitor Y27632 (10 μM) or ATP (125 μM) (n = 3) (right panel).
Discussion
In this study, we discovered a new molecular pathway for the regulation of RhoA activity. Specifically, FKBP51‐deficient cells contained a disrupted cytoskeleton with altered actin stress fibers (Fig. 6). Actin stress fibers can be divided into three different classes based on their subcellular location and role in cell motility: ventral stress fibers, dorsal stress fibers, and transvers arcs.34 Ventral stress fibers are part of the major contractile machinery in many interphase cells and lie along the base of the cell.34 Transverse arcs are actin filament bundles that form a periodic actinin‐myosin II pattern and convey contractile force to the surrounding environment through their connections with dorsal stress fibers.35 The formation of ventral stress fibers, dorsal stress fibers, and transvers arcs were inhibited in FKBP51‐deficient cells compared to in siRNA control‐treated cells (Fig. 6a–d).
Our study revealed that the overexpression of FKBP51 led to a significant increase in RhoA activation (Fig. 2) and cell motility (Fig. 3), compared with controls, suggesting that the GAP activity of DLC1/2 may be inhibited by FKBP51. Treatment with siRNA‐DLC2 increased wound healing and cell motility in MCF7 cells36 and increased migration in human endothelial cells. These effects were attenuated by silencing RhoA.37 DLC1 loss is sufficient to promote migratory behavior in breast cancer cells.38 A RhoA pull‐down assay demonstrated a remarkable reduction in RhoA activity in transiently DLC2‐transfected cells.20 Furthermore, the formation of actin stress fibers in DLC2‐GAP expressing cells was significantly inhibited compared with in non‐transfected cells.24 In our current study, the knockdown of FKBP51 significantly decreased RhoA activation (Fig. 4) and cell motility (Fig. 5), but did not influence DLC1/2 expression (data not shown), when compared with the control, suggesting that the GAP activity of DLC1/2 is enhanced by the silencing of endogenous FKBP51. Among Rho effectors, the role of ROCK and mDia in stress fiber formation is well documented. ROCK is a major mediator of Rho‐mediated actin cytoskeletal structures, including stress fibers, whereas mDia catalyzes actin nucleation and polymerization.39, 40 ROCK and mDia antagonize each other during Rho‐dependent Rac activation, and the balance of these two pathways determines the pattern of stress fibers.41 A recent study revealed that active RhoA‐Rhotekin and S100A4 forms a complex; however, the role of Rhotekin in Rho‐mediated downstream signal transduction leading to actin cytoskeleton reorganization remains largely unknown.42 In this study, we investigated the potential downstream targets of RhoA activity induced by the overexpression of FKBP51. Our results showed that ROCK activity was enhanced by the expression of FLAG‐FKBP51. Thus, FKBP51 overexpression promotes Rho‐ROCK signaling over Rho‐mDia signaling, which leads to the formation of actin stress fibers.
Our results suggest that FKBP51 affects GAP activity. The underlying mechanism by which FKBP51 inhibits GAP activity remains unclear. However, we identified DLC1 and DLC2 from immunoprecipitation with an anti‐FKBP51 antibody and subsequent mass spectroscopy (Fig. 1, Fig. S1). Association with 14‐3‐3 proteins inhibits DLC1 GAP activity and facilitates Rho signaling.43 Protein kinase D (PKD) stimulates the association of DLC1 with the phosphoserine‐binding 14‐3‐3 proteins through recognition motifs that include Ser327 and Ser431.43 We identified PKD in our immunoprecipitation experiments with an anti‐FKBP51 antibody (data not shown). Thus, FKBP51 may be involved in the regulation of PKD‐mediated DLC1 phosphorylation (Ser327 and Ser431). The inhibitory mechanism of GAP activity via FKBP51 requires further study. Moreover, investigating whether FKBP51 directly binds to the GAP domain of DLC1/2 may reveal the mechanism for its inhibitory effect on GAP activity. These results raise the interesting possibility that FKBP51 is associated with metastatic migration and the invasion of tumor cells via a novel RhoA‐based pathway. In addition, we would argue that the high expression of FKBP51 in several cancer cells gives rise to metastatic potential.
Disclosure Statement
The authors have no conflict of interest.
Supporting information
Fig. S1. DLC1 was identified as a FKBP51 partner and has common signature with DLC2.
Fig. S2. The expression level of transfected FLAG‐FKBP51 in U2OS cells and cell proliferation data (Supporting data related to Fig. 3).
Fig. S3. The expression level of FKBP51 in U2OS cells treated with each siRNA reagents and cell proliferation data (Supporting data related to Fig. 5).
Fig. S4. U2OS cells treated with siRNA‐FKBP51 or siRNA‐control, or transfected with FLAG‐FKBP51 or FLAG vector (Mock) for 24 h. Each samples was subjected to SDS‐PAGE followed by an immnuoblot analysis with anti‐DLC1/2 antibodies, b‐actin was used as a loading control.
Acknowledgments
We thank all members of the Department of Molecular Genetics of the Tokyo Medical and Dental University who provided helpful discussion. This study was supported by a grant from the Ministry of Education, Culture, Sports, Science and Technology of Japan (JSPS KAKENHI no. 15598477).
Cancer Sci 108 (2017) 380–389
Funding Information
Ministry of Education, Culture, Sports, Science and Technology of Japan (JSPS KAKENHI no. 15598477).
References
- 1. Romano S, Staibano S, Greco A et al FK506 binding protein 51 positively regulates melanoma stemness and metastatic potential. Cell Death Dis 2013; 4: e578. [DOI] [PMC free article] [PubMed] [Google Scholar]
- 2. Sung JH, An HS, Jeong JH, Shin S, Song SY. Megestrol acetate increases the proliferation, migration, and adipogenic differentiation of adipose‐derived stem cells via glucocorticoid receptor. Stem Cells Transl Med 2015; 4: 789–99. [DOI] [PMC free article] [PubMed] [Google Scholar]
- 3. Romano S, D'Angelillo A, D'Arrigo P et al FKBP51 increases the tumour‐promoter potential of TGF‐beta. Clin Transl Med 2014; 3: 1. [DOI] [PMC free article] [PubMed] [Google Scholar]
- 4. Romano S, Xiao Y, Nakaya M et al FKBP51 employs both scaffold and isomerase functions to promote NF‐κB activation in melanoma. Nucleic Acids Res 2015; 43: 6983–93. [DOI] [PMC free article] [PubMed] [Google Scholar]
- 5. Srivastava SK, Bhardwaj A, Arora S et al Interleukin‐8 is a key mediator of FKBP51‐induced melanoma growth, angiogenesis and metastasis. Br J Cancer 2015; 112: 1772–81. [DOI] [PMC free article] [PubMed] [Google Scholar]
- 6. Lagadari M, Zgajnar NR, Gallo LI, Galigniana MD. Hsp90‐binding immunophilin FKBP51 forms complexes with hTERT enhancing telomerase activity. Mol Oncol 2016; 10: 1086–98. [DOI] [PMC free article] [PubMed] [Google Scholar] [Retracted]
- 7. Romano S, Di Pace A, Sorrentino A, Bisogni R, Sivero L, Romano MF. FK506 binding proteins as targets in anticancer therapy. Anticancer Agents Med Chem 2010; 10: 651–6. [DOI] [PubMed] [Google Scholar]
- 8. Febbo PG, Lowenberg M, Thorner AR, Brown M, Loda M, Golub TR. Androgen mediated regulation and functional implications of fkbp51 expression in prostate cancer. J Urol 2005; 173: 1772–7. [DOI] [PubMed] [Google Scholar]
- 9. Periyasamy S, Hinds T Jr, Shemshedini L, Shou W, Sanchez ER. FKBP51 and Cyp40 are positive regulators of androgen‐dependent prostate cancer cell growth and the targets of FK506 and cyclosporin A. Oncogene 2010; 29: 1691–701. [DOI] [PMC free article] [PubMed] [Google Scholar]
- 10. Ni L, Yang CS, Gioeli D, Frierson H, Toft DO, Paschal BM. FKBP51 promotes assembly of the Hsp90 chaperone complex and regulates androgen receptor signaling in prostate cancer cells. Mol Cell Biol 2010; 30: 1243–53. [DOI] [PMC free article] [PubMed] [Google Scholar]
- 11. Pei H, Li L, Fridley BL et al FKBP51 affects cancer cell response to chemotherapy by negatively regulating akt. Cancer Cell 2009; 16: 259–66. [DOI] [PMC free article] [PubMed] [Google Scholar]
- 12. Hou J, Wang L. FKBP5 as a selection biomarker for gemcitabine and Akt inhibitors in treatment of pancreatic cancer. PLoS One 2012; 7: e36252. [DOI] [PMC free article] [PubMed] [Google Scholar]
- 13. Ratajczak T. Steroid receptor‐associated immunophilins: candidates for diverse drug‐targeting approaches in disease. Curr Mol Pharmacol 2015; 9: 66–95. [DOI] [PubMed] [Google Scholar]
- 14. Echeverria PC, Picard D. Molecular chaperones, essential partners of steroid hormone receptors for activity and mobility. Biochim Biophys Acta 2010; 1803: 641–9. [DOI] [PubMed] [Google Scholar]
- 15. Pratt WB, Galigniana MD, Harrell JM, DeFranco DB. Role of hsp90 and the hsp90‐binding immunophilins in signalling protein movement. Cell Signal 2004; 16: 857–72. [DOI] [PubMed] [Google Scholar]
- 16. Storer CL, Dickey CA, Galigniana MD, Rein T, Cox MB. FKBP51 and FKBP52 in signaling and disease. Trends Endocrinol Metab 2011; 22: 481–90. [DOI] [PMC free article] [PubMed] [Google Scholar]
- 17. Banerjee A, Periyasamy S, Wolf IM et al Control of glucocorticoid and progesterone receptor subcellular localization by the ligand‐binding domain is mediated by distinct interactions with tetratricopeptide repeat proteins. Biochemistry 2008; 47: 10471–80. [DOI] [PMC free article] [PubMed] [Google Scholar]
- 18. Davies TH, Ning YM, Sanchez ER. A new first step in activation of steroid receptors: hormone‐induced switching of FKBP51 and FKBP52 immunophilins. J Biol Chem 2002; 277: 4597–600. [DOI] [PubMed] [Google Scholar]
- 19. Shrestha S, Sun Y, Lufkin T et al Tetratricopeptide repeat domain 9A negatively regulates estrogen receptor alpha activity. Int J Biol Sci 2015; 11: 434–47. [DOI] [PMC free article] [PubMed] [Google Scholar]
- 20. Leung TH, Ching YP, Yam JW et al Deleted in liver cancer 2 (DLC2) suppresses cell transformation by means of inhibition of RhoA activity. Proc Natl Acad Sci USA 2005; 102: 15207–12. [DOI] [PMC free article] [PubMed] [Google Scholar]
- 21. Braun AC, Olayioye MA. Rho regulation: DLC proteins in space and time. Cell Signal 2015; 27: 1643–51. [DOI] [PubMed] [Google Scholar]
- 22. Ullmannova V, Popescu NC. Expression profile of the tumor suppressor genes DLC‐1 and DLC‐2 in solid tumors. Int J Oncol 2006; 29: 1127–32. [PubMed] [Google Scholar]
- 23. Ko FC, Ping Yam JW. Regulation of deleted in liver cancer 1 tumor suppressor by protein‐protein interactions and phosphorylation. Int J Cancer 2014; 135: 264–9. [DOI] [PubMed] [Google Scholar]
- 24. Wang D, Qian X, Rajaram M, Durkin ME, Lowy DR. DLC1 is the principal biologically‐relevant down‐regulated DLC family member in several cancers. Oncotarget 2016; 7: 45144–57. [DOI] [PMC free article] [PubMed] [Google Scholar]
- 25. Lukasik D, Wilczek E, Wasiutynski A, Gornicka B. Deleted in liver cancer protein family in human malignancies (review). Oncol Lett 2011; 2: 763–8. [DOI] [PMC free article] [PubMed] [Google Scholar]
- 26. Wong CM, Lee JM, Ching YP, Jin DY, Ng IO. Genetic and epigenetic alterations of DLC‐1 gene in hepatocellular carcinoma. Cancer Res 2003; 63: 7646–51. [PubMed] [Google Scholar]
- 27. Li X, Zheng L, Zhang F et al STARD13‐correlated ceRNA network inhibits EMT and metastasis of breast cancer. Oncotarget 2016; 7: 23197–211. [DOI] [PMC free article] [PubMed] [Google Scholar]
- 28. Ching YP, Wong CM, Chan SF et al Deleted in liver cancer (DLC) 2 encodes a RhoGAP protein with growth suppressor function and is underexpressed in hepatocellular carcinoma. J Biol Chem 2003; 278: 10824–30. [DOI] [PubMed] [Google Scholar]
- 29. Healy KD, Hodgson L, Kim TY et al DLC‐1 suppresses non‐small cell lung cancer growth and invasion by RhoGAP‐dependent and independent mechanisms. Mol Carcinog 2008; 47: 326–37. [DOI] [PMC free article] [PubMed] [Google Scholar]
- 30. Evers EE, Zondag GC, Malliri A et al Rho family proteins in cell adhesion and cell migration. Eur J Cancer 2000; 36: 1269–74. [DOI] [PubMed] [Google Scholar]
- 31. Kim TY, Healy KD, Der CJ, Sciaky N, Bang YJ, Juliano RL. Effects of structure of Rho GTPase‐activating protein DLC‐1 on cell morphology and migration. J Biol Chem 2008; 283: 32762–70. [DOI] [PMC free article] [PubMed] [Google Scholar]
- 32. Nakanishi A, Han X, Saito H et al Interference with BRCA2, which localizes to the centrosome during S and early M phase, leads to abnormal nuclear division. Biochem Biophys Res Commun 2007; 355: 34–40. [DOI] [PubMed] [Google Scholar]
- 33. Bar‐Sagi D, Hall A. Ras and Rho GTPases: a family reunion. Cell 2000; 103: 227–38. [DOI] [PubMed] [Google Scholar]
- 34. Small JV, Rottner K, Kaverina I, Anderson KI. Assembling an actin cytoskeleton for cell attachment and movement. Biochim Biophys Acta 1998; 1404: 271–81. [DOI] [PubMed] [Google Scholar]
- 35. Tojkander S, Gateva G, Lappalainen P. Actin stress fibers – assembly, dynamics and biological roles. J Cell Sci 2012; 125: 1855–64. [DOI] [PubMed] [Google Scholar]
- 36. Tang F, Zhang R, He Y, Zou M, Guo L, Xi T. MicroRNA‐125b induces metastasis by targeting STARD13 in MCF‐7 and MDA‐MB‐231 breast cancer cells. PLoS One 2012; 7: e35435. [DOI] [PMC free article] [PubMed] [Google Scholar]
- 37. Lin Y, Chen NT, Shih YP, Liao YC, Xue L, Lo SH. DLC2 modulates angiogenic responses in vascular endothelial cells by regulating cell attachment and migration. Oncogene 2010; 29: 3010–6. [DOI] [PMC free article] [PubMed] [Google Scholar]
- 38. Heering J, Erlmann P, Olayioye MA. Simultaneous loss of the DLC1 and PTEN tumor suppressors enhances breast cancer cell migration. Exp Cell Res 2009; 315: 2505–14. [DOI] [PubMed] [Google Scholar]
- 39. Narumiya S, Tanji M, Ishizaki T. Rho signaling, ROCK and mDia1, in transformation, metastasis and invasion. Cancer Metastasis Rev 2009; 28: 65–76. [DOI] [PubMed] [Google Scholar]
- 40. O'Connor K, Chen M. Dynamic functions of RhoA in tumor cell migration and invasion. Small GTPases 2013; 4: 141–7. [DOI] [PMC free article] [PubMed] [Google Scholar]
- 41. Tsuji T, Ishizaki T, Okamoto M et al ROCK and mDia1 antagonize in Rho‐dependent Rac activation in Swiss 3T3 fibroblasts. J Cell Biol 2002; 157: 819–30. [DOI] [PMC free article] [PubMed] [Google Scholar]
- 42. Chen M, Bresnick AR, O'Connor KL. Coupling S100A4 to Rhotekin alters Rho signaling output in breast cancer cells. Oncogene 2013; 32: 3754–64. [DOI] [PMC free article] [PubMed] [Google Scholar]
- 43. Scholz RP, Regner J, Theil A et al DLC1 interacts with 14‐3‐3 proteins to inhibit RhoGAP activity and block nucleocytoplasmic shuttling. J Cell Sci 2009; 122: 92–102. [DOI] [PubMed] [Google Scholar]
Associated Data
This section collects any data citations, data availability statements, or supplementary materials included in this article.
Supplementary Materials
Fig. S1. DLC1 was identified as a FKBP51 partner and has common signature with DLC2.
Fig. S2. The expression level of transfected FLAG‐FKBP51 in U2OS cells and cell proliferation data (Supporting data related to Fig. 3).
Fig. S3. The expression level of FKBP51 in U2OS cells treated with each siRNA reagents and cell proliferation data (Supporting data related to Fig. 5).
Fig. S4. U2OS cells treated with siRNA‐FKBP51 or siRNA‐control, or transfected with FLAG‐FKBP51 or FLAG vector (Mock) for 24 h. Each samples was subjected to SDS‐PAGE followed by an immnuoblot analysis with anti‐DLC1/2 antibodies, b‐actin was used as a loading control.


