Abstract
Tumor tissue consists of a heterogeneous cell population. The allelic imbalance (AI) ratio, determined in isolated tumor glands, is a good index of tumor heterogeneity. However, associations of the patterns of AI and microsatellite instability (MSI) development, observed in most cases of colorectal cancer (CRC), with tumor progression have not been reported previously. In this study, we examined whether CRC genetic profiles stratified by a combination of the AI ratio and MSI facilitate categorization of CRC, and whether these genetic profiles are associated with specific molecular alterations in CRC. A crypt isolation method was used to isolate DNA from tumors and normal glands obtained from 147 sporadic CRCs. AI and MSI statuses were determined using PCR‐based microsatellite analysis and stratified based on AI ratio and MSI status. DNA methylation status (high methylation, intermediate methylation and low methylation status and mutations in KRAS,BRAF, and TP53 were examined. In addition, mucin markers were immunostained. Based on this analysis, four subgroups were categorized. Subgroup 1 was characterized by a high MSI status and BRAF mutation; subgroup 2 was closely associated with a high AI ratio, which accumulated during the early phases of colorectal carcinogenesis, and TP53 mutation; subgroup 3 was associated with a low AI ratio, seen during the later phases of colorectal carcinogenesis, and KRAS mutation; and subgroup 4 was defined as a minor subgroup. These results confirmed that classification of distinct molecular profiles provides important insights into colorectal carcinogenesis.
Keywords: Allelic imbalance, cluster analysis, colorectal cancer, methylation, microsatellite instability
Colorectal cancer (CRC) is one of the most common types of cancer and the second leading cause of cancer‐related deaths in developed countries.1, 2 Despite marked advances in the evaluation of carcinogenesis and improvements in diagnostic and treatment modalities, the specific genetic abnormalities associated with CRC development remain unresolved. Although surgery may be effective therapy to prevent the recurrence of advanced CRC, subsequent liver metastasis is still a problem in patients with CRC. To date, there is still no appropriate targeted therapy reported to improve clinical outcomes of patients with CRC. Therefore, further advances in our understanding of the molecular carcinogenesis of CRC would be useful for patients with CRC.
Integrated molecular and transcriptomic patterns in CRC, including new insights from The Cancer Genome Atlas project and the Consensus Molecular Subtype (CMS) Consortium, have been demonstrated.3, 4, 5 Whereas the former classification is based mainly on genome‐level alterations (hypermutation and non‐hypermutation), the latter is based on both expression and genetic patterns (CMS 1, 2, 3, 4, and mixed features). In addition, new classification systems have been proposed based on comparisons of gene expression in tumor cells with that in corresponding normal cell populations (stem‐like, inflammatory, transit‐amplifying, and goblet‐like cells and enterocytes).6 Although these molecular classifications of CRC play an important role in evaluating colorectal carcinogenesis, the proposed hypotheses are not based on the clonal evolution of tumor cells thought to arise during tumor progression.
The prevailing model of molecular genetics underlying CRC suggests that this disease arises via clonal expansion of crypt cells bearing genetic mutations,7, 8 microsatellite alterations (e.g., microsatellite instability [MSI]), or chromosomal abnormalities. Such genetic and epigenetic alterations may result in proliferative advantages in areas of tumor invasion, affecting various tumor‐related factors such as invasive ability and tumor aggressiveness.7, 8, 9 Chromosomal changes can occur as chromosomal gains or losses, the latter of which involves loss of heterozygosity (LOH), an important classical genetic alteration occurring in tumor cells (e.g., chromosomal instability [CIN]).10, 11, 12 Moreover, MSI plays a major role in specific types of CRC (in particular, the MSI‐high phenotype) and is closely associated with tumor development.6, 7, 8, 9 Subsequent chromosomal changes, including LOH and MSI, act as drivers for tumor progression or invasion.10, 11, 12, 13 The sequential acquisition of chromosomal changes and MSI within the tumor tissue is expected to provide an important paradigm with which to understand tumor progression in CRC.14, 15 However, tumor tissue has been shown to be heterogeneous in terms of genetic alterations, including LOH and MSI,14, 15 and tumor heterogeneity has been shown to play a key role in facilitating tumor invasion and progression.8 Indeed, comprehensive genetic analysis has demonstrated variability in the genetic alterations and pathways that underlie CRC, suggesting the presence of multiple disease subtypes that have evolved through different routes. Clonal evolution is an essential concept for evaluating tumor invasion and aggressiveness in CRC.7, 8 Specifically, chromosomal change with the capacity to drive heterogeneity within CRC plays an important role in colorectal carcinogenesis.14, 15
In this study, we aimed to examine clonal evolution based on MSI and allelic imbalance (AI, similar to the concept of LOH) using isolated tumor glands to obtain pure tumor cells in CRCs. Our results allowed us to propose novel mechanisms of carcinogenesis evaluated from a specific perspective. In addition, we also discuss the potential roles of tumor clonal evolution in the identification of molecular profiles of CRC.
Materials and Methods
Patients
A total of 147 CRC tissue samples and matched normal colorectal tissues were used in this study. All samples were obtained from the Department of Gastrointestinal Surgery, Iwate Medical University Hospital between 2008 and 2014. Clinicopathological findings, including tumor location, macroscopic type, histological classification, lymphatic invasion, venous invasion, and tumor stage, were determined according to the Classification of the Japanese Society for Cancer of the Colon and Rectum.16
All patients who participated in this study provided written informed consent, and the study was approved by the Ethical Committee of Iwate Medical University.
Crypt isolation technique
Fresh tumor and normal tissues were sampled from resected CRCs. The tumor samples were obtained primarily from the central area of tumor ulceration. Normal colonic mucosa was taken from the most distal portion of the colon. Crypt isolation from the tumor and normal mucosa was performed in accordance with a previously reported method.17 Briefly, fresh mucosa and tumor specimens were minced with a razor into small pieces and then incubated at 37°C for 30 min in calcium‐ and magnesium‐free Hanks’ balanced salt solution (CMF) containing 30 mM ethylenediaminetetraacetic acid (EDTA). Following this procedure, the tissue was then stirred in CMF for 30–40 min. Normal and tumor glands were separated from the lamina propria mucosa or fibrous stroma. The isolated glands were immediately fixed in 70% ethanol and stored at 4°C until DNA extraction. DNA from normal and tumor glands was extracted by standard SDS proteinase K treatment. DNA extracted from the samples was resuspended in TE buffer (10 mM Tris–HCl, 1 mM EDTA [pH 8.0]).
Immunohistochemistry
Immediately after excision, tumor specimens were fixed in 20% neutral buffered formalin, embedded in paraffin wax, cut into 3‐μm‐thick sections, and stained with hematoxylin and eosin (HE) for routine pathological diagnosis. For immunohistochemical staining, additional 3‐μm‐thick sections were cut from the paraffin‐embedded tissue and placed on poly‐l‐lysine‐coated glass slides. For determination of mucin phenotypes, immunostaining was performed for MUC2 (Ccp58; Novocastra Laboratories, Newcastle, UK), CD10 (56C6; Novocastra Laboratories), MUC5AC (CLH2; Novocastra Laboratories), and MUC6 (CLH5; Novocastra Laboratories).
Immunohistochemistry was performed using the DAKO Envision+ system, consisting of dextran polymers conjugated with horseradish peroxidase (DAKO), as previously described.18 Hematoxylin was used as the counterstain.
Evaluation of mucin expression
Cases of colorectal cancer were classified into four groups (gastric type, small intestinal type, colonic type, and mixed type or unclassified type) according to their immunostaining patterns. The mucin phenotype of the tumor was defined as previously described.19 The cut‐off value was determined as follows: immune‐positive results for more than 10% of the tumor cells were regarded as positive, and immune‐positive results for <10% were regarded as negative, a previously reported.19
Analysis of MSI
MSI status was determined by five NCI markers, including BAT25, BAT26, D2S123, D5S346, and D17S250. MSI‐high (MSI‐H) was defined as two or more markers being unstable, MSI‐low (MSI‐L) was defined as 1 marker being unstable, and microsatellite stable (MSS) was defined as the absence of instability.20
Analysis of allelic imbalances at chromosomal loci
Normal and tumor DNA were analyzed for allelic imbalance by polymerase chain reaction (PCR) amplification using polymorphic dinucleotide repeat sequences, including 24 markers on chromosomes 1p (D1S228, D1S548, and D1S507), 3p (D3S2402 and D3S1234), 4p (D4S2639 and D4S1601), 5q (D5S107, D5S346, D5S82, and D5S299), 8q (D8S201, D8S513, and D8S532), 9p (D9S171 and D9S1118), 13q (D13S162); 17p (TP53), 18q (D18S487, D18S34, and DCC), and 22q (D22S274, D22S1140, and D22S1168). The sequences of these primers were obtained from The Genome Database (http://gdbwww.gdb.org/gdb/). PCR was performed using a DNA autosequencer (Applied Biosystems 9600 Sequencer; Applied Biosystems, Foster City, CA, USA), as previously described.15 The data from the PCR analysis were collected automatically and analyzed using GeneScan software (Applied Biosystems) for allele scoring (allelic ratio) and assessment of AI, as described previously. The formula employed for the calculation was T2:T1/N2:N1, where T1 and N1 are the height values for the smaller allele, and T2 and N2 are the height values for the larger allele of the tumor (T) and normal (N) samples, respectively. When AIs were observed in at least one locus of the chromosomal loci examined, the imbalances of those loci were confirmed.
Pyrosequencing for evaluation of methylation and mutations in KRAS and BRAF
The DNA methylation status of each gene promoter region and mutations in KRAS and BRAF were quantified by PCR analysis of bisulfite‐modified genomic DNA (EpiTect Bisulfite Kit; Qiagen, Valencia, CA, USA) using pyrosequencing (Pyromark Q24; Qiagen NV), as previously described.21 The primers for methylation analysis were designed using the Pyromark Assay Designing Software package (Qiagen NV), with 3–4 CpG sites contained for analysis of promoter methylation. The primers used for analysis of KRAS and BRAF mutations are described elsewhere (the primers for methylation analysis were designed and are not indicated in this study).
DNA methylation was quantified at six specific promoters originally described by Yagi and colleagues.22 Briefly, using a panel of three markers (RUNX3, MINT31, and LOX), high methylation epigenome (HME) tumors were defined as those with at least two methylated markers. The remaining tumors were examined using three additional markers (NEUROG1, ELMO1, and THBD); intermediate methylation epigenome (IME) tumors were defined as those with at least two methylated markers. Tumors not classified as HME or IME were designated as low methylation epigenome (LME) tumors.22, 23
The cut‐off value for the mutation assay was 15% mutant alleles, while that for the methylation assay was 30% of tumor cells, as previously reported.21
Analysis of TP53 mutations
Single‐strand conformational polymorphism (SSCP) analysis was used to screen PCR products derived from exons 5–8 of the TP53 gene in patient tumor and normal mucosal DNA samples. PCR conditions, PCR‐SSCP, and sequencing of TP53 gene mutations were performed according to previously described methods.24 Direct sequencing was performed using fluorescence‐labeled dideoxynucleotide triphosphates for automated DNA sequence analysis (Applied Biosystems 373A Sequencer; Applied Biosystems).
Statistical analysis
Hierarchical analysis was performed for clustering the samples according to the MSI and AI ratio in order to achieve maximal homogeneity for each group and the highest difference between groups. The clustering algorithm was set to centroid linkage clustering, the standard hierarchical clustering method used in biological analyses.
Data obtained for histological features, immunohistochemical findings, and methylation status based on each subgroup were analyzed using χ2 tests with the aid of Stat Mate‐III software (Atom, Tokyo, Japan). If statistical differences between the four groups were found, statistical analysis between two groups was further performed using χ2 tests (Stat Mate‐III software). Differences in age distributions between the four groups were evaluated using the Kruskal–Wallis H‐test with the aid of Stat Mate‐III software (Atom). Differences with P‐values of < 0.05 were considered significant.
Finally, cancer‐specific patient survival was calculated from the date of surgery to that of the last follow‐up or patient death. A univariate survival analysis was performed according to the Kaplan–Meier method, and survival curves were compared using the log‐rank test.
Results
In the present study, hierarchical clustering analysis based on the allelic ratio of AI and MSI status was performed to examine differences in genetic alterations in samples from patients with CRC. In the CRC samples examined in this study, the allelic ratios were subdivided into five categories: 0–0.2, 0.2–0.4, 0.4–0.6, 0.6–0.8, and 0.8–1.0. A high allelic ratio at the chromosomal locus was indicative of accumulation of AIs, suggesting that the AIs had been acquired from the early phases of carcinogenesis. On the other hand, a low allelic ratio at the chromosomal locus was indicative of late acquisition of AI during colorectal carcinogenesis.
Four distinct subgroups were defined, as shown in Figures 1 and 2. The vertical line shows the degree of the allelic ratio of AI at the chromosomal loci and MSI status, and the horizontal lines denote relatedness between samples. MSI‐high status was frequently found in subgroup 1. Tumors with multiple AIs that were accumulated in the early stages of CRC were categorized into subgroup 2. On the other hand, AIs at chromosomal loci examined were found in tumors in subgroup 3, which showed a low frequency of AI. Subgroup 4 comprised tumors that did not belong to the other subgroups.
Figure 1.
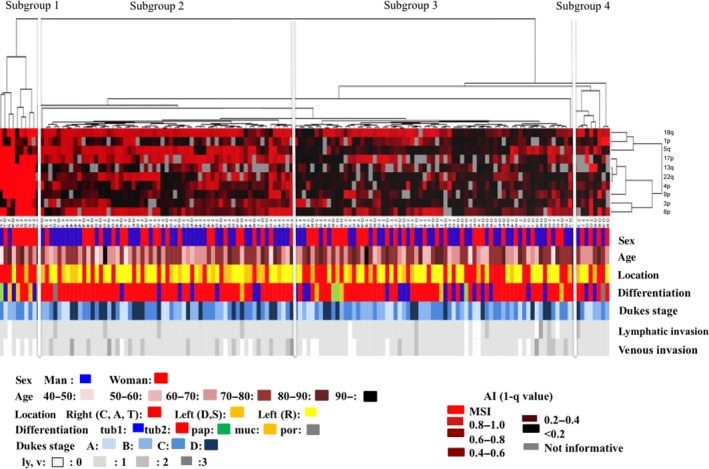
Clinicopathological findings from hierarchical cluster analysis of cases of colorectal cancer (CRCs) using PCR‐based microsatellite analysis. The examined CRCs were classified into four subgroups.
Figure 2.
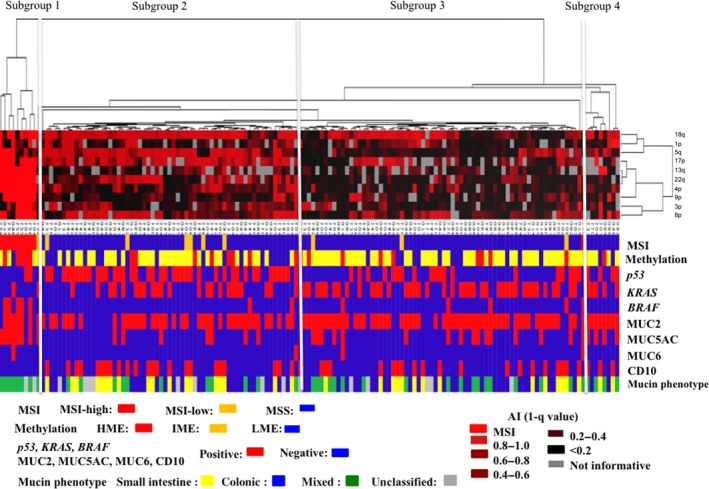
Molecular findings from hierarchical cluster analysis of cases of colorectal cancer (CRCs) using PCR‐based microsatellite analysis. The examined CRCs were classified into four subgroups.
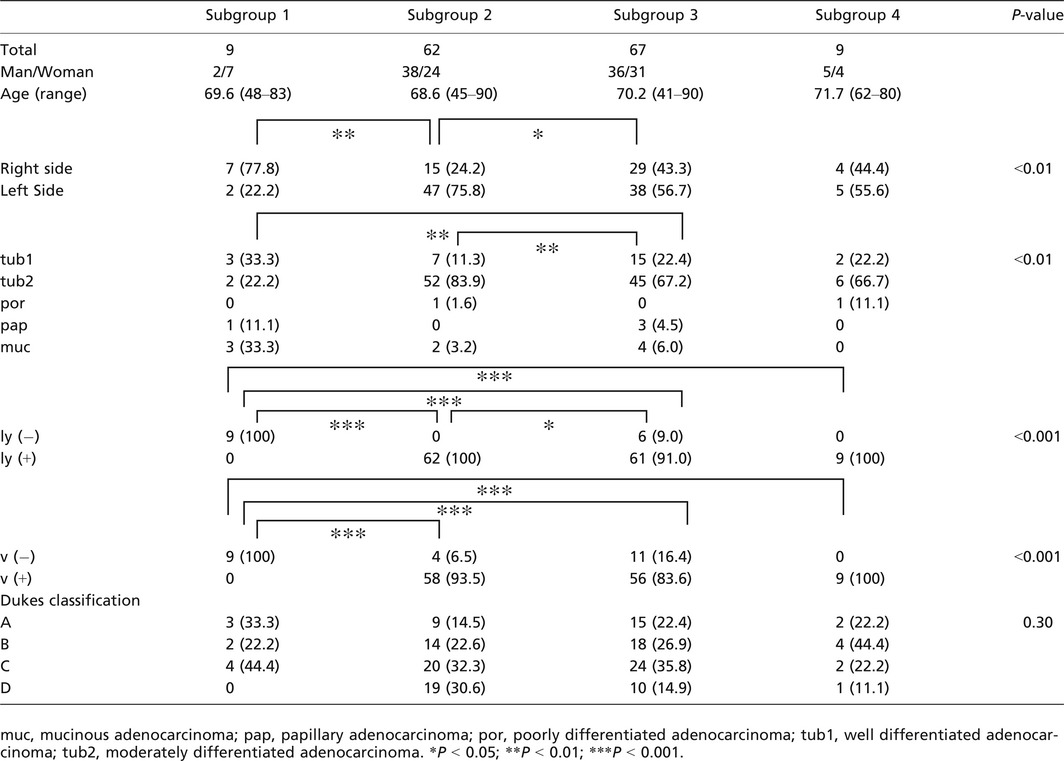
There were significant differences in the frequencies of right‐sided location between subgroup 1 (7 out of 9 tumors) and subgroup 2 (15 out of 62 tumors; P < 0.01) and between subgroup 2 and subgroup 3 (29 out of 67 tumors; P < 0.05). In addition, the frequencies of well‐differentiated adenocarcinoma were significantly higher in subgroups 1 and 3 than in subgroup 2 (P < 0.01 for both). Although the frequency of tumors without venous invasion was significantly higher in subgroup 1 (5 out of 9 tumors) than in subgroup 2 (4 out of 62 tumors), subgroup 3 (11 out of 67 tumors), and subgroup 4 (0 out of 9 tumors), differences in tumors without lymphatic invasion were not significant among the four subgroups. Additionally, no significant differences in the frequencies of clinicopathological factors, including, sex, age, and Dukes’ classification, were observed among the four subgroups. These findings are summarized in Table 1.
Table 1.
Clinicopathological findings of colorectal cancer examined according to PCR‐based microsatellite analysis
The frequencies of small intestinal type tumors were significantly higher in subgroup 2 (18 out of 62, 29.0%) and subgroup 3 (14 out of 67, 20.9%) than in subgroup 1 (0 out of 9 tumors; P < 0.01 and P < 0.05, respectively). In addition, there was a significant difference in the frequency of colonic type tumors between subgroup 1 (0 out of 9 tumors) and subgroup 2 (30 out of 67; 44.8%) or 3 (24 out of 62; 38.7%). Significant differences were also observed in the frequencies of mixed type tumors between subgroup 1 (7 out of 9 tumors; 77.8%) and subgroup 2 (12 out of 62; 19.4%) or 3 (17 out of 67; 25.4%; P < 0.05 and P < 0.01, respectively).
MSI‐high status was more frequently found in subgroup 1 (0 out of 9 tumors) than in subgroup 2 (0 out of 62 tumors) or subgroup 3 (0 out of 67 tumors; P < 0.01), as shown in Table 2. Although subgroup 1 showed a high frequency of HME (4 out of 9 tumors) compared with the other 3 groups (subgroup 2: 8 out of 63 tumors; subgroup 3: 9 out of 67 tumors; subgroup 4: 1 out of 9 tumors), the difference did not reach statistical significance (P = 0.1; Fig. 3). The frequency of TP53 mutations in subgroup two tumors was significantly higher than that in tumors from subgroups 3 and 1 (P < 0.05 and P < 0.01, respectively). KRAS mutations were more frequently found in subgroup 3 tumors than in tumors from subgroups 1 and 2 (P < 0.05 and P < 0.01, respectively). In addition, there was a significant difference in KRAS mutations between subgroups 1 and 3 (P < 0.05). The frequency of BRAF mutations was significantly higher in tumors in subgroup 1 than in tumors in subgroups 2, 3, and 4 (P < 0.01). The differences in TP53, KRAS, and BRAF mutations are shown in Figure 4.
Table 2.
Frequencies of microsatellite instability (MSI) statuses according to subgroups stratified by PCR‐based microsatellite analysis
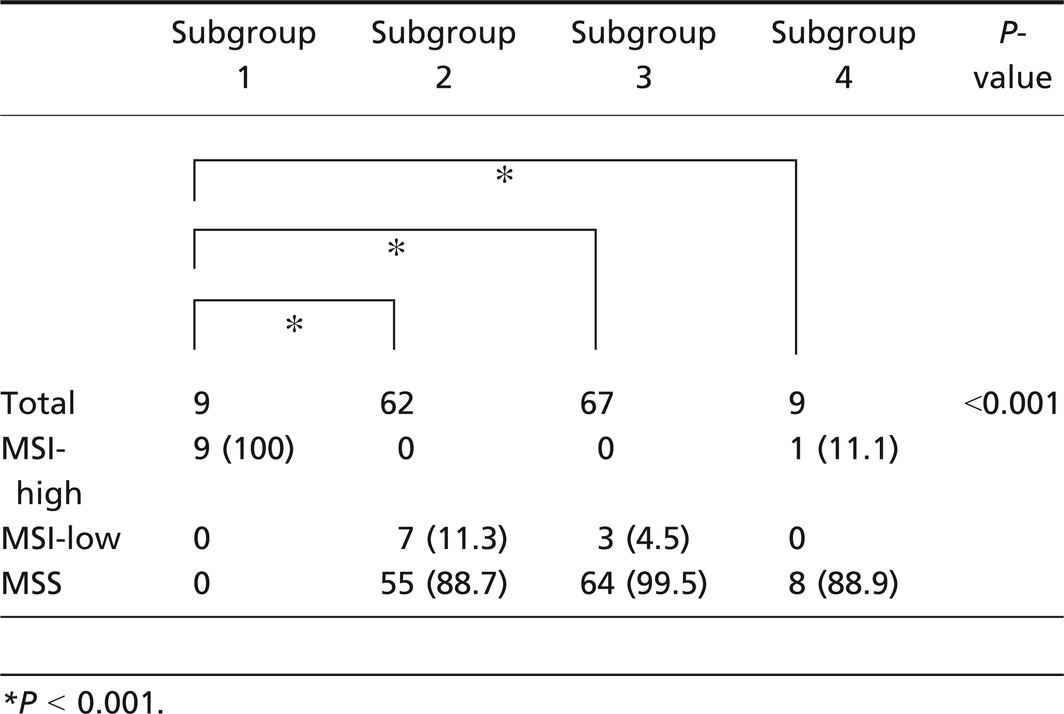
Figure 3.
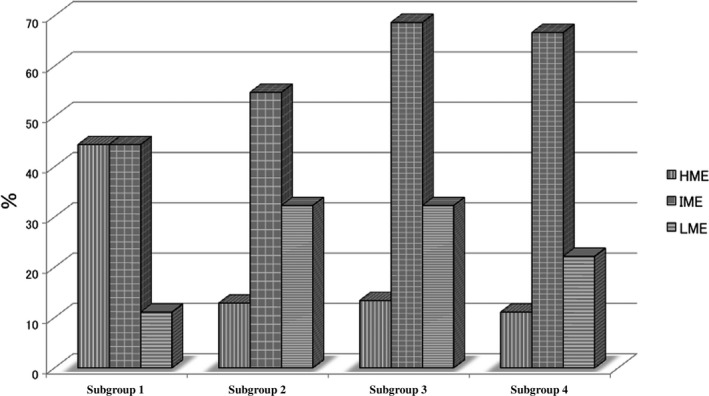
Frequencies of epigenome phenotypes in subgroups stratified by hierarchical cluster analysis.
Figure 4.
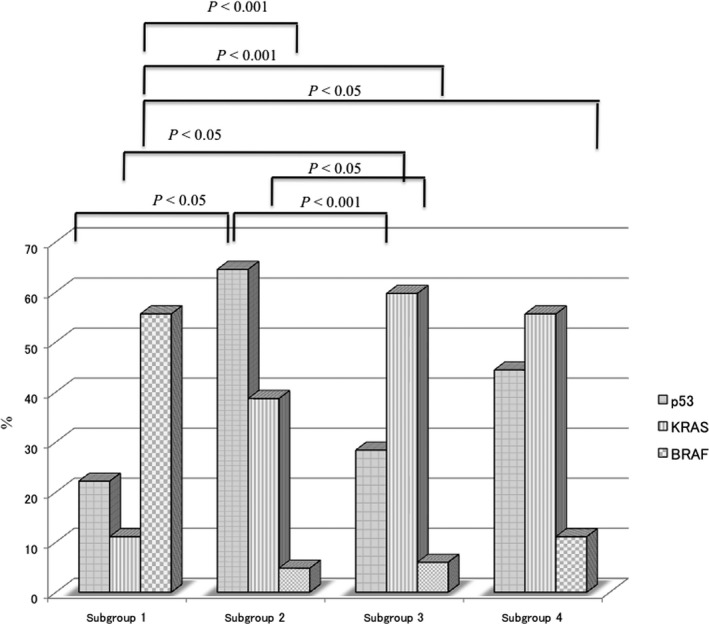
Frequencies of p53,KRAS, and BRAF mutations in subgroups stratified by hierarchical analysis.
Finally, Kaplan–Meier analysis was performed to determine and compare the cancer‐specific 5‐year survival rates. In this analysis, no patients in subgroup 1 or 4 died of CRC. On the other hand, although the survival of patients with CRC in subgroups 2 and 3 was decreased slightly, cancer‐specific patient survival was not correlated with the molecular patterns of subgroup 2 or 3. The survival curves are shown in the (Fig. S1).
Discussion
Tumor heterogeneity is known to arise through selection and expansion of different cancer cell clones bearing genetic changes (e.g., mutations, chromosomal alterations, and epigenetic changes), conferring survival and proliferative adaptability.8, 9, 25 Heterogeneity can also arise from plasticity in tumor cell behavior, which is defined by reversible phenotypic changes driven by diverse molecular changes, including chromosomal changes, microsatellite alterations, micro‐environmental factors, or therapeutic factors.8, 26 Among these factors, chromosomal changes and MSI are thought to contribute most to tumor heterogeneity.25, 26 In this work, we hypothesized that intratumor heterogeneity in CRC may be associated with a specific genetic profile, as stratified by PCR‐based microsatellite analysis. We also assessed whether the certain subclonal populations (stratified subgroups) contributed to the development of the different types of tumors.
Our analytical design was based on the two genetic markers of AI and MSI, which were independent from each other, given that the occurrence of AI (LOH) and MSI‐high phenotypes in tumors is thought to be mutually exclusive.27 While the presence or absence of MSI was used for hierarchical cluster analysis, the AI ratio was utilized to stratify the CRC specimens examined in this study. The AI ratio represented the ratio of tumor cells having AI because the isolated tumor glands consisted only of tumor cells. For example, a tumor was considered to have allelic imbalance if the allele peak ratio was ≤0.60, demonstrating that 60% of the given tumor glands had an AI.17 According to this theory, the CRCs examined in this study were expected to be stratified into some subgroups based on MSI and AI ratio; specifically, tumors with MSI‐high status, tumors with high allelic ratios, tumors with low allelic ratios, and other tumors. Tumors with high allelic ratios were characterized by acquisition of AI at the early phases of tumor development. On the other hand, tumors with low allelic ratios acquired AI during the late phases of tumor development. These contrasting subgroups may have different genetic profiles. Little has been reported on the timing of AI and MSI appearance during tumor development. Therefore, our aim was to identify an association of the timing of AI and MSI development with colorectal carcinogenesis using isolated tumor glands to examine the tumor cell ratio within the tumor tissues.
To determine the role of MSI in tumorigenesis and reconcile our findings with previous reports,20 a consensus has been reached to classify tumors into three types: MSI‐high, MSI‐low, and MSI‐negative (MSS, microsatellite stable), according to the NCI criteria previously reported by Boland et al.20 Using this classification, we found that all tumors in subgroup 1 exhibited MSI, 90% of tumors with MSI‐low status were subclassified into subgroup 2, and most tumors with MSS were assigned to subgroups 2, 3, and 4. Subgroup 1 tumors, classified as having MSI‐high status, exhibited distinct clinicopathological features, including predominant proximal location, specific histology (mucinous and poorly differentiated adenocarcinomas), no distant metastasis, and lower frequencies of venous invasion. In addition, our study showed a significantly high frequency of BRAF mutations in this subgroup, as shown in previous studies.11, 12 However, the frequency of HME in subgroup 1 was significantly different from those in the other three subgroups. The present study thus supported the hypothesis that subgroup 1 tumors, characterized by a high level of MSI, were clinicopathologically and genetically distinguishable from tumors in other subgroups.
Previous studies have shown that CIN, characterized by accumulation of multiple chromosomal alterations, such as LOH and genetic amplification (allelic imbalance), is one of the major alterations in colorectal carcinogenesis.28 In the present study, subgroup 2 tumors were characterized by acquisition of AIs at the early phases of colorectal carcinogenesis. Tumors classified into this category evolved from tumor cells with multiple AIs acquired at an early phase of colorectal carcinogenesis. Previous studies have found that tumors with the multiple accumulated AI type (similar to the CIN type) are more prevalent in CRCs.10, 11, 12, 13 In addition, this subgroup is closely associated with left‐sided location, low frequency of venous invasion, relatively high frequency of distant metastasis, and TP53 mutations.11, 12 Thus, we suggest that TP53 mutations may play a key role in the progression of tumors within this subgroup. However, comparison of the results is not straightforward because the CIN type tumors in the aforementioned studies were not stratified according to AI ratio. Accordingly, our data imply, as a novel finding for CRC, that this phenotype represents a distinct subgroup that is more prevalent in CRCs. The carcinogenic mechanism in tumors stratified as having a high AI ratio provides novel insights with which to evaluate colorectal carcinogenesis.
Although MSS is not the same molecular type as CIN, it presents a molecular concept similar to that of CIN.28 In the present study, approximately 30% of the CRCs examined were found to be genetically stable and closely associated with the occurrence of AI during the later phases of colorectal carcinogenesis. Although tumors with MSS were assigned to subgroup 3, this subgroup was not genetically equivalent to CIN given that the frequency of AI was low compared with that in subgroup 2. A previous study defined a subgroup of tumors with microsatellite and chromosomal stability, similar to the MSS status in this study, and found that 17–38% of CRCs could be classified into this subgroup.26 Accordingly, our data implied that the MSS phenotype represented a distinct subgroup stratified by AI ratio. In addition, KRAS mutations were more frequently found in subgroup 3 than in subgroups 2 and 1. This finding is relevant for the development of therapies for CRC because targeted biological agents, such as cetuximab, are influenced by KRAS mutations.29 Therefore, tumors within this subgroup may not be affected by cetuximab therapy, a promising recent development in therapeutic options for CRC.
The molecular mechanism underlying the genetically stable CRC phenotype at the genome level is not fully understood but may involve epigenetic alterations of multiple cancer‐related genes and other chromosomal alterations. There may be two types of chromosomal alterations involved in colorectal carcinogenesis: those responsible for primary and secondary alterations affecting tumor progression. This is supported by a previous study in which two types of mutations were identified in the tumor invasive area, including driver and passenger mutations,30 as well as by the suggestion that two types of AI are acquired during tumor progression: early and late AI accumulation. Our results support the occurrence of at least two types of AI accumulation during tumor progression. We believe that the markers we used in this study are closely associated with colorectal carcinogenesis.
Previous studies have shown that tumors with high methylation status (called the CpG island methylation phenotype [CIMP] in previous studies) are closely associated with MSI‐high CRC.31, 32 Thus, methylation status has been subclassified into two groups: CIMP‐high and CIM‐low.29, 33 Although most studies have used one group of classifier markers,31, 32 including original CIMP markers (the one‐panel method), Yagi and Kaneda recently used a two‐panel method22, 23 and subclassified tumors into three groups: HME, IME, and LME. According to their study, HME is strongly correlated with MSI‐high status and BRAF mutations in CRC, which is consistent with previous studies in which the one‐panel method was used. In addition, they emphasized that IME is characterized by KRAS mutations in CRCs.22, 23 However, in the present study, we did not observe a significant correlation in the frequencies of HME between subgroup 1 and the other subgroups. According to our study, IME was a common epigenetic alteration in CRCs. It is unclear why the results of epigenetic alterations differed between our study and the study by Yagi and Kaneda.22 However, the MSI‐high CRCs examined in our study may have had a heterogeneous composition in terms of methylation status.
In the present study, the minor subgroup 4 was classified into MSS category of CRC examined. This subgroup showed AI and MSI patterns intermediate to those of subgroups 2 and 3 in the present study. Although the patients in subgroup 4 demonstrated high lymphatic and venous invasion, compared with subgroup 1, no patients in subgroup 4 died of CRC. We could not characterize the subgroup 4 tumors in terms of molecular or clinicopathological findings because of the small number of cases. The role of the colorectal carcinogenesis patterns exhibited in subgroup 4 remains unknown, and further study is required to resolve this in the near future.
Previous studies have shown that the mucin phenotype of tumors is closely associated with tumorigenesis.34 In the present study, while subgroup 1 was characterized by a mixed phenotype, defined as mixed expression of gastric and intestinal mucin markers, subgroups 2 and 3 were characterized by intestinal phenotypes, including colonic type. Although the findings in subgroup 1 were consistent with previous studies,34, 35 the findings in subgroups 2 and 3 were different from previous reports.34, 35 This supports the notion that the mucin phenotype plays a specific role in a subset of CRCs.
One of the aims in classifying CRC based on molecular alterations is to determine the associations between the molecular alterations and patient survival. Recent classifications of CRC based on molecular alterations have taken into account patient survival data.4, 5, 6 In the present study, all mortalities were observed in subgroups 2 and 3, with none in subgroup 1 or 4. We could not identify an association between the proposed molecular classification and patient survival. Although the reasons for this are not well understood, one may be the small number of patients with CRC examined. We plan to identify an association between the CRC subgroup and patient survival in the near future.
Finally, we summarized the molecular subtypes proposed in this study in the (Table S1). The molecular subtype classification platforms introduced previously differed from our classification.3, 4, 5, 6 Although molecular subtypes have been characterized by genome‐wide and comprehensive analyses, our classification was separated by limited markers.3, 4, 5, 6 However, our method is unique in that it was established based on tumor cell clonal expansion determined by the AI rate, measured by PCR‐based microsatellite analysis. We believe that our classification method will help with the evaluation of colorectal carcinogenesis.
In conclusion, we designated novel genetic profiles for CRC that were stratified based on MSI status and AI ratio, obtained using PCR‐based microsatellite analysis. These findings support the presence of unique genetic pathways for colorectal carcinogenesis. Thus, separation of CRCs based on MSI and AI ratio is an effective first step for simplified dissection of these three or four different pathways for colorectal carcinogenesis in the future.
Conflict of Interest
We declare that we have no conflicts of interest.
Supporting information
Fig. S1. Kaplan–Meier survival analyses of patients with CRC in subgroups 1, 2, 3, and 4 (log‐rank test).
Table. S1. Summary of molecular classification systems for colorectal cancer.
Acknowledgments
We gratefully acknowledge the technical assistance of Ms. E. Sugawara and Mr. T. Kasai. We also thank members of the Department of Molecular Diagnostic Pathology, Iwate Medical University for their support.
Cancer Sci 108 (2017) 427–434
Funding Information
No sources of funding were declared for this study.
References
- 1. Reinert T, Schøler LV, Thomsen R et al Analysis of circulating tumour DNA to monitor disease burden following colorectal cancer surgery. Gut 2016; 65: 625–34. [DOI] [PubMed] [Google Scholar]
- 2. Loo LW, Tiirikainen M, Cheng I et al Integrated analysis of genome‐wide copy number alterations and gene expression in microsatellite stable, CpG island methylator phenotype‐negative colon cancer. Genes Chromosom Cancer 2013; 52: 450–66. [DOI] [PMC free article] [PubMed] [Google Scholar]
- 3. Cancer Genome Atlas Network . Comprehensive molecular characterization of human colon and rectal cancer. Nature 2012; 487: 330–7. [DOI] [PMC free article] [PubMed] [Google Scholar]
- 4. Guinney J, Dienstmann R, Wang X et al The consensus molecular subtypes of colorectal cancer. Nat Med 2015; 21: 1350–6. [DOI] [PMC free article] [PubMed] [Google Scholar]
- 5. Müller MF, Ibrahim AE, Arends MJ. Molecular pathological classification of colorectal cancer. Virchows Arch 2016; 469: 125–34. [DOI] [PMC free article] [PubMed] [Google Scholar]
- 6. Sadanandam A, Lyssiotis CA, Homicsko K et al A colorectal cancer classification system that associates cellular phenotype and responses to therapy. Nat Med 2013; 19: 619–25. [DOI] [PMC free article] [PubMed] [Google Scholar]
- 7. Humphries A, Wright NA. Colonic crypt organization and tumorigenesis. Nat Rev Cancer 2008; 8: 415–24. [DOI] [PubMed] [Google Scholar]
- 8. Pereira L, Mariadason JM, Hannan RD, Dhillon AS. Implications of epithelial‐mesenchymal plasticity for heterogeneity in colorectal cancer. Front Oncol 2015; 5: 13. [DOI] [PMC free article] [PubMed] [Google Scholar]
- 9. Fey MF, Tobler A. Tumour heterogeneity and clonality–an old theme revisited. Ann Oncol 1996; 7: 121–8. [DOI] [PubMed] [Google Scholar]
- 10. Lengauer C, Kinzler KW, Vogelstein B. Genetic instability in colorectal cancers. Nature 1997; 386: 623–7. [DOI] [PubMed] [Google Scholar]
- 11. Jass JR, Whitehall VL, Young J, Leggett BA. Emerging concepts in colorectal neoplasia. Gastroenterology 2002; 123: 862–76. [DOI] [PubMed] [Google Scholar]
- 12. Ogino S, Goel A. Molecular classification and correlates in colorectal cancer. J Mol Diagn 2008; 10: 13–27. [DOI] [PMC free article] [PubMed] [Google Scholar]
- 13. Sugai T, Nakamura S, Habano W et al Analysis of subclonal expansion of colorectal carcinomas using flow cytometry. Virchows Arch 1999; 434: 437–41. [DOI] [PubMed] [Google Scholar]
- 14. Sugai T, Takahashi H, Habano W et al Analysis of genetic alterations, classified according to their DNA ploidy pattern, in the progression of colorectal adenomas and early colorectal carcinomas. J Pathol 2003; 200: 168–76. [DOI] [PubMed] [Google Scholar]
- 15. Sugai T, Habano W, Jiao Y‐F et al Analysis of allelic imbalances at multiple cancer‐related chromosomal loci and microsatellite instability within the same tumor using a single tumor gland from colorectal carcinomas. Int J Cancer 2005; 114: 337–45. [DOI] [PubMed] [Google Scholar]
- 16. Japanese Society for Cancer of the Colon and Rectum . Japanese Classification of Colorectal Carcinoma, 2nd English edn Tokyo: Kanehara Co., 2009; 30–63. [Google Scholar]
- 17. Habano W, Sugai T, Nakamura S, Yoshida T. A novel method for gene analysis of colorectal carcinomas using a crypt isolation technique. Lab Invest 1996; 74: 933–40. [PubMed] [Google Scholar]
- 18. Sugai T, Habano W, Uesugi N et al Three independent genetic profiles based on mucin expression in early differentiated‐type gastric cancers ‐ a new concept of genetic carcinogenesis of early differentiated‐type adenocarcinomas. Mod Pathol 2004; 17: 1223–34. [DOI] [PubMed] [Google Scholar]
- 19. Sugai T, Inomata M, Uesugi N et al Analysis of mucin, p53 protein and Ki‐67 expressions in gastric differentiated‐type intramucosal neoplastic lesions obtained from endoscopic mucosal resection samples: a proposal for a new classification of intramucosal neoplastic lesions based on nuclear atypia. Pathol Int 2004; 54: 425–35. [DOI] [PubMed] [Google Scholar]
- 20. Boland CR, Thibodeau SN, Hamilton SR et al A National Cancer Institute Workshop on Microsatellite Instability for cancer detection and familial predisposition: development of international criteria for the determination of microsatellite instability in colorectal cancer. Cancer Res 1998; 58: 5248–57. [PubMed] [Google Scholar]
- 21. Yamamoto E, Suzuki H, Yamano HO et al Molecular dissection of premalignant colorectal lesions reveals early onset of the CpG island methylator phenotype. Am J Pathol 2012; 181: 1847–61. [DOI] [PubMed] [Google Scholar]
- 22. Yagi K, Takahashi H, Akagi K, Matsusaka K et al Intermediate methylation epigenotype and its correlation to KRAS mutation in conventional colorectal adenoma. Am J Pathol 2012; 180: 616–25. [DOI] [PubMed] [Google Scholar]
- 23. Kaneda A, Yagi K. Two groups of DNA methylation markers to classify colorectal cancer into three epigenotypes. Cancer Sci 2011; 102: 18–24. [DOI] [PubMed] [Google Scholar]
- 24. Sugai T, Habano W, Nakamura S, Uesugi N, Sasou S, Itoh C. A unique method for mutation analysis of tumor suppressor genes in colorectal carcinomas using a crypt isolation technique. Arch Pathol Lab Med 2000; 124: 382–6. [DOI] [PubMed] [Google Scholar]
- 25. Meacham CE, Morrison SJ. Tumour heterogeneity and cancer cell plasticity. Nature 2013; 501: 328–37. [DOI] [PMC free article] [PubMed] [Google Scholar]
- 26. Losi L, Baisse B, Bouzourene H, Benhattar J. Evolution of intratumoral genetic heterogeneity during colorectal cancer progression. Carcinogenesis 2005; 26: 916–22. [DOI] [PubMed] [Google Scholar]
- 27. Arcila M, Lau C, Nafa K, Ladanyi M. Detection of KRAS and BRAF mutations in colorectal carcinoma roles for high‐sensitivity locked nucleic acid‐PCR sequencing and broad‐spectrum mass spectrometry genotyping. J Mol Diagn 2011; 13: 64–73. [DOI] [PMC free article] [PubMed] [Google Scholar]
- 28. Sugai T, Habano W, Nakamura S et al Genetic alterations in DNA diploid, aneuploid and multiploid colorectal carcinomas identified by the crypt isolation technique. Int J Cancer 2000; 88: 614–9. [DOI] [PubMed] [Google Scholar]
- 29. Li W, Shi Q, Wang W, Ren J, Li Q, Hou F. KRAS status and resistance to epidermal growth factor receptor tyrosine‐kinase inhibitor treatment in patients with metastatic colorectal cancer: a meta‐analysis. Colorectal Dis 2014; 16: O370–8. [DOI] [PubMed] [Google Scholar]
- 30. Pon JR, Marra MA. Driver and passenger mutations in cancer. Annu Rev Pathol 2015; 10: 25–50. [DOI] [PubMed] [Google Scholar]
- 31. Toyota M, Ahuja N, Ohe‐Toyota M, Herman JG, Baylin SB, Issa JP. CpG island methylator phenotype in colorectal cancer. Proc Natl Acad Sci USA 1999; 96: 8681–6. [DOI] [PMC free article] [PubMed] [Google Scholar]
- 32. Shen L, Toyota M, Kondo Y et al Integrated genetic and epigenetic analysis identifies three different subclasses of colon cancer. Proc Natl Acad Sci USA 2007; 104: 18654–9. [DOI] [PMC free article] [PubMed] [Google Scholar]
- 33. Silla IO, Rueda D, Rodríguez Y, García JL, de la Cruz Vigo F, Perea J. Early‐onset colorectal cancer: a separate subset of colorectal cancer. World J Gastroenterol 2014; 20: 17288–96. [DOI] [PMC free article] [PubMed] [Google Scholar]
- 34. Walsh MD, Clendenning M, Williamson E et al Expression of MUC2, MUC5AC, MUC5B, and MUC6 mucins in colorectal cancers and their association with the CpG island methylator phenotype. Mod Pathol 2013; 26: 1642–56. [DOI] [PubMed] [Google Scholar]
- 35. Jass JR. HNPCC and sporadic MSI‐H colorectal cancer: a review of the morphological similarities and differences. Fam Cancer 2004; 3: 93–100. [DOI] [PubMed] [Google Scholar]
Associated Data
This section collects any data citations, data availability statements, or supplementary materials included in this article.
Supplementary Materials
Fig. S1. Kaplan–Meier survival analyses of patients with CRC in subgroups 1, 2, 3, and 4 (log‐rank test).
Table. S1. Summary of molecular classification systems for colorectal cancer.


