

Summary
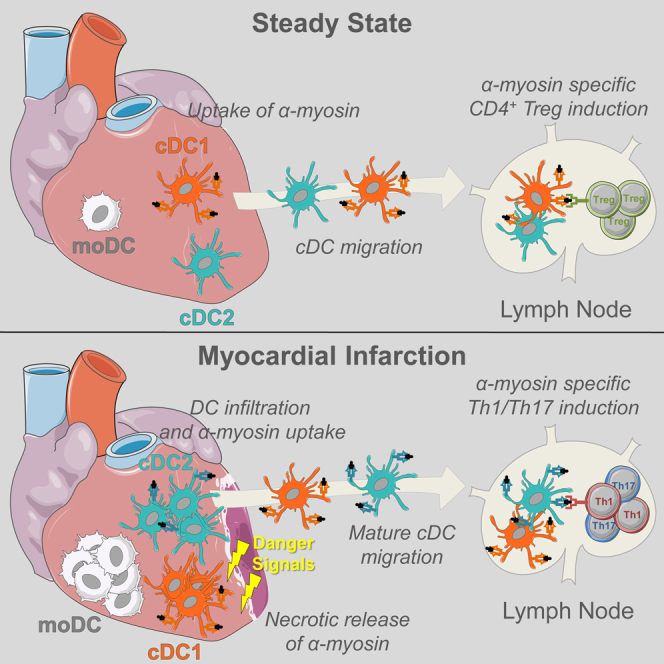
Peripheral tolerance is crucial for avoiding activation of self-reactive T cells to tissue-restricted antigens. Sterile tissue injury can break peripheral tolerance, but it is unclear how autoreactive T cells get activated in response to self. An example of a sterile injury is myocardial infarction (MI). We hypothesized that tissue necrosis is an activator of dendritic cells (DCs), which control tolerance to self-antigens. DC subsets of a murine healthy heart consisted of IRF8-dependent conventional (c)DC1, IRF4-dependent cDC2, and monocyte-derived DCs. In steady state, cardiac self-antigen α-myosin was presented in the heart-draining mediastinal lymph node (mLN) by cDC1s, driving the proliferation of antigen-specific CD4+ TCR-M T cells and their differentiation into regulatory cells (Tregs). Following MI, all DC subsets infiltrated the heart, whereas only cDCs migrated to the mLN. Here, cDC2s induced TCR-M proliferation and differentiation into interleukin-(IL)-17/interferon-(IFN)γ-producing effector cells. Thus, cardiac-specific autoreactive T cells get activated by mature DCs following myocardial infarction.
Keywords: dendritic cell, heart, tolerance, autoimmunity, myocardial infarction, tissue necrosis, IRF4, IRF8, cardiac myosin, gene expression
Graphical Abstract
Highlights
-
•
IRF8+ cDC1, IRF4+ cDC2, moDCs, and macrophages are the APCs of the murine heart
-
•
Self-antigen presentation in the steady state drives Treg development via cDC1s
-
•
Myocardial infarction promotes infiltration, activation, and maturation of all DCs
-
•
Myocardial infarction promotes priming of Th1/Th17 autoreactive T cells via cDC2s
Van der Borght et al. demonstrate that myocardial infarction induces the priming of autoreactive CD4+ T cells specific for cardiac self-antigen α-myosin in the heart-draining lymph node through the maturation and migration of conventional dendritic cells. Using ex vivo co-culture systems, cDC2s are shown to be superior in presenting α-myosin.
Introduction
Autoreactive CD4+ T cells are normally deleted during thymic negative selection, yet many self-reactive T cells escape this checkpoint, emerging as anergic, thymic regulatory (tTreg) or ignorant conventional T cells (Tconv) (Davis, 2015). Self-reactive T cell activation is a major culprit in autoimmune disease, and therefore tolerance to some tissue-restricted self-antigens is shaped entirely by extrathymic processes. Suppression of autoreactive CD4+ T cells is dependent on peripheral dendritic cells (DCs), which present tissue-restricted self-antigens derived mostly from turnover of apoptotic cells (Steinman et al., 2003). In the absence of inflammation, self-antigen presentation by DCs results in T cell anergy, further expansion of tTregs, or generation of induced (i)Tregs from Tconv cells, thus promoting peripheral tolerance to the self-antigen (Ganguly et al., 2013). Lack of steady-state DCs results in loss of functional Tregs and subsequent activation of autoreactive Th1/Th17 effector cells, whereas increased numbers of immature DCs result in increased iTreg numbers, which prevent autoimmunity (Ohnmacht et al., 2009, Darrasse-Jèze et al., 2009). It is, however, equally important that DCs presenting self-antigen remain in a quiescent state, devoid of cytokine production that can break peripheral tolerance (Eriksson et al., 2003, Ardouin et al., 2016). Removal of inhibitory nuclear factor (NF)-κB signaling intermediates or artificial extension of DC life-span are sufficient to break self-tolerance (Kool et al., 2011, Stranges et al., 2007). Despite experiments clearly implicating DCs in the regulation of peripheral tolerance and induction of autoimmunity, the precise triggers that cause DC activation and possibly break self-tolerance are incompletely understood (Ganguly et al., 2013). Certain organ-directed infections trigger tissue-specific autoimmunity by promoting DC activation either through direct infection or release of cytokines that cause full DC maturation (Gangaplara et al., 2012, Torchinsky et al., 2009). Endogenous danger signals like uric acid or HMGB1 lead to DC maturation in response to sterile tissue injury (Scaffidi et al., 2002). Exposure of DCs to necrotic cells is sufficient to drive DC maturation in vitro (Gallucci et al., 1999). But currently, it is not known if sterile inflammation induced by tissue ischemia and necrosis causes DCs to drive the initiation of adaptive immune responses to self-antigen in vivo.
To address this, we chose a model of myocardial infarction (MI). Undoubtedly, tissue necrosis caused by coronary artery occlusion is one of the most common diseases of Western society, causing significant mortality and morbidity (Latet et al., 2015). MI results in necrotic cardiomyocytes releasing their intracellular contents, which act as danger signals that cause sterile inflammation (Zhang et al., 2015). In healthy mice and humans, CD4+ T cells specific for cardiac self-antigen α-myosin heavy chain (αMyHC) escape thymic negative selection and seed the periphery, rendering the heart vulnerable to an autoimmune attack (Lv et al., 2011). Up to 30% of MI patients develop signs of humoral autoimmunity that is often self-limiting but can be accompanied by pericarditis. This percentage increases to 80% of autoimmune prone type I diabetes (T1D) patients. Nonobese diabetic (NOD) mice, a mouse model of T1D, also develop pathologic cardiac autoimmunity post MI, whereas wild-type (WT) C57BL/6 mice do not (Gottumukkala et al., 2012, Lipes and Galderisi, 2015). Environmental cues from an infarcted heart are thus sufficient to induce heart-specific immunity in autoimmune prone hosts in the absence of microbial ligands. It was hypothesized before that the innate inflammatory response in the infarcted heart can initiate the maturation of DCs, licensing them for activation of T cells directed against the heart (Gottumukkala et al., 2012, Lv and Lipes, 2012); however, direct evidence of this DC-T cell interaction post MI is lacking. To study if danger signals released by tissue injury can activate DCs and generate adaptive immunity, TCR transgenic mice (TCR-M) have been developed to measure CD4+ T cell responses to αMyHC (Nindl et al., 2012). Using these tools, we studied if, where, and how cardiac self-antigens are presented. In steady state, conventional type 1 DCs (cDC1s) presented cardiac self-antigen to αMyHC-specific TCR-M cells only in heart-draining mediastinal lymph nodes, leading to Treg expansion. In mice in which MI was induced, cardiac DCs were activated and in vivo αMyHC presentation was increased. Post MI, mainly conventional type 2 DCs (cDC2s) presented αMyHC and induced the formation of interferon (IFN)γ- and interleukin (IL)-17-producing TCR-M cells. These findings show that tissue necrosis activates autoreactive T cells through DC maturation and migration.
Results
CD11c-Expressing Cells in the Heart Can Be Subdivided into cDC1s, cDC2s, and moDCs
Conventional DCs, which form the crucial link between innate and adaptive immunity, are divided into two subsets termed cDC1s and cDC2s (Guilliams et al., 2014). cDCs arise in a Flt3L-dependent manner from progenitors in the bone marrow (Waskow et al., 2008), and are divided based on surface markers and differential dependence on transcription factors (TFs) (Sichien et al., 2017). cDC1s express XCR1 and CD103 and depend on Batf3 and IRF8, whereas cDC2s express CD172α (SIRPα) and CD11b and partially depend on Zeb2 and IRF4 (Bajaña et al., 2012, Scott et al., 2016). Because DC subsets in the murine heart are poorly defined, we characterized subsets in the healthy heart. We used flow cytometry to identify CD11c+ cells among live non-autofluorescent CD45+ Lineage− cells. These were further divided based on MHCII and CD64 to identify MHCII+CD64− cDCs and CD64+MHCII+ monocyte-derived DCs (moDCs) (Figure 1A). Embryonically derived macrophages (MFs) were outgated because these cells are autofluorescent and do not express CD11c (Molawi et al., 2014, Epelman et al., 2014). cDCs can be further subdivided into XCR-1+ cDC1s and CD172α+ cDC2s, whereas moDCs uniformly expressed CD172α. CD11c+ cells made up 0.98% ± 0.27% (mean ± SEM) of all living heart cells and 7.39% ± 1.36% of CD45+ leukocytes. cDC1s and cDC2s made up 4.77% ± 0.16% and 14.5% ± 1.25% of total CD11c-expressing cells, respectively, whereas 16.87% ± 3.09% of CD11c+ cells were moDCs (Figures 1B and 1C). cDC development depends on Flt3L, whereas moDC development does not (Waskow et al., 2008). So to confirm cDC and moDC identification, hearts of Flt3l−/− mice were compared with Flt3+/+ hearts. We found a severe reduction in cDC1s and cDC2s in the Flt3l−/− heart compared with WT mice, whereas moDCs were unaffected (Figures 1D and 1E), demonstrating that only heart cDCs are Flt3L dependent. We next examined the expression of surface markers associated with DC subsets (Figures 1F and 1G). Cardiac cDC subsets expressed the typical cDC markers CD26 (Miller et al., 2012) and Flt3. As described in other tissues, cDC2s and moDCs expressed CD11b, whereas cDC1s expressed CD103. cDC1s uniformly expressed CD24, whereas cDC2s were separated into CD24+ and CD24− cDC2s, as described for lung cDC2s (Bajaña et al., 2016). Expression of CADM1, a universal cDC1 marker (Guilliams et al., 2016, Gurka et al., 2015), was restricted to cDC1s. MoDCs expressed the typical MF markers MerTK, Mar-1, and F4/80, although some F4/80 expression was also noted on cDC2s, as found in other tissues (Tamoutounour et al., 2013). As expected, moDCs expressed CCR2, which is critical for monocyte exit from the bone marrow. CCR2 was also expressed on cDCs, as observed in intestinal cDC2s (Scott et al., 2015).
Figure 1.

CD11c-Expressing Cells in the Heart Can Be Subdivided into cDC1s, cDC2s, and moDCs
(A) Flow cytometry gating strategy for DC subsets in steady-state heart of WT mice.
(B) Pie chart representing the distribution of DC subsets in naive murine WT heart.
(C) DC subset percentages of total CD11c+ cells in naive heart of WT mice.
(D) Expression of MHCII and CD64 in CD45+Lineage−CD11c+ cells from naive heart in Flt3l+/+ and Flt3l−/− mice.
(E) Total cDC, cDC1, cDC2, and moDC percentages of total living cells in naive heart of Flt3l+/+ and Fltl3−/− mice.
(F) Representative histograms of CD26, Flt3, CD11b, CD103, CD24, CADM1, MerTK, Mar-1, CCR2, and F4/80 expression in steady-state WT heart cDC1s, cDC2s, and moDCs (n = 3).
(G) MFI of marker expression on steady-state WT heart DC subsets shown in (F).
(H and I) Heat map of relative expression of (H) hallmark cDC1 genes and (I) hallmark cDC2 genes in cDC1s, cDC2s, moDCs, and MFs sorted from naive WT hearts acquired by RNA-seq. All data in Figure 1 represent at least two independent experiments, and all bar graphs show data as mean ± SEM (∗p ≤ 0.05).
We next FACS-purified cDC1s, cDC2s, moDCs, and CD11c− MFs from a steady-state heart and performed RNA-sequencing (RNA-seq) analysis (Figures 1H and 1I). To confirm identification of heart cDC1s and cDC2s, we generated a list of hallmark genes across a range of tissues by examining the transcriptomes of cDC subsets available from the Immgen consortium. Gene expression in cardiac APC populations was then studied. Cardiac cDC1s indeed expressed cDC1 genes, including Clec9a, Cadm1, Itgae, Tlr3, and Irf8, whereas these genes were lowly expressed by cardiac cDC2s, moDCs, and MFs (Figure 1H). cDC2 genes like Cd11b, Cd72, Csf1r, Zeb2, and Irf4 were highly expressed by cardiac cDC2s compared with cDC1s (Figure 1I). Taken together, these data highlight the previously unappreciated heterogeneity among cardiac DCs.
Transcription Factor Dependency of Cardiac cDC Subsets
The molecular requirements for cardiac DC development have been poorly studied. Because cDC1s and cDC2s in other tissues are thought to depend on IRF8 and IRF4, respectively (Mildner and Jung, 2014), we hypothesized that this would be the same for cardiac cDCs. Therefore, we first examined IRF8 and IRF4 expression in cardiac DCs at the protein level (Figures 2A and 2B). IRF4 was most highly expressed by cardiac cDC2s, whereas cDC1s expressed high levels of IRF8. Next, we crossed mice expressing CRE recombinase under the control of the CD11c promoter (Cd11cCre mice) (Caton et al., 2007) with Irf4flox (Persson et al., 2013) or Irf8flox mice (Sichien et al., 2016) to generate mice lacking IRF4 or IRF8 expression, respectively, in CD11c+ cells. Whenever CRE was expressed in CD11c+ cells, Irf4 or Irf8 was efficiently floxed out and their protein levels declined (data not shown). Analysis of Irf4fl/fl.Cd11cCre mice revealed that cardiac cDC2 (CD172α+CD24+/−) were only slightly reduced (Figures 2C and 2E). However, a significant reduction in CD24+ cDC2s was observed, suggesting that IRF4 is important for their terminal differentiation, as described in the lung (Bajaña et al., 2016). Because IRF4 has also been implicated in regulating cDC2 migration (Bajaña et al., 2012), we next studied cDC2 frequency in the heart-draining mediastinal lymph node (mLN) (Figures 2D and 2E). Migration of both CD24+ and CD24− cDC2s was indeed lower in the mLN of Irf4fl/fl.Cd11cCre mice. Examination of cDC subsets in the heart and mLN of Irf8fl/fl.Cd11cCre mice demonstrated an almost complete ablation of cDC1s (CD24+CD172α−) in both locations (Figures 2F–2H). cDC2s were unaffected in the Irf8fl/fl.Cd11cCre heart, but were significantly increased in the mLN. Thus, cardiac cDC1s and cDC2s, similarly to their counterparts in other organs, depend on IRF8 and IRF4, respectively, for their development (cDC1s and CD24+ cDC2s) and migration to the lymph nodes (LNs) (cDC2s). Thus, Irf8fl/fl.Cd11cCre and Irf4fl/fl.Cd11cCre mice represent two models in which cardiac cDC1 and cDC2 function, respectively, can be assessed.
Figure 2.

Transcription Factor Dependency of Cardiac cDC Subsets
(A) Representative histogram of IRF4 and IRF8 expression of steady-state WT heart cDC1s, cDC2s, and moDCs.
(B) MFI of IRF4 and IRF8 expression on naive WT heart DC subsets shown in (A).
(C and D) MHCII+CD11c+CD64− cDCs are divided into CD24+CD172α− cDC1s, CD24+CD172α+ cDC2s, and CD24−CD172α+ cDC2s in Irf4fl/fl and Irf4fl/fl.Cd11cCre steady-state heart (C) and mediastinal LN (D).
(E) Percentage of living cells of cDCs in Irf4fl/fl and Irf4fl/fl.Cd11cCre naive heart and mLN.
(F and G) MHCII+CD11c+CD64− cDCs are divided into CD24+CD172α− cDC1s, CD24+CD172α+ cDC2s, and CD24−CD172α+ cDC2s in Irf8fl/fl and Irf8fl/fl.Cd11cCre steady-state heart (F) and mLN (G).
(H) Percentage of living cells of cDCs in Irf8fl/fl and Irf8fl/fl.Cd11cCre steady-state heart and mLN. All data in Figure 2 represent at least two independent experiments, and all bar graphs show data as mean ± SEM (∗p ≤ 0.05).
IRF8-Dependent cDC1s Generate Myosin-Specific Tregs in Heart-Draining Lymph Node
Although the heart is not continuously exposed to environmental antigens compared with mucosal surfaces, heart DCs can encounter cardiac self-antigens, such as α-myosin heavy chain (αMyHC). Because αMyHC autoreactive CD4+ T cells escape from the thymus into the periphery (Lv et al., 2011), it is plausible that cardiac DCs would function in preserving peripheral tolerance to the heart. Thus, we next examined if cardiac cDC1s or cDC2s played such a role. A critical tool to answer this key question was αMyHC-specific TCR-M mice (Nindl et al., 2012). Naive CD62L+CD44− CD4+ T cells were purified from TCR-M splenocytes, CFSE labeled, and injected into steady-state WT littermates (Irf4fl/fl and Irf8fl/fl mice without Cd11cCre expression) to determine if and where αMyHC is presented. Various lymphoid organs of acceptor mice were collected for analysis 3 days after TCR-M transfer. Undivided TCR-M cells were present in all organs examined, consistent with the migratory behavior of naive T cells (Figures 3A and 3D). TCR-M proliferation detected by CFSE dilution and CD44 expression was exclusively observed in the heart-draining mediastinal LN of naive WT mice. TCR-M proliferation and activation in mLN demonstrated αMyHC transport and presentation without the presence of cardiac damage (Figures 3B and 3E). Upon division, TCR-M cells gained expression of T-bet and RoRγt, respectively, and TFs for Th1 and Th17 cells (Figures 3C and 3F). Divided cells also expressed Foxp3 and CD25 indicative for Tregs (Figures 3C and 3F). To verify if migratory cDC2s were responsible for αMyHC presentation in mLN, naive TCR-M cells were injected in Irf4fl/fl.Cd11cCre mice. TCR-M cells in Irf4fl/fl.Cd11cCre mLN proliferated equally well as in WT littermates, indicating that cDC2 migration is not necessary for αMyHC presentation (Figures 3A and 3B). T-bet, RoRγt, and Foxp3 increase upon division was unchanged in Irf4fl/fl.Cd11cCre mLN compared with Irf4fl/fl (Figure 3C). Naive TCR-M cells were next administered to Irf8fl/fl.Cd11cCre mice to study if cDC1s were responsible for steady-state αMyHC presentation. Proliferation and CD44 expression was significantly lower in mLN of Irf8fl/fl.Cd11cCre mice compared with Irf8fl/fl mice 3 days post-transfer (Figures 3D and 3E). Although T-bet and RoRγt upregulation in divided TCR-M cells was not altered in Irf8fl/fl.Cd11cCre mLN (Figure 3F), Foxp3 induction was significantly reduced in divided TCR-M cells from Irf8fl/fl.Cd11cCre mLN, showing a block in iTreg generation in the absence of cDC1s. Our findings identify cardiac cDC1s as necessary for αMyHC-specific Treg induction from naive TCR-M cells.
Figure 3.

IRF8-Dependent cDC1s Generate Myosin-Specific Tregs in Heart-Draining Lymph Node
(A) Depicted LNs and spleen were isolated from TCR-M acceptor Irf4fl/fl and Irf4fl/fl.Cd11cCre mice 3 days after naive TCR-M transfer. CFSE dilution and CD44 expression of donor TCR-M cells was analyzed by flow cytometry.
(B) Percentage of proliferation and CD44 expression of donor TCR-M cells in LNs and spleen from the experiment described in (A) (n = 4).
(C) Percentage of T-bet, RoRγt, and Foxp3/CD25 expression on undivided and divided donor TCR-M cells isolated from mLN in Irf4fl/fl and Irf4fl/fl.Cd11cCre steady-state mice (n = 4).
(D) 3 days after naive TCR-M injection, depicted LNs and spleen were isolated from TCR-M acceptor Irf8fl/fl and Irf8fl/fl.Cd11cCre mice. CFSE dilution and CD44 expression of donor TCR-M cells was analyzed by flow cytometry.
(E) Percentage of proliferation and CD44 expression of donor TCR-M cells in LNs and spleen from the experiment described in (D) (n = 5).
(F) Percentage of T-bet, RoRγt, and Foxp3/CD25 expression on undivided and divided donor TCR-M cells isolated from mLN in Irf8fl/fl and Irf8fl/fl.Cd11cCre steady-state mice (n = 5). All data in Figure 3 represent at least three independent experiments, and bar graphs show data as mean ± SEM (∗p ≤ 0.05).
DCs Infiltrate the Heart and Migrate to the Mediastinal Lymph Node Following MI
MI triggers an inflammatory response characterized by infiltration of innate immune cells (Latet et al., 2015). Although infiltration of DCs has been described in infarcted hearts (Maekawa et al., 2009), DC subsets have not been identified. Thus, we first sought to characterize DC subsets post MI. We induced MI in WT female mice by permanently ligating the left anterior descending (LAD) coronary artery and examined DCs at various time points post-surgery. Consistent with previous reports, the proportion of CD11c+ cells was increased compared with sham-operated controls (Figure 4A). A significant part of CD11c+ cells in MI hearts was CD64+MHCII−. These cells were not further analyzed because they lacked MHCII expression. They are probably MFs recruited due to MI, as seen in other sterile inflammation models (Zigmond et al., 2014). At day 7 post-surgery, we also observed a dramatic increase in moDCs (CD64+CD172α+) in MI hearts compared to sham (Figures 4A and 4B). Analysis of DC subsets between 2 and 10 days post MI revealed an increase of all subsets by day 2 post MI, with the peak of XCR-1+ cDC1 and moDC infiltration at day 7. CD172α+ cDC2 numbers peaked at day 5 post MI. moDCs contributed most to the total infarcted heart DC population. All subsets returned to near baseline levels within 10 days (Figures 4B and 4C). Next, we studied migration to the heart-draining mediastinal LN post MI. Typically, DCs that have migrated to the LN from the periphery are MHCIIhi, in contrast to LN-resident DCs that are MHCIIint. An increase in MHCIIhi DCs was observed in mediastinal, but not mesenteric, LNs 7 days post MI compared with sham (Figures 4D and 4E). Among MHCIIhi DCs, we identified XCR-1+ cDC1s, CD172α+ cDC2s, and CD64+ moDCs. We followed DC migration to the mediastinal LN between 2 and 10 days post-surgery (Figures 4F and 4G). Consistent with heart DC infiltration, MHCIIhi DC subsets peaked at day 7 post MI. MHCIIhi cDC2s represented the largest DC population. To validate if DCs had indeed migrated from the heart, we examined CCR7 expression, the chemokine receptor required for migration to the LN (Ohl et al., 2004). As expected, MHCIIhi cDC1s and cDC2s expressed CCR7 and hence migrated to the LN, whereas MHCIIint cDCs lacked CCR7 (Figure 4H). However, MHCIIhi moDCs did not express CCR7, suggesting that moDCs have not migrated from the heart and instead have merely upregulated MHCII, as has been reported (Tamoutounour et al., 2013).
Figure 4.

DCs Infiltrate the Heart and Migrate to Mediastinal Nodes Following MI
(A) Representative gating strategy for DC subsets in the heart of sham-operated and infarcted WT mice on day 7 post-surgery.
(B) Absolute cell numbers of DC subsets in the heart of sham-operated and infarcted mice on day 2, 5, 7, and 10 post-surgery (n = 3–6).
(C) Pie charts depicting the distribution of DC subsets in the sham-operated heart (pooled data from day 2-5-7-10 post-surgery) and infarcted heart on day 2, 5, 7, and 10 post-MI. Pie chart sizes are proportional to total cardiac DC percentages.
(D) Representative gating strategy for MHCIIint and MHCIIhi DCs in mediastinal LN of sham-operated and infarcted WT mice on day 7 post-surgery.
(E) MHCIIhi DC percentages of total living cells in mediastinal and mesenteric LN in sham-operated and infarcted mice at day 7 post-surgery (n = 6).
(F) MHCIIhi DC subset percentages of total living cells in mediastinal LN of sham-operated and infarcted mice on day 2, 5, 7, and 10 post-surgery (n = 3–6).
(G) Pie chart illustrating distribution of cDC1s, cDC2s, and moDCs among total MHCIIhi DC population in mLN in sham-operated and infarcted mice at day 2, 5, 7, and 10 post-surgery. Pie chart sizes are proportional to total MHCIIhi DCs in mLN.
(H) Representative histogram of CCR7 expression of MHCIIhi cDC1s, MHCIIhi cDC2s, MHCIIhi moDCs, and MHCIIint cDCs from mLN on day 7. All bar graphs in Figure 4 show data as mean ± SEM (∗p ≤ 0.05; ∗∗p ≤ 0.01), and all data are representative of two independent experiments.
DCs from Infarcted Heart Have an Activated Phenotype
To gain more insight in the phenotype of DCs infiltrating the infarcted heart, we performed RNA-seq on heart cDC1s, cDC2s, and moDCs sorted from post MI day 7 hearts. As a reference population, we also sorted cardiac CD11c− MFs (Lineage−CD11c−MHCII+CD64+CD172α+). Unsupervised principle-component analysis (PCA) showed that irrespective of the heart tissue environment (steady state or MI), cardiac DCs clustered by subset on principal components 1 (pc1) and 2 (pc2) (Figure 5A). Also, expression of hallmark cDC1 (Figure 5B) and cDC2 genes (Figure 5C) did not change in cardiac DCs post MI. Interestingly, pc3 divided cell subsets into two groups, those deriving from the steady state or infarcted heart (Figure 5D), suggesting a global MI signature, which was conferred upon the subsets post MI. To further examine the MI signature, gene expression of infarcted heart DCs was compared with that of steady-state heart DCs to identify differentially expressed genes (DEGs). We found that 395, 700, and 326 genes were differentially expressed in cDC1s, cDC2s, and moDCs, respectively, between healthy and infarcted hearts (Figure 5E; Tables S1–S3). To determine the global MI signature, we assessed which DEGs were conserved between DC subsets and found that 54 genes were differentially expressed in the three DC subsets (Figures 5E and 5F; Table S4). Analysis of these 54 genes suggested that DC subsets would be altered in their activation status. Htr7 (encoding serotonin receptor 5-HT7R) and Mmp14 (encoding metalloproteinase MMP-14) were both upregulated in MI and are linked to DC migration (Figures 5F and 5G; complete DEG lists can be found in the Supplemental Information; Tables S5–S7) (Holst et al., 2015, Gawden-Bone et al., 2010). Smpdl3b (encoding sphingomyelin phosphodiesterase, acid-like 3B) was downregulated and encodes a negative regulator of TLR signaling (Heinz et al., 2015), suggesting increased TLR signaling in post MI DCs. Recently, several gene clusters were found to be induced upon homeostatic or TLR-induced cDC1 maturation (Ardouin et al., 2016). We observed that cDC1s from MI hearts were enriched for genes upregulated by TLR-induced maturation, suggesting that cDC1s in infarcted hearts were indeed induced to mature in a TLR-dependent manner (Figures S1A and S1D). cDC2s and moDCs from MI hearts were enriched in genes upregulated by TLR-induced and homeostatic maturation (Figures S1B S1D).
Figure 5.

DCs from Infarcted Heart Have an Activated Phenotype
(A) Front view of PCA of RNA-seq data from cDC1s, cDC2s, moDCs, and MFs in the steady-state (St St) and the infarcted (MI d7) heart. PCA was calculated using the top 15% most varying genes between cell subsets. Each dot symbolizes one independently sorted replicate of the indicated cell population, and four independent sorts were performed per subset.
(B and C) Heat map of relative expression of hallmark cDC1 genes (B) and hallmark cDC2 genes (C) in cDC1s, cDC2s, moDCs, and MFs sorted from steady-state and infarcted hearts.
(D) Side view of PCA of RNA-seq data from cDC1s, cDC2s, moDCs, and MFs in the steady-state and infarcted heart.
(E) Venn diagram showing numbers and overlap of DEGs in cDC1s, cDC2s, and moDCs sorted from MI d7 compared to steady-state hearts.
(F) Heat map of relative expression of top-shared DEGs between DC subsets from MI d7 hearts compared to corresponding subsets isolated from the steady-state heart. To calculate top DEGs, a threshold of a minimum 1.5 Log2 fold change was used. As an exception, no threshold was set on shared upregulated genes of cDC1s, cDC2s, and moDCs.
(G) Bar graphs representing absolute expression of DEGs among cDC1s, cDC2s, and moDCs sorted from steady-state and infarcted hearts.
(H) MFI of CD40 and CD86 expression (day 7 post-surgery) on heart DC subsets in sham-operated compared to the infarcted heart (n = 6). All bar graphs in Figure 5 show data as mean ± SEM (∗p ≤ 0.05; ∗∗p ≤ 0.01), and all data are representative of four independent experiments.
See also Figure S1 and Tables S1–S7.
To determine if DCs were also activated at the protein level post MI, expression of the activation markers CD40 and CD86 was examined by flow cytometry during the peak of DC infiltration (day 7). As predicted by RNA-seq, the ischemic environment induced DC activation. All DC subsets showed increased expression of CD40 post MI (Figure 5H). However, CD86 expression was only increased on cDC2s from infarcted hearts.
cDC2s Are the Main Presenters of αMyHC to Effector Autoreactive CD4+ T Cells Ex Vivo
Having shown that DCs infiltrate the heart, adopt an activated phenotype post MI, and migrate to mLN, we next examined if they presented the cardiac self-antigen αMyHC, released from necrotic cardiomyocytes to autoreactive T cells. To this end, we sorted cDC1s, cDC2s, and moDCs from the heart at day 7 post MI and sham controls and co-cultured them ex vivo with TCR-M cells. Consistent with cDC2s being superior at presenting antigen to CD4+ T cells and with their mature state post MI, proliferation and activation of TCR-M cells was increased when co-cultured with cDC2s from MI hearts compared with cDC1s and moDCs (Figures 6A and 6B). Nonetheless, cDC1s and moDCs from the MI heart induced more TCR-M proliferation compared to subsets from the sham heart (Figure 6A). Fitting with the highest proliferation, TCR-M cells cultured with heart cDC2s post MI exhibited increased expression of T-bet, RoRγt, and Foxp3 (Figure 6C) and the highest IFNγ and IL-17 production (Figure 6D). Migratory cDC2s sorted from mLN 7 days post MI were similarly best at inducing TCR-M proliferation, whereas migratory cDC1s only activated TCR-M cells (Figures 6E and 6F). Importantly, neither migratory cDCs from sham mLN nor migratory cDCs from mesenteric LN post MI stimulated TCR-M cells. To look further into the mechanisms of cDC2 superiority, we returned to our RNA-seq analysis. Using a stringent cut off described in the Supplemental Experimental Procedures, the list of cDC2 DEGs (MI compared to steady state) was reduced from 477 to 31 (Table S8). 15 DEGs were upregulated (Figure 6G), including Cst7 (encoding cystatin F) and Klrb1f (encoding killer cell lectin-like receptor subfamily B member 1F) (Figure 6H), which encode proteins involved in antigen processing on MHCII (Magister et al., 2012) and T cell stimulation, respectively (Tian et al., 2005). This provides a plausible mechanism for the increased ability of cDC2s from the infarcted heart to present αMyHC to TCR-M cells.
Figure 6.

cDC2s Are the Main Presenters of αMyHC to Effector Autoreactive CD4+ T Cells Ex Vivo
(A) CFSE dilution and CD25 expression of TCR-M cells in co-culture with sorted heart DC subsets from sham-operated versus MI d7 mice. Data are representative of three independent experiments (n = 12).
(B) Quantification of percentages of proliferated and CD25-expressing TCR-M cells from co-cultures plotted in (A). Individual dots represent the value of one independent experiment (mean ± SEM; ∗p ≤ 0.05).
(C) Percentage of T-bet, RoRγt, and Foxp3/CD25 expression on TCR-M cells co-cultured with sorted heart DC subsets from MI day 7 hearts (mean ± SEM).
(D) In supernatants of co-cultures plotted in (A), cytokines produced by TCR-M cells were detected by ELISA. Mean is calculated from values of technical replicates from one experiment (nd, not detectable) (mean ± SD).
(E) CFSE dilution and CD25 expression of TCR-M cells co-cultured with sorted migratory cDC1s and cDC2s from mLNs of sham-operated and MI mice and from mesenteric LNs of MI mice.
(F) After 3 days of co-culture (plotted in E), cytokines were measured in supernatants by ELISA. Mean is calculated from values of technical replicates from one experiment (nd, not detectable) (mean ± SD).
(G) Heat map of relative expression of cDC2 genes exclusively upregulated in cDC2s from the infarcted heart compared to steady state.
(H) Bar graphs representing absolute expression of interesting unique cDC2 DEGs (mean ± SEM; ∗p ≤ 0.05).
See also Table S8.
Myocardial Infarction Activates Autoreactive CD4+ T Cells In Vivo
Having shown that MI induces cardiac self-antigen presentation by DCs ex vivo, we next sought to examine if MI would activate autoreactive T cells in vivo. Therefore, naive TCR-M cells were transferred to MI and sham mice 2 and 7 days post-surgery and proliferation was analyzed 3 days later. TCR-M proliferation was increased in mLN of mice injected at day 2 post MI compared with sham, in vivo demonstrating increased αMyHC presentation early post MI (Figures 7A and 7B). TCR-M cells transferred to mice at day 2 post MI did not upregulate CD25 and Foxp3 Treg markers in mLN compared to sham mLN (Figure 7C). This suggests that iTreg differentiation was blunted after MI, potentially leading to a break in self-tolerance to the heart. Remarkably, TCR-M cells also proliferated in non-heart-draining lymphoid organs like the spleen and mesenteric LNs of MI mice compared with sham at day 2 (Figures 7A and 7B). This could suggest early systemic release of αMyHC post MI, which is presented by cDCs in non-draining lymphoid organs. Alternatively, divided TCR-M cells in non-draining LNs could be recirculating TCR-M cells that originally divided in mLN. To address this, an ex vivo co-culture was set up with bulk LN cells from sham d2, MI d2, and MI d7 mice as the antigen source and naive TCR-M cells as the readout for antigen presence (Figure 7D). TCR-M cells exclusively proliferated in the presence of mLN cells from MI d2 and d7 mice and not with mesenteric LN and spleen cells, suggesting that αMyHC is not systemically released in sufficiently high amounts post MI to stimulate TCR-M cells in this in vitro setting.
Figure 7.

Myocardial Infarction Activates Autoreactive CD4+ T Cells In Vivo
(A) TCR-M cells were injected into sham or MI mice on day 2 or day 7 post-surgery. CFSE dilution and CD44 expression of donor TCR-M cells is shown.
(B) Proliferation of donor TCR-M cells in lymphoid organs from the experiment described in (A).
(C) Percentage of Foxp3/CD25 expression on undivided and divided donor TCR-M cells isolated from mLN in sham and MI mice at day 2 post-surgery.
(D) CFSE dilution and CD44 expression of naive TCR-M cells in ex vivo co-culture with bulk mediastinal LN, spleen, and mesenteric LN cells isolated from sham and MI mice on day 2 and day 7 post-surgery.
(E) Heart cDC2 and migratory cDC2 percentages in mLN of sham and MI Irf4fl/fl and Irf4fl/fl.Cd11cCre mice at day 7 post-surgery.
(F) Irf4fl/fl, Irf4fl/fl.Cd11cCre, Irf8fl/fl and Irf8fl/fl.Cd11cCre mice were injected with TCR-M cells at day 2 post MI. CFSE dilution and CD44 expression of donor TCR-M cells is shown.
(G) Proliferation and CD44 expression of donor TCR-M cells in LNs and spleen from Irf4fl/fl and Irf4fl/fl.Cd11cCre mice from the experiment described in (F).
(H) Heart cDC percentages of sham and MI Irf8fl/fl and Irf8fl/fl.Cd11cCre mice at day 7 post-surgery.
(I) Proliferation and CD44 expression of donor TCR-M cells in LNs and spleen from Irf8fl/fl and Irf8fl/fl.Cd11cCre mice from the experiment described in (F). All bar graphs in Figure 7 show data as mean ± SEM (∗p ≤ 0.05; ∗∗p ≤ 0.01; ∗∗∗p ≤ 0.001), and all data are representative of two independent experiments.
Presentation of Cardiac Myosin in the Absence of cDC Subsets following MI
Having demonstrated that self-antigen is presented to autoreactive T cells both ex vivo and in vivo, with cDC2s appearing to be specialized in this, we next set out to determine which cDC subsets were necessary and/or sufficient for presenting αMyHC post MI. We opted to use Irf4fl/fl.Cd11cCre and Irf8fl/fl.Cd11cCre mice. Although loss of IRF4 did not decrease cDC2 populations in the sham and MI heart, migratory cDC2s in the mLNs were significantly reduced (Figure 7E); thus, these mice could be used to assess the role of migratory cDC2s post MI. Naive TCR-M cells were then transferred to Irf4fl/fl.Cd11cCre mice 2 days post MI. Intriguingly, decrease in migratory cDC2s in mLN of Irf4fl/fl.Cd11cCre mice did not affect TCR-M proliferation and activation compared with Irf4fl/fl mice (Figures 7F and 7G), demonstrating that cDC2s are not necessary. To examine if cDC1s are needed, we performed the same experiment in Irf8fl/fl.Cd11cCre mice because they lack cDC1s in the heart and mLN in both sham and MI mice (Figure 7H and data not shown). cDC1 loss had little effect on TCR-M proliferation and activation (Figure 7I). Proliferation was slightly reduced compared with Irf8fl/fl controls but was still ∼80%. So neither cDC1s nor cDC2s are specifically required for the presentation of αMyHC to autoreactive CD4+ T cells post MI.
Discussion
It is widely accepted that DCs play a role in both the regulation of peripheral tolerance and induction of autoimmunity. However, the exact mechanisms that cause DC activation and hence break tolerance remain to be dissected. One proposed mechanism is the maturation of DCs by necrotic cells (Gallucci et al., 1999); however, because this study was performed in vitro, it remains unclear if and how tissue necrosis would contribute to the initiation of autoimmunity in vivo. In this study, we addressed this issue using MI as a model of tissue necrosis. Intracellular contents released from necrotic cardiomyocytes can behave like danger signals, resulting in a sterile inflammatory response (Zhang et al., 2015). Prior to profiling the effects of MI on cardiac DCs, we performed a comprehensive analysis of distinct DC populations during homeostasis. Similar to other tissues, the steady-state heart contains a population of CD11c+MHCII+ cells, which we termed DCs. Further analysis led us to conclude that heart DCs could be divided into two populations of conventional DCs, termed cDC1s and cDC2s (Guilliams et al., 2014), and a population CD64+CD11c+MHCII+, which we termed moDCs, in line with what these cells were called previously (Tamoutounour et al., 2013). There is considerable controversy surrounding the correct name for this latter population because it is unclear if they are a bona fide DC population or a type of macrophage (Guilliams et al., 2016, Wu et al., 2016). Indeed, moDCs did not migrate from the heart to the LN, a hallmark of genuine DCs. However, moDCs did induce CD4+ T cell proliferation in ex vivo co-cultures to the same extent as cDC1s and higher than CD11c− MFs (data not shown). Principal component analysis of gene expression also demonstrated that moDCs segregate in between cDCs and MFs. Thus, the exact nature and nomenclature of these cells remains unclear.
Because αMyHC-specific autoreactive CD4+ T cells escape the thymus, peripheral tolerance is essential to prevent a cardiac autoimmune attack (Lv et al., 2011). Although cardiac DCs have been proposed to play a role in self-tolerance (Hart and Fabre, 1981), migration of self-antigen-loaded DCs to the draining LN had not been experimentally verified. Here, we demonstrated that naive αMyHC-reactive TCR-M cells proliferated in the heart-draining mLN without inducing cardiac damage and that they partially adopted an iTreg phenotype. It has recently been shown that cDC1s and cDC2s can induce iTregs in mesenteric LNs, with redundancy observed in mice lacking either cDC1s or cDC2s (Esterházy et al., 2016). Accordingly, while observing a reduction in iTreg generation in mLNs of steady-state Irf8fl/fl.Cd11cCre mice, the lack of cDC1s did not disrupt cardiac tolerance (unpublished data). We speculate that there is some redundancy among cardiac cDC subsets, which prevents autoimmunity in the absence of cDC1s.
Consistent with studies examining all DCs (Anzai et al., 2012, Zhang et al., 1993), we observed a significant yet transient increase in cardiac DC subsets post MI. RNA-seq analysis revealed that although heart cDC subsets retained their hallmark genes, the ischemic environment induced some changes compared with steady-state DCs. Analysis of DEGs identified a core MI signature, proposing that DCs from the infarcted heart had a more activated phenotype. Analysis of maturation markers confirmed this at the protein level. This is consistent with reports demonstrating that necrotic cardiomyocytes release danger signals, including Hsp70 (Maekawa et al., 2009), interleukin-1α, and HMGB-1 (Zhang et al., 2015), which can promote DC activation by inducing Toll-like/interleukin-1 receptor signaling. Cardiomyocyte necrosis also results in the release of cardiac self-antigens, such as myosin and troponin, which are constrained in the healthy heart (Larue et al., 1991). Thus, hypothetically, heart DCs become activated via TLR stimulation by danger signals after MI and get loaded with self-antigen, licensing DCs for the activation of self-antigen-specific autoreactive T cells. Indeed, we found that DCs from the infarcted heart and mLN presented cardiac self-antigen to autoreactive CD4+ T cells, which adopted a Th1/Th17 effector phenotype. This suggests that ischemic heart injury leads to cardiac autoimmunity by acting on the DC activation state. Post-infarct autoimmunity is commonly observed, with one-third of patients showing a proliferative response to cardiac myosin (Moraru et al., 2006). Furthermore, post-infarct autoimmunity contributes to persistent myocardial inflammation, leading to further damage with pathological consequences (Gottumukkala et al., 2012). Early after MI (day 2), TCR-M cells proliferated vigorously in heart-draining mLN and, interestingly, also in non-heart draining LNs, which could suggest systemic release of self-antigen post MI due to massive destruction of cardiomyocytes, which is captured by LN-resident DCs. However, we did not observe a significant proliferation of TCR-M cells when co-cultured with bulk spleen or mesenteric LN cells, suggesting that either no systemic αMyHC release occurred or the quantity of self-antigen in the circulation was too low to activate TCR-M cells ex vivo. The proliferated TCR-M cells in distant LNs could possibly also represent recirculating cells that had divided in the heart-draining mLN after their first division.
Among DCs, cDC2s were the main subset activating autoreactive CD4+ T cells post MI and inducing IL-17a and IFNγ in TCR-M cells. Despite this, cDC2s may not be necessary because TCR-M cells also proliferated in the mLN of Irf4fl/fl.Cd11cCre mice, which have a severe reduction in migratory cDC2s. Unfortunately, no perfect model exists, which results in a complete and specific cDC2 ablation because the TFs regulating cDC2 development are still largely unknown and might largely overlap with moDCs and MFs. Although cDC2s highly express IRF4, removal of IRF4 only affects migration of cDC2s (Bajaña et al., 2012). Although we have recently described Zeb2 to be a major TF for cDC2 development, Zeb2 loss only results in ablation of a proportion of cDC2s (Scott et al., 2016).
Overall, we demonstrate that DCs in the ischemic heart are activated and loaded with self-antigen, licensing DCs for efficient autoreactive T cell activation. In the future, it will be of great interest to examine the activation state and function of human DCs isolated from the infarcted heart. This could open the door for therapeutics preventing DC maturation and self-antigen presentation, which could limit the onset of pathological cardiac autoimmunity following MI.
Experimental Procedures
Mice
Wild-type BALB/c mice were purchased from Harlan. αMyHC-TCR transgenic mice (TCR-M) on BALB/c background were provided by B. Ludewig and previously described (Nindl et al., 2012). Flt3l−/− mice were on a C57/BL6 background. Irf4fl/fl.Cd11cCre and Irf8fl/fl.Cd11cCre were backcrossed onto the BALB/c background for at least two generations. Mice were used between 5 and 12 weeks of age. The animal ethics committee of Inflammation Research Center (VIB-Ghent University) (IRC) approved all experiments.
Infarct Model
MI was induced by coronary artery ligation in female 8- to 12-week-old mice. Mice were anesthetized with nembutal, moved in the supine position on a heating pad, and intubated. Respiration was started using positive pressure (1.5 L 90 strokes/min), and the left thorax was opened in between the third intercostal space. The pericardium was opened, and the LAD was ligated proximal to the main branching. Discoloration of the ventricle was obvious, indicating proper LAD ligation. Sham operation incorporated all actions, except LAD ligation.
Flow Cytometric Analysis and Sorting
Organs were freshly isolated, and heart ventricles were flushed with PBS. Organs were manually cut in 0.5- to 1-mm pieces using scissors. Samples were enzymatically digested with 20 μg/mL liberase TM (Roche) and 10 U DNase (Roche) in RPMI for 45 min at 37°C. Osmotic lysis buffer was added for 3’ to remove erythrocytes. Single-cell suspensions were incubated with a mix of fluorescently labeled monoclonal antibodies (Abs) for 30’ at 4°C. To reduce non-specific binding, 2.4G2 Fc receptor Ab was added. An overview of Abs and clones is found in the Supplemental Information. To identify live cells, fixable viability dye eFluor 506 (eBioscience) was added. For intranuclear staining of TFs, cells were fixed using a Foxp3 fixation/permeabilization kit (eBioscience). Data were acquired on an LSR Fortessa cytometer (BD Biosciences). For cell sorting, a FACSAria high-speed sorter (BD Biosciences) was used. Final analysis and graphical output were performed using FlowJo software (Tree Star) and GraphPad Prism.
RNA Sequencing
cDC1s, cDC2s, moDCs, and MFs were sorted by FACS from 100 pooled steady-state and 12 pooled infarcted hearts (7 days post-surgery) of female WT BALB/c mice, and four independent sorts were performed. A maximum of 25,000 cells were sorted directly into 500-μL buffer (RLT Plus; QIAGEN), and 5-μL β-mercaptoethanol and RNA was isolated by using a micro-RNA isolation kit (QIAGEN). Because RNA amounts were low, RNA was amplified using SmarTER amplification (Clontech). RNA sequencing was executed at the Nucleomics facility (VIB) using the NextSeq sequencer (Illumina). RNA-seq was analyzed using Trimmomatic. All details are described in the Supplemental Information.
Adoptive Transfer of TCR-M Cells
Spleens were collected from TCR-M mice and disrupted on a 70-μm cell strainer. Naive TCR-M splenocytes were MACS purified using the CD4+CD62L+ T Cell isolation kit (Miltenyi). TCR-M cells were labeled with CFSE (Invitrogen). 1 × 10⁶ naive TCR-M T cells were injected intravenously in the lateral tail vein of sham-operated and infarcted mice at day 2 and day 7 after surgery. 3 days after TCR-M adoptive transfer, mice were sacrificed, lymphoid organs were isolated, and cell suspensions were prepared as described for the spleen. CFSE dilution and T cell activation were evaluated by flow cytometry.
Ex Vivo Bulk Lymph Node Co-cultures
Lymph nodes were collected from mice at day 2 or day 7 post surgery. Single-cell suspensions were prepared as described above. 2.5 × 10⁵ bulk LN cells were added to 5 × 10⁴ MACS purified naive CD4+CD62Lhi TCR-M cells that were CFSE labeled. CFSE dilution and T cell activation were evaluated by flow cytometry after 3 days of incubation at 37°C, 5% CO2, and 20% O2.
Ex vivo Co-cultures of Sorted DC Subsets and TCR-M Cells
TCR-M cells were purified from the spleen using the CD4+ T Cell isolation kit (Miltenyi) and labeled with CFSE. 5 × 10⁴ TCR-M cells were co-cultured with 1 × 10⁴ FACS-sorted cDC1s, cDC2s, and moDCs from the mediastinal, mesenteric LN, or heart of sham and MI mice (day 7). CFSE dilution and T cell activation were evaluated by flow cytometry after 4 days of incubation at 37°C, 5% CO2, and 20% O2. To check Th skewing of TCR-M cells, IL-17A and IFNγ ELISA (eBioscience, Ready-Set-Go kit) was performed on the co-culture cell supernatants.
Statistical Analysis
For all experiments, the difference between groups was calculated using the Mann-Whitney U test for unpaired data (GraphPad Prism) and was considered significant when p < 0.05.
Author Contributions
Conceptualization, B.N.L. and P.C.; Methodology, K.V.d.B., D.S., C.L.S., P.C., and M.G.; Formal Analysis; L.M.; Investigation, A.B., J.V.M., M.V., and S.D.P.; Resources, V.N. and B.L.; Writing – Original Draft, K.V.d.B.; Writing – Review & Editing, C.L.S. and B.N.L.; Funding Acquisition, B.N.L. and T.G.; Supervision; B.N.L., T.G., and C.L.S. B.N.L. and P.C. shared supervision over the work.
Acknowledgments
K.V.d.B. was supported by an AAP fellowship of Ghent University. C.L.S. is supported by a Marie Curie Intra-European Fellowship (IEF; H2020-MSCA-IF-2014 660448). B.N.L. is supported by several FWO grants (Fonds Wetenschappelijk Onderzoek, Vlaanderen) and is the recipient of an ERC consolidator grant (41D04510W).
Published: March 21, 2017
Footnotes
Supplemental Information includes Supplemental Experimental Procedures, one figure, and eight tables and can be found with this article online at http://dx.doi.org/10.1016/j.celrep.2017.02.079.
Contributor Information
Peter Carmeliet, Email: peter.carmeliet@vib-kuleuven.be.
Bart N. Lambrecht, Email: bart.lambrecht@ugent.be.
Accession Numbers
The accession number for all RNA-sequencing data reported in this paper is GEO: GSE94949.
Supplemental Information
References
- Anzai A., Anzai T., Nagai S., Maekawa Y., Naito K., Kaneko H., Sugano Y., Takahashi T., Abe H., Mochizuki S. Regulatory role of dendritic cells in postinfarction healing and left ventricular remodeling. Circulation. 2012;125:1234–1245. doi: 10.1161/CIRCULATIONAHA.111.052126. [DOI] [PubMed] [Google Scholar]
- Ardouin L., Luche H., Chelbi R., Carpentier S., Shawket A., Montanana Sanchis F., Santa Maria C., Grenot P., Alexandre Y., Grégoire C. Broad and largely concordant molecular changes characterize tolerogenic and immunogenic dendritic cell maturation in thymus and periphery. Immunity. 2016;45:305–318. doi: 10.1016/j.immuni.2016.07.019. [DOI] [PubMed] [Google Scholar]
- Bajaña S., Roach K., Turner S., Paul J., Kovats S. IRF4 promotes cutaneous dendritic cell migration to lymph nodes during homeostasis and inflammation. J. Immunol. 2012;189:3368–3377. doi: 10.4049/jimmunol.1102613. [DOI] [PMC free article] [PubMed] [Google Scholar]
- Bajaña S., Turner S., Paul J., Ainsua-Enrich E., Kovats S. IRF4 and IRF8 act in CD11c+ cells to regulate terminal differentiation of lung tissue dendritic cells. J. Immunol. 2016;196:1666–1677. doi: 10.4049/jimmunol.1501870. [DOI] [PMC free article] [PubMed] [Google Scholar]
- Caton M.L., Smith-Raska M.R., Reizis B. Notch-RBP-J signaling controls the homeostasis of CD8- dendritic cells in the spleen. J. Exp. Med. 2007;204:1653–1664. doi: 10.1084/jem.20062648. [DOI] [PMC free article] [PubMed] [Google Scholar]
- Darrasse-Jèze G., Deroubaix S., Mouquet H., Victora G.D., Eisenreich T., Yao K.H., Masilamani R.F., Dustin M.L., Rudensky A., Liu K., Nussenzweig M.C. Feedback control of regulatory T cell homeostasis by dendritic cells in vivo. J. Exp. Med. 2009;206:1853–1862. doi: 10.1084/jem.20090746. [DOI] [PMC free article] [PubMed] [Google Scholar]
- Davis M.M. Not-so-negative selection. Immunity. 2015;43:833–835. doi: 10.1016/j.immuni.2015.11.002. [DOI] [PubMed] [Google Scholar]
- Epelman S., Lavine K.J., Beaudin A.E., Sojka D.K., Carrero J.A., Calderon B., Brija T., Gautier E.L., Ivanov S., Satpathy A.T. Embryonic and adult-derived resident cardiac macrophages are maintained through distinct mechanisms at steady state and during inflammation. Immunity. 2014;40:91–104. doi: 10.1016/j.immuni.2013.11.019. [DOI] [PMC free article] [PubMed] [Google Scholar]
- Eriksson U., Ricci R., Hunziker L., Kurrer M.O., Oudit G.Y., Watts T.H., Sonderegger I., Bachmaier K., Kopf M., Penninger J.M. Dendritic cell-induced autoimmune heart failure requires cooperation between adaptive and innate immunity. Nat. Med. 2003;9:1484–1490. doi: 10.1038/nm960. [DOI] [PubMed] [Google Scholar]
- Esterházy D., Loschko J., London M., Jove V., Oliveira T.Y., Mucida D. Classical dendritic cells are required for dietary antigen-mediated induction of peripheral T(reg) cells and tolerance. Nat. Immunol. 2016;17:545–555. doi: 10.1038/ni.3408. [DOI] [PMC free article] [PubMed] [Google Scholar]
- Gallucci S., Lolkema M., Matzinger P. Natural adjuvants: endogenous activators of dendritic cells. Nat. Med. 1999;5:1249–1255. doi: 10.1038/15200. [DOI] [PubMed] [Google Scholar]
- Gangaplara A., Massilamany C., Brown D.M., Delhon G., Pattnaik A.K., Chapman N., Rose N., Steffen D., Reddy J. Coxsackievirus B3 infection leads to the generation of cardiac myosin heavy chain-α-reactive CD4 T cells in A/J mice. Clin. Immunol. 2012;144:237–249. doi: 10.1016/j.clim.2012.07.003. [DOI] [PubMed] [Google Scholar]
- Ganguly D., Haak S., Sisirak V., Reizis B. The role of dendritic cells in autoimmunity. Nat. Rev. Immunol. 2013;13:566–577. doi: 10.1038/nri3477. [DOI] [PMC free article] [PubMed] [Google Scholar]
- Gawden-Bone C., Zhou Z., King E., Prescott A., Watts C., Lucocq J. Dendritic cell podosomes are protrusive and invade the extracellular matrix using metalloproteinase MMP-14. J. Cell Sci. 2010;123:1427–1437. doi: 10.1242/jcs.056515. [DOI] [PMC free article] [PubMed] [Google Scholar]
- Gottumukkala R.V., Lv H., Cornivelli L., Wagers A.J., Kwong R.Y., Bronson R., Stewart G.C., Schulze P.C., Chutkow W., Wolpert H.A. Myocardial infarction triggers chronic cardiac autoimmunity in type 1 diabetes. Sci. Transl. Med. 2012;4:138ra80. doi: 10.1126/scitranslmed.3003551. [DOI] [PMC free article] [PubMed] [Google Scholar]
- Guilliams M., Ginhoux F., Jakubzick C., Naik S.H., Onai N., Schraml B.U., Segura E., Tussiwand R., Yona S. Dendritic cells, monocytes and macrophages: a unified nomenclature based on ontogeny. Nat. Rev. Immunol. 2014;14:571–578. doi: 10.1038/nri3712. [DOI] [PMC free article] [PubMed] [Google Scholar]
- Guilliams M., Dutertre C.A., Scott C.L., McGovern N., Sichien D., Chakarov S., Van Gassen S., Chen J., Poidinger M., De Prijck S. Unsupervised high-dimensional analysis aligns dendritic cells across tissues and species. Immunity. 2016;45:669–684. doi: 10.1016/j.immuni.2016.08.015. [DOI] [PMC free article] [PubMed] [Google Scholar]
- Gurka S., Hartung E., Becker M., Kroczek R.A. Mouse conventional dendritic cells can be universally classified based on the mutually exclusive expression of XCR1 and SIRPα. Front. Immunol. 2015;6:35. doi: 10.3389/fimmu.2015.00035. [DOI] [PMC free article] [PubMed] [Google Scholar]
- Hart D.N., Fabre J.W. Demonstration and characterization of Ia-positive dendritic cells in the interstitial connective tissues of rat heart and other tissues, but not brain. J. Exp. Med. 1981;154:347–361. doi: 10.1084/jem.154.2.347. [DOI] [PMC free article] [PubMed] [Google Scholar]
- Heinz L.X., Baumann C.L., Köberlin M.S., Snijder B., Gawish R., Shui G., Sharif O., Aspalter I.M., Müller A.C., Kandasamy R.K. The lipid-modifying enzyme SMPDL3B negatively regulates innate immunity. Cell Rep. 2015;11:1919–1928. doi: 10.1016/j.celrep.2015.05.006. [DOI] [PMC free article] [PubMed] [Google Scholar]
- Holst K., Guseva D., Schindler S., Sixt M., Braun A., Chopra H., Pabst O., Ponimaskin E. The serotonin receptor 5-HT7R regulates the morphology and migratory properties of dendritic cells. J. Cell Sci. 2015;128:2866–2880. doi: 10.1242/jcs.167999. [DOI] [PubMed] [Google Scholar]
- Kool M., van Loo G., Waelput W., De Prijck S., Muskens F., Sze M., van Praet J., Branco-Madeira F., Janssens S., Reizis B. The ubiquitin-editing protein A20 prevents dendritic cell activation, recognition of apoptotic cells, and systemic autoimmunity. Immunity. 2011;35:82–96. doi: 10.1016/j.immuni.2011.05.013. [DOI] [PubMed] [Google Scholar]
- Larue C., Calzolari C., Léger J., Léger J., Pau B. Immunoradiometric assay of myosin heavy chain fragments in plasma for investigation of myocardial infarction. Clin. Chem. 1991;37:78–82. [PubMed] [Google Scholar]
- Latet S.C., Hoymans V.Y., Van Herck P.L., Vrints C.J. The cellular immune system in the post-myocardial infarction repair process. Int. J. Cardiol. 2015;179:240–247. doi: 10.1016/j.ijcard.2014.11.006. [DOI] [PubMed] [Google Scholar]
- Lipes M.A., Galderisi A. Cardiac autoimmunity as a novel biomarker, mediator, and therapeutic target of heart disease in type 1 diabetes. Curr. Diab. Rep. 2015;15:30. doi: 10.1007/s11892-015-0598-1. [DOI] [PMC free article] [PubMed] [Google Scholar]
- Lv H., Lipes M.A. Role of impaired central tolerance to α-myosin in inflammatory heart disease. Trends Cardiovasc. Med. 2012;22:113–117. doi: 10.1016/j.tcm.2012.07.005. [DOI] [PMC free article] [PubMed] [Google Scholar]
- Lv H., Havari E., Pinto S., Gottumukkala R.V., Cornivelli L., Raddassi K., Matsui T., Rosenzweig A., Bronson R.T., Smith R. Impaired thymic tolerance to α-myosin directs autoimmunity to the heart in mice and humans. J. Clin. Invest. 2011;121:1561–1573. doi: 10.1172/JCI44583. [DOI] [PMC free article] [PubMed] [Google Scholar]
- Maekawa Y., Mizue N., Chan A., Shi Y., Liu Y., Dawood S., Chen M., Dawood F., de Couto G., Li G.H. Survival and cardiac remodeling after myocardial infarction are critically dependent on the host innate immune interleukin-1 receptor-associated kinase-4 signaling: a regulator of bone marrow-derived dendritic cells. Circulation. 2009;120:1401–1414. doi: 10.1161/CIRCULATIONAHA.109.865956. [DOI] [PubMed] [Google Scholar]
- Magister S., Obermajer N., Mirković B., Svajger U., Renko M., Softić A., Romih R., Colbert J.D., Watts C., Kos J. Regulation of cathepsins S and L by cystatin F during maturation of dendritic cells. Eur. J. Cell Biol. 2012;91:391–401. doi: 10.1016/j.ejcb.2012.01.001. [DOI] [PubMed] [Google Scholar]
- Mildner A., Jung S. Development and function of dendritic cell subsets. Immunity. 2014;40:642–656. doi: 10.1016/j.immuni.2014.04.016. [DOI] [PubMed] [Google Scholar]
- Miller J.C., Brown B.D., Shay T., Gautier E.L., Jojic V., Cohain A., Pandey G., Leboeuf M., Elpek K.G., Helft J., Immunological Genome Consortium Deciphering the transcriptional network of the dendritic cell lineage. Nat. Immunol. 2012;13:888–899. doi: 10.1038/ni.2370. [DOI] [PMC free article] [PubMed] [Google Scholar]
- Molawi K., Wolf Y., Kandalla P.K., Favret J., Hagemeyer N., Frenzel K., Pinto A.R., Klapproth K., Henri S., Malissen B. Progressive replacement of embryo-derived cardiac macrophages with age. J. Exp. Med. 2014;211:2151–2158. doi: 10.1084/jem.20140639. [DOI] [PMC free article] [PubMed] [Google Scholar]
- Moraru M., Roth A., Keren G., George J. Cellular autoimmunity to cardiac myosin in patients with a recent myocardial infarction. Int. J. Cardiol. 2006;107:61–66. doi: 10.1016/j.ijcard.2005.02.036. [DOI] [PubMed] [Google Scholar]
- Nindl V., Maier R., Ratering D., De Giuli R., Züst R., Thiel V., Scandella E., Di Padova F., Kopf M., Rudin M. Cooperation of Th1 and Th17 cells determines transition from autoimmune myocarditis to dilated cardiomyopathy. Eur. J. Immunol. 2012;42:2311–2321. doi: 10.1002/eji.201142209. [DOI] [PubMed] [Google Scholar]
- Ohl L., Mohaupt M., Czeloth N., Hintzen G., Kiafard Z., Zwirner J., Blankenstein T., Henning G., Förster R. CCR7 governs skin dendritic cell migration under inflammatory and steady-state conditions. Immunity. 2004;21:279–288. doi: 10.1016/j.immuni.2004.06.014. [DOI] [PubMed] [Google Scholar]
- Ohnmacht C., Pullner A., King S.B.S., Drexler I., Meier S., Brocker T., Voehringer D. Constitutive ablation of dendritic cells breaks self-tolerance of CD4 T cells and results in spontaneous fatal autoimmunity. J. Exp. Med. 2009;206:549–559. doi: 10.1084/jem.20082394. [DOI] [PMC free article] [PubMed] [Google Scholar]
- Persson E.K., Uronen-Hansson H., Semmrich M., Rivollier A., Hägerbrand K., Marsal J., Gudjonsson S., Håkansson U., Reizis B., Kotarsky K. IRF4 transcription-factor-dependent CD103(+)CD11b(+) dendritic cells drive mucosal T helper 17 cell differentiation. Immunity. 2013;38:958–969. doi: 10.1016/j.immuni.2013.03.009. [DOI] [PubMed] [Google Scholar]
- Scaffidi P., Misteli T., Bianchi M.E. Release of chromatin protein HMGB1 by necrotic cells triggers inflammation. Nature. 2002;418:191–195. doi: 10.1038/nature00858. [DOI] [PubMed] [Google Scholar]
- Scott C.L., Bain C.C., Wright P.B., Sichien D., Kotarsky K., Persson E.K., Luda K., Guilliams M., Lambrecht B.N., Agace W.W. CCR2(+)CD103(-) intestinal dendritic cells develop from DC-committed precursors and induce interleukin-17 production by T cells. Mucosal Immunol. 2015;8:327–339. doi: 10.1038/mi.2014.70. [DOI] [PMC free article] [PubMed] [Google Scholar]
- Scott C.L., Soen B., Martens L., Skrypek N., Saelens W., Taminau J., Blancke G., Van Isterdael G., Huylebroeck D., Haigh J. The transcription factor Zeb2 regulates development of conventional and plasmacytoid DCs by repressing Id2. J. Exp. Med. 2016;213:897–911. doi: 10.1084/jem.20151715. [DOI] [PMC free article] [PubMed] [Google Scholar]
- Sichien D., Scott C.L., Martens L., Vanderkerken M., Van Gassen S., Plantinga M., Joeris T., De Prijck S., Vanhoutte L., Vanheerswynghels M. IRF8 transcription factor controls survival and function of terminally differentiated conventional and plasmacytoid dendritic cells, respectively. Immunity. 2016;45:626–640. doi: 10.1016/j.immuni.2016.08.013. [DOI] [PubMed] [Google Scholar]
- Sichien D., Lambrecht B.N., Guilliams M., Scott C.L. Development of conventional dendritic cells: from common bone marrow progenitors to multiple subsets in peripheral tissues. Mucosal Immunol. 2017 doi: 10.1038/mi.2017.8. Published online February 15, 2017. [DOI] [PubMed] [Google Scholar]
- Steinman R.M., Hawiger D., Nussenzweig M.C. Tolerogenic dendritic cells. Annu. Rev. Immunol. 2003;21:685–711. doi: 10.1146/annurev.immunol.21.120601.141040. [DOI] [PubMed] [Google Scholar]
- Stranges P.B., Watson J., Cooper C.J., Choisy-Rossi C.M., Stonebraker A.C., Beighton R.A., Hartig H., Sundberg J.P., Servick S., Kaufmann G. Elimination of antigen-presenting cells and autoreactive T cells by Fas contributes to prevention of autoimmunity. Immunity. 2007;26:629–641. doi: 10.1016/j.immuni.2007.03.016. [DOI] [PMC free article] [PubMed] [Google Scholar]
- Tamoutounour S., Guilliams M., Montanana Sanchis F., Liu H., Terhorst D., Malosse C., Pollet E., Ardouin L., Luche H., Sanchez C. Origins and functional specialization of macrophages and of conventional and monocyte-derived dendritic cells in mouse skin. Immunity. 2013;39:925–938. doi: 10.1016/j.immuni.2013.10.004. [DOI] [PubMed] [Google Scholar]
- Tian W., Nunez R., Cheng S., Ding Y., Tumang J., Lyddane C., Roman C., Liou H.C. C-type lectin OCILRP2/Clr-g and its ligand NKRP1f costimulate T cell proliferation and IL-2 production. Cell. Immunol. 2005;234:39–53. doi: 10.1016/j.cellimm.2005.04.021. [DOI] [PubMed] [Google Scholar]
- Torchinsky M.B., Garaude J., Martin A.P., Blander J.M. Innate immune recognition of infected apoptotic cells directs T(H)17 cell differentiation. Nature. 2009;458:78–82. doi: 10.1038/nature07781. [DOI] [PubMed] [Google Scholar]
- Waskow C., Liu K., Darrasse-Jèze G., Guermonprez P., Ginhoux F., Merad M., Shengelia T., Yao K., Nussenzweig M. The receptor tyrosine kinase Flt3 is required for dendritic cell development in peripheral lymphoid tissues. Nat. Immunol. 2008;9:676–683. doi: 10.1038/ni.1615. [DOI] [PMC free article] [PubMed] [Google Scholar]
- Wu X., Briseño C.G., Durai V., Albring J.C., Haldar M., Bagadia P., Kim K.W., Randolph G.J., Murphy T.L., Murphy K.M. Mafb lineage tracing to distinguish macrophages from other immune lineages reveals dual identity of Langerhans cells. J. Exp. Med. 2016;213:2553–2565. doi: 10.1084/jem.20160600. [DOI] [PMC free article] [PubMed] [Google Scholar]
- Zhang J., Yu Z.X., Fujita S., Yamaguchi M.L., Ferrans V.J. Interstitial dendritic cells of the rat heart. Quantitative and ultrastructural changes in experimental myocardial infarction. Circulation. 1993;87:909–920. doi: 10.1161/01.cir.87.3.909. [DOI] [PubMed] [Google Scholar]
- Zhang W., Lavine K.J., Epelman S., Evans S.A., Weinheimer C.J., Barger P.M., Mann D.L. Necrotic myocardial cells release damage-associated molecular patterns that provoke fibroblast activation in vitro and trigger myocardial inflammation and fibrosis in vivo. J. Am. Heart Assoc. 2015;4:e001993. doi: 10.1161/JAHA.115.001993. [DOI] [PMC free article] [PubMed] [Google Scholar]
- Zigmond E., Samia-Grinberg S., Pasmanik-Chor M., Brazowski E., Shibolet O., Halpern Z., Varol C. Infiltrating monocyte-derived macrophages and resident kupffer cells display different ontogeny and functions in acute liver injury. J. Immunol. 2014;193:344–353. doi: 10.4049/jimmunol.1400574. [DOI] [PubMed] [Google Scholar]
Associated Data
This section collects any data citations, data availability statements, or supplementary materials included in this article.