

Abstract
Inter-species and intraspecific variations in mitochondrial DNA (mtDNA) were observed in a bioinformatics analysis of the mitochondrial genomic sequences of 11 animal species. Some highly conserved regions were identified in the mitochondrial 12S and 16S ribosomal RNA (rRNA) genes of these species. To test whether these sequences are universally conserved, primers were designed to target the conserved regions of these two genes and were used to amplify DNA from 21 animal tissues, including two of unknown origin. By sequencing these PCR amplicons and aligning the sequences to a database of non-redundant nucleotide sequences, it was confirmed that these amplicons aligned specifically to mtDNA sequences from the expected species of origin. This molecular technique, when combined with bioinformatics, provides a reliable method for the taxonomic classification of animal tissues.
Traditionally, species identification techniques are protein-based, including isoelectric focusing (IEF) and immunological methods1. IEF is not suitable for heated or fixed samples. Immunological methods, which rely on antibodies, can be affected by cross-reaction with closely related proteins. In contrast, nucleic acid-based analytics are specific, sensitive, and reliable2.
In recent years, multiple DNA-based approaches have been developed for species identification, including DNA hybridization, restriction enzyme digestion, random PCR amplification, species-specific PCR primer use, and DNA sequencing3,4,5,6,7,8,9,10,11,12. A critical evaluation of all of these methods should focus on their discriminatory powers and reproducibilities. One of the great achievements of modern biology has been the development of accurate and reliable technologies for the rapid screening of DNA sequence variations. In this report, we demonstrate the importance of the mitochondrial DNA (mtDNA) sequencing technique, combined with bioinformatics, for the detection and identification of animal species from tissues.
With few exceptions, the cells of all eukaryotic species contain mitochondria. The mitochondrial genome comprises a double-stranded DNA molecule of approximately 16 kb in length and accounts for 1% to 2% of the total DNA in mammalian cells. The mitochondrial genome encodes the following 13 essential oxidative phosphorylation subunit proteins/polypeptides: seven subunits of Complex I (ND1-6 and ND4L), one subunit of Complex III (Cytb), three subunits of Complex IV (COI-III), and two subunits of Complex V (ATPase 6 and 8). It also encodes two rRNAs (12S rRNA and 16S rRNA) and 22 tRNAs that are required for mitochondrial protein synthesis13,14,15,16. Mitochondria possess their own organelle-specific DNA replication, transcription, and translation systems13,14,15,16.
Typical animal mtDNA has a high mutation rate and an exceptional organizational economy, with rare non-coding segments. The accelerated evolutionary rate of animal mtDNA implies that significant amounts of sequence variation could be observed in closely related species—a useful feature for species identification procedures. Moreover, in most species, mtDNA is maternally transmitted17,18 because of the simple dilution of sperm mtDNA by an egg, degradation of sperm mtDNA in the fertilized egg, or failure of sperm mtDNA to enter the egg. This maternal inheritance greatly simplifies the interpretation of species identification results. mtDNA can be isolated from hair in the absence of nuclear DNA and is also easier to retrieve from low-quantity and/or degraded DNA samples, as it is present at many copies per cell, thus providing a clear advantage over nuclear genome-based methods of species identification19.
Results
Analysis of interspecies and intraspecific sequence variations in the mitochondrial genome
The two ribosomal RNAs (12S rRNA and 16S rRNA) encoded by the mitochondrial genome are necessary for the translation of messenger RNAs into mitochondrial proteins. The 12S and 16S rRNA genes occupy 1/16 and 1/10 of the entire mitochondrial genome, respectively. Similar to other mitochondrial genes, in animal mtDNA, these two mitochondrial genes have numerous nucleotide substitutions. In human mtDNA, 297 nucleotide substitutions have been reported in the 12S rRNA gene (31% of the gene) and 413 in the 16S rRNA gene (25%) when comparison with standard Anderson's mtDNA.
There are large differences in mtDNA across animal species. Therefore, primers that amplify specific segments of human mtDNA would not be expected to amplify the corresponding segments of mtDNA from other species. Nonetheless, when we attempted to design conserved primers to obtain the full mtDNA genomic sequences of mouse and Plecoglossus altivelis (fish), we found that some mtDNA regions in the mitochondrial genomes of these two species were highly similar to those in human mtDNA, particularly in the mitochondrial 12S and 16S rRNA genes. Furthermore, It was analyzed the mitochondrial genomic sequences of species-homologous segments of mtDNA from 11 animal species, including fish (Plecoglossus altivelis), amphibians (Xenopus laevis), and mammals (Mus musculus, Bos Taurus, Pan Paniscus, Gorilla gorilla, Lemur catta, Cebus albifrons, Tarsius bancanus, Hylobates lar, and Homo sapiens). The GenBank Accession numbers, full mitochondrial genome lengths, and locations and lengths of the 12S and 16S rRNA genes for these mtDNA are shown in Table 1. The gene lengths varied from 819 bp (Xenopus laevis) to 958 bp (Cebus albifrons and Tarsius bancanus) in the 12S rRNA gene and from 1558 bp (Hylobates lar and Gorilla gorilla) to 1713 bp (Xenopus laevis) in the 16S rRNA gene. To identify whether a few highly conserved regions present in the mitochondrial 12S and 16S rRNA genes among the mitochondrial genomes, a bioinformatics analysis of the mitochondrial genomic sequences of 11 animal species would be carried out.
Table 1. GenBank accession numbers of the mitochondrial genomes and the lengths of the 12S rRNA and the 16S rRNA genes of 11 species, including fish (Plecoglossus altivelis), frog (Xenopus laevis), and human (Homo sapiens). mt full seq, mitochondrial full DNA sequence.
| Species | GenBank ID | mt full seq (bp) | 12S rRNA | 16S rRNA |
|---|---|---|---|---|
| Homo sapiens | NC_012920 | 16569 | 648..1601 (954 bp) | 1671..3229 (1559 bp) |
| Bos Taurus | V00654 | 16338 | 431..1385 (955 bp) | 1453..3023 (1571 bp) |
| Mus musculus | NC_005089.1 | 16299 | 70..1024 (955 bp) | 1094..2675 (1582 bp) |
| Xenopus laevis | NC_001573.1 | 17553 | 2205..3023 (819 bp) | 3093..4723 (1631 bp) |
| Plecoglossus altivelis | NC_002734.2 | 16542 | 69..1013 (945 bp) | 1085..2797 (1713 bp) |
| Pan paniscus | NC_001644.1 | 16563 | 72..1021 (950 bp) | 1091..2649 (1559 bp) |
| Gorilla gorilla | NC_011120.1 | 16412 | 72..1021 (950 bp) | 1091..2648 (1558 bp) |
| Lemur catta | NC_004025.1 | 17036 | 70..1022 (953 bp) | 1093..2665 (1573 bp) |
| Cebus albifrons | AJ309866.1 | 16554 | 71..1028 (958 bp) | 1087..2651 (1565 bp) |
| Tarsius bancanus | NC_002811.1 | 16927 | 68..1025 (958 bp) | 1091..2660 (1570 bp) |
| Hylobates lar | NC_002082.1 | 16472 | 70..1020 (951 bp) | 1089..2646 (1558 bp) |
Identification of conserved regions in the mitochondrial 12S and 16S rRNA genes
The mtDNA 12S rRNA and 16S rRNA gene sequences from 11 species were selected from GenBank using their GenBank Accession numbers and were used to construct phylogenetic trees (S1a and S1b). The kin relationships identified with the 12S rRNA phylogenetic tree differed from those identified with the 16S rRNA gene. Consequently, species identification based on the mitochondrial 12S rRNA gene might yield different results than that based on the mitochondrial 16S rRNA gene. However, among these species, some highly conserved regions exist in both the mitochondrial 12S rRNA and 16S rRNA genes.
The 3′ ends of the 12S rRNA and 16S rRNA mitochondrial gene sequences were found to be conserved, in agreement with other studies20. We also identified other highly conserved regions in these genes using the PileUp analysis function of the Multiple EM for Motif Elicitation (MEME) program on the National Center for Biotechnology Information (NCBI) website. In addition to the conserved sequences at the 3′ ends, three regions in the 12S rRNA gene and five regions in the 16S rRNA gene were found to be identical across the 11 species. The locations of these highly conserved regions are shown in Figure 1a and 1b.
Figure 1. The locations of highly conserved regions in the mitochondrial 12S rRNA gene (1a) and the 16S rRNA gene (1b).

The conserved motifs are marked with colored numbers.
Identification of the species of origin from known and double-blinded animal DNA
To amplify the highly variable mitochondrial 12S and 16S rRNA gene sequences from various animal species, universal oligodeoxynucleotide primers were synthesized (shown in Table 2). Genomic DNA, including mtDNA, was extracted from the following tissues: cultured fly, human, and mouse cells; eel, shrimp, fish, pig, cow, chicken, and rabbit tissues of commercial origin; 2 double-blinded tissues; and 9 DNA samples (alligator, cat, deer, dog, donkey, duck, equine, pigeon, and turkey) that were purchased from ZYAGEN. First, DNA fragments spanning the human mitochondrial 12S rRNA gene position at 1066 to 1497 and the 16S rRNA gene from 2582 to 3081 were amplified by PCR using the universal primers M13U12S-F (forward) and M13U12S-R (reverse) for the mitochondrial 12S rRNA gene21,22 and M13U16S-F (forward) and M13U16S-R (reverse) for the mitochondrial 16S rRNA gene, as listed in Table 2.
Table 2. The oligodeoxynucleotide sequences of the universal primers for mitochondrial 12S rRNA and 16S rRNA gene amplification. Red indicates the M13 forward primer; blue indicates the M13 reverse primer.
| M13U12S-F | TGTAAAACGACGGCCAGT CAAACTGGGATTAGATACCC |
| M13U12S-R | CAGGAAACAGCTATGACCGAGGGTGACGGGCGGTGTGT |
| M13U16S-F | TGTAAAACGACGGCCAGT ACCGTGCAAAGGTAGCATAAT |
| M13U16S-R | CAGGAAACAGCTATGACCTCCGGTCTGAACTCAGATCAC |
The PCR amplicons, which measured approximately 430 bp on the mitochondrial 12S rRNA gene as amplified by the first pair of primers and approximately 500 bp on the mitochondrial 16S rRNA gene as amplified by the second pair of primers, were obtained from both human DNA and from the other known and double-blinded animal DNA samples. The size differences of the PCR products from the DNA samples of various species were not distinguishable across species with routine agarose gel electrophoresis, although the PCR amplicons of the fly 12S rRNA and 16S rRNA genes were expectedly smaller (Figure 2) due to both fly 12S rRNA (686 bp) and 16S rRNA (1325 bp) genes (NC_001709.1) smaller than their sizes of other species listed in Table 1. The PCR amplicon sequences labeled M13 forward (18 bp) and M13 reverse (18 bp) were obtained with the M13 forward or M13 reverse primers, respectively (the sequence alignments from 9 species of tissues are shown in Figure 3), and then analyzed via BLAST searches at the NCBI website (see Methods). We identified the species of origin using a forward sequence BLAST search and confirmed these results with the reverse sequence BLAST search results. Furthermore, the most of results from both the forward and reverse 12S rRNA sequences were confirmed by the BLAST results from the forward and reverse 16S rRNA PCR sequences except the ell's BLAST results from 12S rRNA sequences and 16S rRNA sequences (Table 3). In addition, similar sequences (mitochondrial 12S rRNA and 16S rRNA genes from a close intraspecific relative) were also found in a BLAST search of the NCBI database, which showed the nucleotide variations in these two mitochondrial rRNA genes, along with their locations and identities.
Figure 2. PCR amplicons in the mitochondrial 12S and 16S rRNA genes from DNA samples, including a fly sample; commercial eel, shrimp, fish, chicken, pig, cow, and rabbit samples; mouse and human cells; 2 double-blinded (×1 and ×2) samples; and alligator, cat, deer, dog, donkey, duck, equine, pigeon, and turkey DNA.
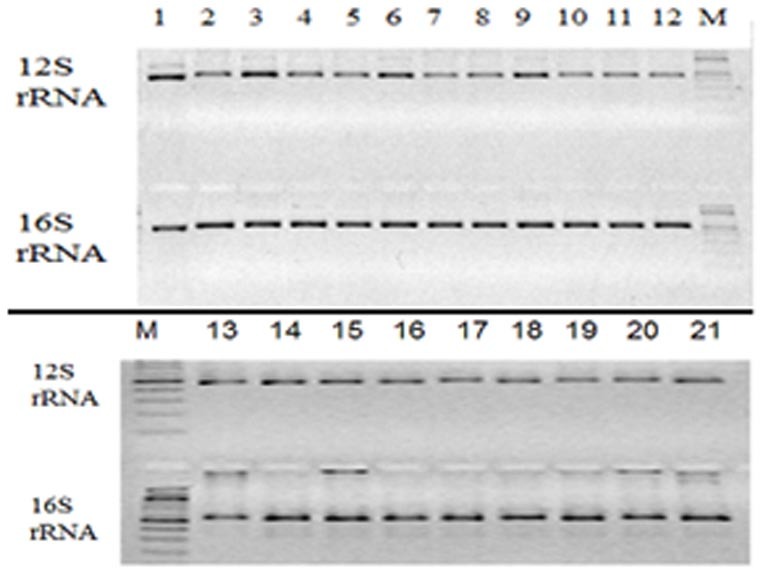
The samples are respectively labeled as 1, 2, 3, 4, 5, 6, 7, 8, 9, 10, 11, 12, 13, 14, 15, 16, 17, 18, 19, 20, and 21. M indicates the 100-bp DNA ladder.
Figure 3. The partial alignment sequences for the PCR amplicons of the mitochondrial 12S rRNA (Figure 2a) and 16S rRNA (Figure 2b) genes from 9 animal species, including the fly and 2 double-blinded samples (×1 and ×2).

The locations of the universal primers were located in the 12S and 16S rRNA forward and reverse sequences and are marked with colored bars.
Table 3. Summary of the BLAST searches using mitochondrial 12S and 16S rRNA gene PCR amplicons from 12 animals, including 2 double-blinded samples (×1 = Rat, ×2 = Frog) and 9 known DNA samples from ZYAGEN. The No.1 BLAST hit corresponds to the first alignment result with the highest identity with the mitochondrial genes. The No.100 BLAST hit corresponds to the last alignment result (out of 100 results) with the lowest identity with the mitochondrial genes. 12Sf and 16Sf represent the forward sequences of the mitochondrial 12S rRNA gene and 16S rRNA gene PCR amplicons, respectively.
| Tissues | No. 1 BLAST hit/% Identities | No. 100 BLAST hit/% Identities |
|---|---|---|
| Cow | Bos taurus isolate Rom498 mitochondrion, complete genome12Sf, Identity, 100%.Bos taurus isolate PRI18 mitochondrion, complete genome16Sf. Identity, 99%. | Bos taurus isolate PRI18 mitochondrion, complete genome12Sf. Identity, 98%.Bos taurus isolate H1065 mitochondrion, complete genome16Sf. Identity, 99%. |
| Fly | Muscina stabulans 12S ribosomal RNA gene, partial sequence; mitochondrial12Sf. Identity, 99%.Muscina stabulans 16S ribosomal RNA gene, partial sequence; mitochondrial16Sf. Identity, 99%. | Norellia striolata 12S ribosomal RNA gene, partial sequence; mitochondrial12Sf Identity, 93%.Hemipyrellia ligurriens isolate CSU0907186206A 16S ribosomal RNA gene, partial sequence; mitochondrial16Sf. Identity, 92%. |
| ×2 (Frog) | Rana catesbeiana mitochondrial DNA, complete genome12Sf. Identity, 99%.Rana catesbeiana mitochondrial DNA, complete genome16Sf. Identity, 100%. | Rana chiricahuensis isolate JAC 26724 12S ribosomal RNA gene, partial sequence; mitochondrial12Sf. Identity, 92%.Rana tagoi tagoi mitochondrial gene for 16S rRNA, complete sequence, specimen_voucher: KUHE:3698216Sf. Identity, 92%. |
| Fish | Pangasianodon hypophthalmus mitochondrion, complete genome12Sf. Identity, 99%.Pangasianodon hypophthalmus isolate MKPDH 01 12S ribosomal RNA gene, partial sequence; tRNA-Val (trnV) gene, complete sequence; and 16S ribosomal RNA gene, partial sequence; mitochondrial16Sf. Identity, 99%. | Pangasius nasutus isolate INKPPSN 01 12S ribosomal RNA gene, partial sequence; tRNA-Val (trnV) gene, complete sequence; and 16S ribosomal RNA gene, partial sequence; mitochondrial12Sf. Identity, 98%.Hemibagrus macropterus voucher SWU10090910 mitochondrion, complete genome16Sf. Identity, 93%. |
| Rabbit | Oryctolagus cuniculus complete mitochondrial genome12Sf. Identity, 100%.Oryctolagus cuniculus complete mitochondrial genome16Sf. Identity, 99%. | Capra hircus isolate V07-146 mitochondrion, complete genome12Sf. Identity, 88%.Mesoplodon densirostris isolate SWFSC ID z0074263 mitochondrion, partial genome16Sf. Identity, 85%. |
| ×1 (Rat) | Rattus norvegicus mitochondrion, complete genome12Sf. Identity, 99%.Rattus norvegicus strain OXYS mitochondrion, complete genome16Sf Identity, 100%. | Mus musculus isolate M3 mitochondrion, complete genome12Sf. Identity, 92%.Mus musculus mitochondrial DNA, complete genome, clone: P29mtC3H16Sf Identity, 90%. |
| Eel | Monopterus albus mitochondrial DNA, complete genome12Sf. Identity, 88%. (500bp)Monopterus sp. C-TC-2002 haplotype 1Nanning large subunit ribosomal RNA gene, partial sequence; mitochondrial gene for mitochondrial product16Sf. Identity, 100%. | Enterobacter sp. SWg2 16S ribosomal RNA gene, partial sequence12Sf. Identity, 100%. (200bp)Lutjanus erythropterus mitochondrion, complete genome16Sf. Identity, 83%. |
| Human | Homo sapiens haplogroup U4a3 mitochondrion, complete genome12Sf. Identity, 100%.Homo sapiens haplogroup I2 mitochondrion, complete genome16Sf. Identity, 100%. | Homo sapiens isolate Kny981_Kankanaey mitochondrion, complete genome12Sf. Identity, 100%.Homo sapiens isolate Kny982_Kankanaey mitochondrion, complete genome16Sf. Identity, 100%. |
| Mouse | Mus musculus mitochondrial DNA from Lewis lung carcinoma, complete sequence12Sf. Identity, 100%.Mus musculus mitochondrial DNA, complete genome, clone: P29mtC3H16Sf. Identity, 100%. | Mouse mitochondrion, complete genome12Sf. Identity, 100%.Mus musculus domesticus isolate Ker_Jack0912 mitochondrion, complete genome16Sf. Identity, 100%. |
| Chicken | Gallus gallus isolate Gallus2 12S ribosomal RNA gene, partial sequence; mitochondrial12Sf. Identity, 100%.Gallus gallus murghi 16S ribosomal RNA gene, partial sequence; mitochondrial16Sf. Identity, 99%. | Gallus gallus isolate Gallus2 12S ribosomal RNA gene, partial sequence; mitochondrial12Sf. Identity, 100%.Gallus gallus murghi 16S ribosomal RNA gene, partial sequence; mitochondrial16Sf. Identity, 99%. |
| Pig | Sus scrofa isolate KNP1501 mitochondrion, complete genome12Sf. Identity, 100%.Sus scrofa isolate KNP1501 mitochondrion, complete genome16Sf. Identity, 100%. | Sus scrofa breed Nuogu mitochondrion, complete genome12Sf. Identity, 98%.Sus scrofa breed Nuogu mitochondrion, complete genome16Sf. Identity, 98%. |
| Shrimp | Litopenaeus vannamei mitochondrion, complete genome12Sf. Identity, 99%.Litopenaeus vannamei mitochondrion, complete genome16Sf. Identity, 98%. | Litopenaeus vannamei mitochondrion, complete genome12Sf. Identity, 98%.Litopenaeus vannamei mitochondrion, complete genome16Sf. Identity, 96%. |
BLAST searches were performed with the PCR amplicon sequences from the mitochondrial 12S rRNA or 16S rRNA genes of double-blinded tissues (×1 and ×2 in Figure 2, No.11 and No. 12) and those of other species. The ×1 forward and reverse sequences showed 100% and 99% identity with the 16S rRNA and 12S rRNA genes, respectively, in the rat (Rattus norvegicus). Similarly, the ×2 identities were high with the frog (Rana catesbeiana) mitochondrial 12S rRNA (99%) and 16S rRNA genes (100%; Table 3). The fly 12S rRNA forward sequence and 16S sequence showed 99% identity with the Muscidae fly family member Muscina stabulans (Table 3). For the other commercially obtained tissues, including cow, fish, rabbit, chicken, pig, and shrimp, and the mouse and human cell lines, the identities with the corresponding mitochondrial genomes were 100% (cow, rabbit, chicken, pig, and eel) or 99% (fish and shrimp).
The maternal origins of the 9 DNA samples from ZYAGEN were identified using BLAST to search for sequences similar to the PCR amplicons of the mitochondrial 12S rRNA and 16S rRNA genes. The results with the highest identities (the first BLAST hits) in the mitochondrial 12S rRNA gene were located in the mitochondrial genomes of the expected species. The alligator, cat, dog, duck, and equine samples yielded 100% matches, whereas the deer, donkey, pigeon, and turkey samples yielded 99% matches (Table 3).
In the BLAST search results, the highest identity scores for the 12S rRNA gene PCR amplicon sequences were similar to those of 16S rRNA amplicon sequences (Table 3, column 2). One exception concerned the eel species identification. The full PCR sequence (> 400 bp) of the eel 12S rRNA gene shared only 88% identity with the mtDNA of the swamp eel (Monopterus albus), whereas the full sequence of the eel 16S rRNA PCR amplicon shared 100% identity with the large ribosomal RNA gene in the swamp eel (Table 3 and Figures 4a and b).
Figure 4. BLAST result profiles using the PCR amplicons of the eel mitochondrial 12S rRNA and 16S rRNA genes (Figure 4a and 4b, respectively).

The profiles indicate that the full PCR amplicon of the eel mitochondrial 12S rRNA gene only matches the Monopterus albus mtDNA although the identity is only 88%. The partial sequence of this amplicon (approximately 200 bp) matched the mitochondrial genomes of many other species. The full PCR amplicons of the eel mitochondrial 16S rRNA gene matched the Monopterus albus ribosomal RNA gene with 100% identity (Table 4). Therefore, the eel species was Monopterus albus.
Discussion
Using a bioinformatics analysis, interspecies and intraspecific nucleotide variations (polymorphisms) and length differences were identified in various animal mitochondrial 12S and 16S rRNA genes. A few highly conserved regions were identified in the mitochondrial 12S rRNA and 16S rRNA genes, including those from fish and amphibians to mammals including human beings. Therefore, universal primers were designed to amplify sequences in the fast-evolving animal mtDNA. The fly, an invertebrate species, and other tissues/cells, including double-blind samples and 9 known DNA samples, were amplified with these universal primers (Figure 2). The results demonstrated that our universal primers for highly conserved regions of the mitochondrial 12S rRNA and 16S rRNA genes were truly universal. Sequencing of the 12S and 16S rRNA gene PCR amplicons and BLAST searches with the sequences demonstrated that that these PCR amplicons aligned specifically with the mtDNA genomes of the species of origin (Table 3).
The mitochondrial 12S rRNA and/or 16S rRNA genes have been used as molecular markers to identify mammals, birds, shrimp, and other species using species-specific primers that amplify the 12S rRNA or 16S rRNA gene regions from mtDNA23,24,25,26,27,28,29,30,31,32,33,34,35,36,37,38,39. Universal mitochondrial 12S rRNA gene primers can amplify corresponding regions from a wide variety of organisms, including birds and insects26. The mitochondrial 12S rRNA gene was used in an earlier study to differentiate snail species according to a PCR-RFLP approach26. Other researchers have used species-specific mitochondrial 12S rRNA and/or 16S rRNA gene primers to identify species of shrimp, fish, poultry, fruit flies, and snakes (from venom), among others.27,28,29,30,31,32,33,34,35,36,37,38,39,40. However, the primers used in those previous studies were species-specific (Table 4) rather than universal.
Table 4. The oligodeoxynucleotide sequences of the reported species-specific primers for mitochondrial 12S rRNA and/or 16S rRNA gene amplification.
| Oligodeoxynucleotide sequences | 12S rRNA | 16S rRNA | Reference |
|---|---|---|---|
| TAATGATTATGCTACCTTTTCGCACG | 16S rRNA | 28 | |
| ACACATCGCCCGTCGC | 12S rRNA | ||
| AATTCAGCAGTGATAAACATT | 12S rRNA | 29 | |
| AGATAGAAACTGACCTGGATT | 16S rRNA | ||
| AATTGAATCGGGCCATGAA (Cat) | 12S rRNA | 30 | |
| CGACTTATCTCCTCTTGTGGGGTGT (Cat) | |||
| AATTGAATCGGGCCATGAA (Dog) | |||
| CTCCTCTTGTGTTTTAGTTAAGTTAATCTG (Dog) | |||
| AAATCCAACTTATATGTGAAAATTCATTGT (Rat/mouse) | |||
| TGGGTCTTAGCTATCGTCGATCAT (Rat/mouse) | |||
| GGTAGTGACGAAAAATAACAATACAGGAC (Eukaryotes) | |||
| ATACGCTATTGGGCTGGAATTACC (Eukaryotes) | |||
| ACATAGAACAAACGAAAAAGGATGTG (Chicken) | 12S rRNA | 32 | |
| CGTCTTAAAGTGAGCTTAGGGCG (Chicken) | |||
| CCACCTAGAGGAGCCTGTTCTRTAAT (Turkey) | |||
| TTGAGCTCACTATTGATCTTTCAGTTT (Turkey) | |||
| CATAATTAATACCCTGTAAATGCC (Duck) | |||
| TCCAGTATGCTTACCTTGTTACGAC (Duck) | |||
| TCAAGGTATAGCCTATGGAGTCGA (Goose) | |||
| CTAAATCCGCCTTCCAGAAATG (Goose) | |||
| GGTAAATCTCGTGCCAGCCA | 12S rRNA | 36 | |
| TCCAGTATGCTTACCTTGTTACGAC | |||
| AAACTGGGATTAGATACCCCACTA | 12S rRNA | 38 | |
| AGGAGGGTGACGGGCGGTGTGT | |||
| GGAAAGAAATGGGCTACA | |||
| GGGTTGGTAAATCTCGTGC | |||
| TTACCCTAGGGATAACAGCG | 16S rRNA | ||
| GACGAGAAGACCCTTTGGAGC | |||
| CAAGAGGCGATGTTTTT | |||
| AAAAACATCGCCTCCTG | |||
| GGATCAGGACATCCTAATGGTGC | |||
| GCATAATAATCTAGCCAG | |||
| GAAGTGGATAGAAGTTCAGCCT | |||
| ACAGAAGGAAGTTTATTAT | |||
| AAAAAGCTTCAAACTGGGATTAGATCCCCACTAT | 12S rRNA | 39, 41 | |
| TGACTGCAGCAGAGGGTGACGGGCGGTGGTGTGT | |||
| ACTGGGATTAGATACCCCACTATG | 12S rRNA | 40 | |
| ATCGATTATAGAACAGGCTCCTC |
Our universal primers (Table 2) could be used for mitochondrial 12S rRNA and 16S rRNA gene amplification in a systemic analysis of 11 animal mitochondrial genomes (Figure 5). These primers were more specific and accurate for the mitochondrial 12S rRNA gene than were previously reported primers. For example, the underlined nucleotide sequences in the previously reported 12S rRNA gene primers L1091 (5′-AAAAAGCTTCAAACTGGGATTAGATACCCCACTAT-3′), and H1478 (5′-TGACTGCAGAGGGTGACGGGCGGTGTGT-3′)39,41 are not highly conserved from lower-level animals (fish and amphibians) to humans, as shown in Figure 5.
Figure 5. The PileUp results from the GenBank data of the mitochondrial 12S rRNA and 16S rRNA genes from 11 animal species.

The locations of the universal primers are indicated by the non-continuous lines.
For this method, primer design is crucial. The primers M13U12S-F/R and M13U16S-F/R were specific to mitochondrial genomes, as indicated by the 100% match with the 100 BLAST search results for the sequences produced from M13U12S-F/R and M13U16S-F/R PCR of the mitochondrial sequences rather than the nuclear sequences. Specifically, after analyzing the 100 BLAST hit results (Table 3) for both the 12S and 16S rRNA PCR amplicon sequences from each animal tissue and known DNA sample, we have found that all hits occurred in the mitochondrial genomes, rather than the nuclear genomes. These included our commercial cow, fish, rabbit, chicken, pig, and shrimp tissue samples; mouse and human cell lines; double-blind samples; and 9 known animal DNA samples from ZYAGEN (Table 3, Column 2 and Column 3). All BLAST hits matched either the full or partial mitochondrial sequences of these different animal samples (Table 3, Figure 3 and Figure 5). Most importantly, when using BLAST searches to identify species, the results for the 12S rRNA gene were confirmed by the results for the 16S rRNA gene. Therefore, this analysis can be used to accurately identify species, with no potential species misidentification. In other words, this approach identified animal species with accuracies as high as 100 percent.
For species such as human, mouse, pig, duck and equine, the top BLAST hits for the 12S rRNA and 16S rRNA PCR amplicons both shared 100% identity with the mitochondrial genome sequences (Table 3). For other species, either the 12S or the 16S rRNA PCR amplicon shared 100% identity with the mitochondrial genome (cow, rabbit, chicken, alligator, cat, and dog for 12S and frog, rat, and eel for 16S). Neither the 12S rRNA nor the 16S rRNA PCR amplicons shared 100% identity with the respective top BLAST hits for 5 of the 21 tissues and DNA samples. Specifically, the fly shared 99% identity with Muscidae fly sequences and shrimp 98% identity with whiteleg shrimp (Litopenaeus vannamei). In addition, the deer sequence shared 98% identity with the spotted deer (Axis axis), the pigeon sequence shared 98% identity with the rock dove (Columba livia), and the turkey sequence shared 98% identity with Meleagris (Table 3).
In some cases, the species identified in the top BLAST hits for the 12S rRNA or 16S PCR amplicons differed from the species identified by the 100th BLAST hit. For example, the alligator 12S and 16S rRNA gene amplicons fully matched the American alligator (Alligator mississippiensis) mtDNA sequence (100% in 12S rRNA and 99% in 16S rRNA) and partially matched the black-lined plated lizard (Gerrhosaurus nigrolineatus; 12S rRNA identity: 78%) and gavial crocodile (Gavialis gangeticus) sequences (16S rRNA identity: 79%). We concluded that the alligator genomic DNA from ZYAGEN was isolated from the American alligator rather than from the lizard or crocodile.
For another example, the fly 12S and 16S rRNA gene amplicons matched the Muscidae fly mtDNA sequence (99% in 12S and 16S rRNA) and partially matched the Pogonota barbata (94%; S2b), Norellia striolata (12S rRNA identity: 93% shown in Table 3), and blowfly (Hemipyrellia ligurriens) sequences (16S rRNA identity: 92% in Table 3). Therefore, this fly was most closely related to Muscidae fly and was not Pogonota barbata, Norellia striolata, or blowfly (Table 3 and S2). This analysis is therefore helpful for the subclassification of known and even unknown animal tissues and DNA samples.
Usually species identification results based on the mitochondrial 12S rRNA gene and 16S rRNA gene are identical. Occasionally, the species identification results based on the mitochondrial 12S rRNA gene can differ from those based on the mitochondrial 16S rRNA gene, as was observed with the eel (Table 3). Therefore, it is necessary to perform species identification with both the 12S and the 16S rRNA mitochondrial genes.
We examined a total of 21 animal species, including flies, fish, amphibians, and mammals (including human). The species could be determined accurately with our custom universal primers and BLAST searches.
The reported short PCR products (approximately 100 bp) from the mitochondrial 12S rRNA gene40 might hinder species identification because multiple similar sequences exist in closely related species, as well as homologous nuclear sequences. However, the partial mitochondrial 12S (approximately 430 bp) and 16S gene (approximately 500 bp) sequences, which contain multiple polymorphisms that enable interspecies and intraspecific identification, can be obtained from various animals, using our novel universal primers. These novel primers avoid the amplification of nuclear homologous sequences, as those PCR product lengths exceed 400 bp. This method is sensitive because multiple mtDNA copies are present in the cells and the circular conformation of the mtDNA allows more efficient amplification of mtDNA, compared with that of nuclear genes. Most importantly, with this method, animal species can be identified from hair shafts in the absence of root samples (in other words, from samples without nuclear DNA).
The maternal origins of unknown species could be retrieved through BLAST sequence searches. Additionally, this method could allow personal identification using mitochondrial 12S and 16S rRNA gene sequencing in combination with the results of hypervariable D-loop region sequencing42,43. These methods could be used in ecological genetics studies. Finally, the ease with which homologous sequences can be gathered will facilitate developments in molecular and evolutionary biology that will lead to insights into genetic structures and functions based on the dynamics of the molecular changes and phylogenetic histories of the mitochondrial 12S and 16S rRNA genes. In fact, these two mitochondrial genes share similar structures and functions in organisms ranging from bacteria to humans, despite the fact that the sequences exhibit numerous inter- and intraspecific nucleotide variations.
Methods
Universal primer design
We expected primers that amplified specific human mtDNA segments to also amplify the corresponding mtDNA fragments from other species. We designed two pairs of primers to target sequences in the 12S rRNA and 16S rRNA genes and thus amplify homologous mitochondrial genomic sequences from a wide variety of animal species. The locations of these universal primers are shown in Figure 5.
When choosing the oligonucleotide sequences, we took advantage of the evolutionary stability of rRNA regions. To design these primers, we compared the published sequences for mammalian (human, cow, mouse, and primates), amphibian (Xenopus laevis), and fish (Plecoglossus altivelis) mtDNA and searched for highly conserved regions. The reverse primers were selected from the 3′ ends of the 12S and 16S rRNA genes (shown in green in Figure 1a and red in Figure 1b, respectively). The forward primers were selected from the middle regions of the 12S and 16S rRNA genes (yellow in Figure 1a and green in Figure 1b, respectively). The forward primers for both the 12S and 16S rRNA genes were combined with the M13 forward primers, and the reverse primers were combined with the M13 reverse primers21. We designated these universal primers as M13U12S-F and M13U12S-R for 12S rRNA and M13U16S-F and M13U16S-R for 16S rRNA. The primers span nucleotides 1066 to 1085 (forward) and 1478 to 1497 (reverse) of the mitochondrial 12S rRNA gene and 2582 to 2601(forward) and 3061 to 3081 (reverse) of the mitochondrial 16S rRNA gene (NCBI: NC_012920.1). The nucleotide sequences for these primers are listed in Table 2.
DNA isolation, PCR, and PCR product sequencing
Cultured fly, human, and mouse cells; 2 double-blinded samples; and cultures from commercial eel, fish, shrimp, pig, cow, rabbit, and chicken tissues were digested in a buffer containing 100 mM Tris HCl, pH 8.0,10 mM EDTA, 100 mM NaCl, 0.1% sodium dodecyl sulfate (SDS), 50 mM dithiothreitol, and proteinase K (0.5 mg/ml) for 2–4 hrs at 42°C. DNA was isolated from the samples with the Puregene DNA Isolation Kit (Gentra Systems, Minneapolis, MN, USA)22. Nine DNA samples (alligator, cat, deer, dog, donkey, duck, equine, pigeon, and turkey) were purchased from ZYAGEN.
A total of 10–100 ng of DNA were used for PCR amplification of the mitochondrial 12S and 16S rRNA gene fragments. The PCR conditions were identical to those of previous reports21,22. The amplicons were analyzed by 2% agarose gel electrophoresis and ethidium bromide staining (Figure 2).
Each M13 forward (18 bp) and M13 reverse (18 bp)-tagged (Figure 2) PCR amplicon was purified and subsequently submitted to direct sequencing with the M13 forward primer or M13 reverse primer to obtain the forward or reverse sequences with the Big Dye Terminator Cycle sequencing reaction kit in an ABI 3700 automated DNA sequencer (Life Technologies, Carlsbad, CA, USA)22.
BLAST search of PCR amplicon sequences
The sequences of the mitochondrial 12S and 16S rRNA gene amplicons generated with the M13 forward primer and/or M13 reverse primer (Table 2) were analyzed via Standard Nucleotide BLAST searches at the NCBI website. A total of 100 BLAST hits were obtained for each PCR amplicon (forward or reverse of the 12S rRNA gene and forward or reverse of the 16S rRNA gene) from animal tissues including 2 double-blinded and known DNA samples. The top (first) BLAST hit represented the greatest degree of identity. The 100th BLAST hit represented the lowest degree of identity (Table 3). The locations of the sequences in mitochondrial genomes, including the 12S and 16S rRNA genes, and identities with similar mitochondrial gene sequences were listed, and the maternal origins, classes, and subclasses of the DNA samples were determined from sequence BLAST hits (Table 3).
Supplementary Material
Supplementary S1S2 and legends
Footnotes
The authors declare no competing financial interests.
Author Contributions All authors contributed extensively to the work presented in this paper. L.Y. performed most of the experiments, analyzed the output data, and contributed figures. D.W. discussed the results and the manuscript with R.L. Z.T. and L.X. conducted some of the experiments such as DNA isolation from the animal tissues, PCR product sequencing, and sequence alignment analyses. M.G. discussed the results and the manuscript with R.L. T.H. discussed the results, figures, and manuscript format with R.L. R.L., as the corresponding author of this manuscript, designed the project, analyzed the conservation regions in the mitochondrial 12S and 16S genes, designed the universal primers, analyzed the data and BLAST search results, assigned the experiments, wrote the manuscript, and corresponded with the reviewers and editors regarding their comments.
References
- Bataille M., Crainic K., Leterreux M., Durigon M. & de Mazancourt P. Multiplex amplification of mitochondrial DNA for human and species identification in forensic evaluation. Forensic Sci Int 99, 165–70 (1999). [DOI] [PubMed] [Google Scholar]
- Wolf C., Rentsch J. & Hübner P. PCR-RFLP analysis of mitochondrial DNA: a reliable method for species identification. J Agric Food Chem 47, 1350–5 (1999). [DOI] [PubMed] [Google Scholar]
- Birstein V. J. & DeSalle R. Molecular phylogeny of Acipenserinae. Mol. Phylogenet. Evol 9, 141–155 (1998). [DOI] [PubMed] [Google Scholar]
- Brown J. R., Beckenbach K., Beckenbach A. T. & Smith M. J. Length variation, heteroplasmy and sequence divergence in the mitochondrial DNA of four species of sturgeon (Acipenser). Genetics 142, 525–35 (1996). [DOI] [PMC free article] [PubMed] [Google Scholar]
- Burgener M. & Hubner P. Mitochondrial DNA enrichment for species identification and evolutionary analysis. Z. Lebensm. Unters. Forsch 207, 261–263 (1998). [Google Scholar]
- Cano R. J., Poinar H. N., Pieniazek N. J., Acra A. & Poinar G. O. Jr. Amplification and sequencing of DNA from a 120–135-million-year-old weevil. Nature 363, 536–538 (1993). [DOI] [PubMed] [Google Scholar]
- Chow S., Clarke M. E. & Walsh P. J. PCR-RFLP analysis on thirteen western Atlantic snappers (subfamily Lutjaninae): a simple method for species and stock identification. Fish. Bull 91, 619–627 (1993). [Google Scholar]
- Collura R. V. & Stewart C. B. Insertions and duplications of mtDNA in the nuclear genomes of Old World monkeys and hominoids. Nature 378, 485–489 (1995). [DOI] [PubMed] [Google Scholar]
- DeSalle R., Williams A. K. & George M. Isolation and characterization of animal mitochondrial DNA. Methods Enzymol 224, 176–204 (1993). [DOI] [PubMed] [Google Scholar]
- Esposti M. D. et al. Mitochondrial cytochrome b: evolution and structure of the protein. Biochim Biophys Acta 1143, 243–71 (1993). [DOI] [PubMed] [Google Scholar]
- Hayashi J., Tagashira Y. & Yoshida M. C. Absence of extensive recombination between inter and intraspecies mitochondrial DNA in mammalian cells. Exp Cell Res 160, 387–395 (1985). [DOI] [PubMed] [Google Scholar]
- Irwin D. M., Kocher T. D. & Wilson A. C. Evolution of the cytochrome b gene of mammals. J Mol Evol 32, 123–144 (1991). [DOI] [PubMed] [Google Scholar]
- Wallance D. C. Mitochondrial diseases in man and mouse. Science 283, 1482–1488 (1999). [DOI] [PubMed] [Google Scholar]
- Attardi G. & Schatz G. Biogenesis of mitochondria. Annu Rev Cell Biol 4, 289–333 (1988). [DOI] [PubMed] [Google Scholar]
- Pirger Z., Rácz B. & Kiss T. Dopamine-induced programmed cell death is associated with cytochrome c release and caspase-3 activation in snail salivary gland cells. Biol Cell 101, 105–116 (2009). [DOI] [PubMed] [Google Scholar]
- Anderson S. et al. Sequence and organization of the human mitochondrial genome. Nature 290, 457–465 (1981). [DOI] [PubMed] [Google Scholar]
- Giles R. E., Blanc H., Cann H. M. & Wallance D. C. Maternal inheritance of human mitochondrial DNA. Proc Natl Acad Sci USA 77, 6715–6719 (1980). [DOI] [PMC free article] [PubMed] [Google Scholar]
- Jenuth J. P., Perterson A. C., Fu K. & Shoubridge E. A. Random genetic drift in the female germline explains the rapid segregation of mammalian mitochondrial DNA. Nat Genet 14, 146–151 (1997). [DOI] [PubMed] [Google Scholar]
- Girish P. S. et al. Sequence analysis of mitochondrial 12S rRNA gene can identify meat species. Meat Sci 66, 551–6 (2004). [DOI] [PubMed] [Google Scholar]
- Kocher T. D. et al. Dynamics of mitochondrial DNA evolution in animals: amplification and sequencing with conserved primers. Proc Natl Acad Sci USA 86, 6196–6200 (1989). [DOI] [PMC free article] [PubMed] [Google Scholar]
- Rieder M. J., Taylor S. L., Tobe V. O. & Nickerson D. A. Automating the identification of DNA variations using quality-based fluorescence resequencing: analysis of the human mitochondrial genome. Nucleic Acids Res 26, 967–973 (1998). [DOI] [PMC free article] [PubMed] [Google Scholar]
- Li R. et al. Cosegregation of C-insertion at position 961 with the A1555G mutation of the mitochondrial 12S rRNA gene in a large Chinese family with maternally inherited hearing loss. Am J Med Genet A 124A, 113–7 (2004). [DOI] [PubMed] [Google Scholar]
- Mitsuhiro N., Yasuyuki I. & Syuiti A. Novel primer sets for species-specific amplification of the mitochondrial 12S rRNA genes in four Japanese woodpeckers (Picidae, Piciformes). Meat Science 66, 551–556 (2004).22060864 [Google Scholar]
- Bataille M., Crainic K., Leterreux M., Durigonb M. & de Mazancourta P. Multiplex amplification of mitochondrial DNA for human and species identification in forensic evaluation. Forensic Sci Int 99, 165–170 (1999). [DOI] [PubMed] [Google Scholar]
- Wang B. et al. Molecular phylogeny and genetic identification of populations of two species of feirana frogs (amphibia: anura, ranidae, dicroglossinae, paini) endemic to china. Zoolog Sci 26, 500–9 (2009). [DOI] [PubMed] [Google Scholar]
- Gupta A. R. et al. Sequence characterization and polymerase chain reaction-restriction fragment length polymorphism of the mitochondrial DNA 12S rRNA gene provides a method for species identification of Indian deer. Mitochondrial DNA 19, 394–400 (2008). [DOI] [PubMed] [Google Scholar]
- Rojas M. et al. Polymerase chain reaction-restriction fragment length polymorphism authentication of raw meats from game birds. J AOAC Int 91, 1416–22 (2008). [PubMed] [Google Scholar]
- Pascoal A., Barros-Velázquez J., Cepeda A., Gallardo J. M. & Calo-Mata P. A polymerase chain reaction-restriction fragment length polymorphism method based on the analysis of a 16S rRNA/tRNA(Val) mitochondrial region for species identification of commercial penaeid shrimps (Crustacea: Decapoda: Penaeoidea) of food interest. Electrophoresis 29, 499–509 (2008). [DOI] [PubMed] [Google Scholar]
- Gharrett A. J., Gray A. K. & Heifetz J. Identification of rockfish (Sebastes spp.) by restriction site analysis of the mitochondrial ND-3/ND-4 and 12S/16S rRNA gene regions. Fish Bull 99, 49–62 (2001). [Google Scholar]
- Martín I. et al. Technical note: Detection of cat, dog, and rat or mouse tissues in food and animal feed using species-specific polymerase chain reaction. J Anim Sci 85, 2734–9 (2007). [DOI] [PubMed] [Google Scholar]
- Saini M. et al. Characterisation of peacock (Pavo cristatus) mitochondrial 12S rRNA sequence and its use in differentiation from closely related poultry species. Br Poult Sci 48, 162–6 (2007). [DOI] [PubMed] [Google Scholar]
- Martín I. et al. Technical note: detection of chicken, turkey, duck, and goose tissues in feedstuffs using species-specific polymerase chain reaction. J Anim Sci 85, 452–8 (2007). [DOI] [PubMed] [Google Scholar]
- Barr N. B. et al. Molecular diagnostics of economically important Ceratitis fruit fly species (Diptera: Tephritidae) in Africa using PCR and RFLP analyses. Bull Entomol Res 96, 505–21 (2006). [PubMed] [Google Scholar]
- Kitano T., Umetsu K., Tian W. & Osawa M. Two universal primer sets for species identification among vertebrates. Int J Legal Med 121, 423–7 (2007). [DOI] [PubMed] [Google Scholar]
- Pook C. E. & McEwing R. Mitochondrial DNA sequences from dried snake venom: a DNA barcoding approach to the identification of venom samples. Toxicon 46, 711–5 (2005). [DOI] [PubMed] [Google Scholar]
- López-Calleja I. et al. Rapid detection of cows' milk in sheeps' and goats' milk by a species-specific polymerase chain reaction technique. J Dairy Sci 87, 2839–45 (2004). [DOI] [PubMed] [Google Scholar]
- Medina M., Collins T. M. & Walsh P. J. mtDNA ribosomal gene phylogeny of sea hares in the genus Aplysia (Gastropoda, Opisthobranchia, Anaspidea): implications for comparative neurobiology. Syst Biol 50, 676–88 (2001). [DOI] [PubMed] [Google Scholar]
- Simons A. M. & Mayden R. L. Phylogenetic relationships of the western North American phoxinins (Actinopterygii: Cyprinidae) as inferred from mitochondrial 12S and 16S ribosomal RNA sequences. Mol Phylogenet Evol 9, 308–29 (1998). [DOI] [PubMed] [Google Scholar]
- Zhang Y. P. & Ryder O. A. Phylogenetic relationships of bears (the Ursidae) inferred from mitochondrial DNA sequences. Mol Phylogenet Evol 3, 351–9 (1994). [DOI] [PubMed] [Google Scholar]
- Melton T. & Holland C. Routine forensic use of the mitochondrial 12S ribosomal RNA gene for species identification. J Forensic Sci 52, 1305–7 (2007). [DOI] [PubMed] [Google Scholar]
- Meyer J., Kohnen A., Harf R., Froscheke G. & Brandl R. Molecular markers for some small mammals of southern Africa. Folia Zool 55, 444–447 (2006). [Google Scholar]
- Brown J. R., Beckenbach A. T. & Smith M. J. Intraspecific DNA sequence variation of the mitochondrial control region of white sturgeon (Acipenser transmontanus). Mol Biol Evol 10, 326–41 (1993). [DOI] [PubMed] [Google Scholar]
- Hofmann S. et al. Population Genetics and Disease Susceptibility: Characterization of Central European Haplogroups By mtDNA Gene Mutations, Correlation with D Loop Variants and Association With Disease. Hum Mol Genet 6, 1835–46 (1997). [DOI] [PubMed] [Google Scholar]
Associated Data
This section collects any data citations, data availability statements, or supplementary materials included in this article.
Supplementary Materials
Supplementary S1S2 and legends