

Abstract
Objective:
To establish whether HIV disease is associated with abnormal levels of age-related brain atrophy, by estimating apparent brain age using neuroimaging and exploring whether these estimates related to HIV status, age, cognitive performance, and HIV-related clinical parameters.
Methods:
A large sample of virologically suppressed HIV-positive adults (n = 162, age 45–82 years) and highly comparable HIV-negative controls (n = 105) were recruited as part of the Comorbidity in Relation to AIDS (COBRA) collaboration. Using T1-weighted MRI scans, a machine-learning model of healthy brain aging was defined in an independent cohort (n = 2,001, aged 18–90 years). Neuroimaging data from HIV-positive and HIV-negative individuals were then used to estimate brain-predicted age; then brain-predicted age difference (brain-PAD = brain-predicted brain age − chronological age) scores were calculated. Neuropsychological and clinical assessments were also carried out.
Results:
HIV-positive individuals had greater brain-PAD score (mean ± SD 2.15 ± 7.79 years) compared to HIV-negative individuals (−0.87 ± 8.40 years; b = 3.48, p < 0.01). Increased brain-PAD score was associated with decreased performance in multiple cognitive domains (information processing speed, executive function, memory) and general cognitive performance across all participants. Brain-PAD score was not associated with age, duration of HIV infection, or other HIV-related measures.
Conclusion:
Increased apparent brain aging, predicted using neuroimaging, was observed in HIV-positive adults, despite effective viral suppression. Furthermore, the magnitude of increased apparent brain aging related to cognitive deficits. However, predicted brain age difference did not correlate with chronological age or duration of HIV infection, suggesting that HIV disease may accentuate rather than accelerate brain aging.
Despite effective viral suppression due to combination antiretroviral therapy (cART), chronic HIV disease has been linked with a higher risk of multiple diseases of old age. These include cardiovascular, renal, hepatic, or pulmonary disease, cancer, osteoporosis, and physical frailty.1–4 This has led researchers to consider whether chronic HIV disease accelerates the normal aging process,5 a hypothesis potentially supported by the increased prevalence of cognitive impairment.6–8 If HIV accelerates cognitive aging, this has huge implications for HIV-positive individuals, their families, and the health care systems tasked with providing future care.
Cognitive aging is a consequence of physiologic changes in the brain (i.e., brain aging), including a loss of brain volume.9 Deviations from a typical brain-aging trajectory (e.g., acceleration) may result from a brain injury, neurodegenerative disease, or, potentially, chronic HIV. While reduced brain volumes are frequently reported in HIV disease,10–19 the evidence supporting accelerated brain aging is more equivocal.10,20,21 These studies used macroscopic brain volume measures to correlate with chronological age. In contrast, we employed machine learning to make explicit estimations of age, based on 3D brain volume maps.22 Such neuroimaging-based brain age estimations appear sensitive to pathologic aspects of aging and cognitive impairment,22–24 thus representing a potential biomarker of brain aging.
Here, we generated brain-predicted age difference (brain-PAD) scores in HIV-positive individuals and highly comparable HIV-negative controls, testing the following hypotheses: (1) HIV-positive individuals would have greater brain-PAD than HIV-negative individuals; (2) brain-PAD would be associated with deficits in cognitive performance; (3) HIV-related parameters would be associated with brain-PAD.
METHODS
Participants.
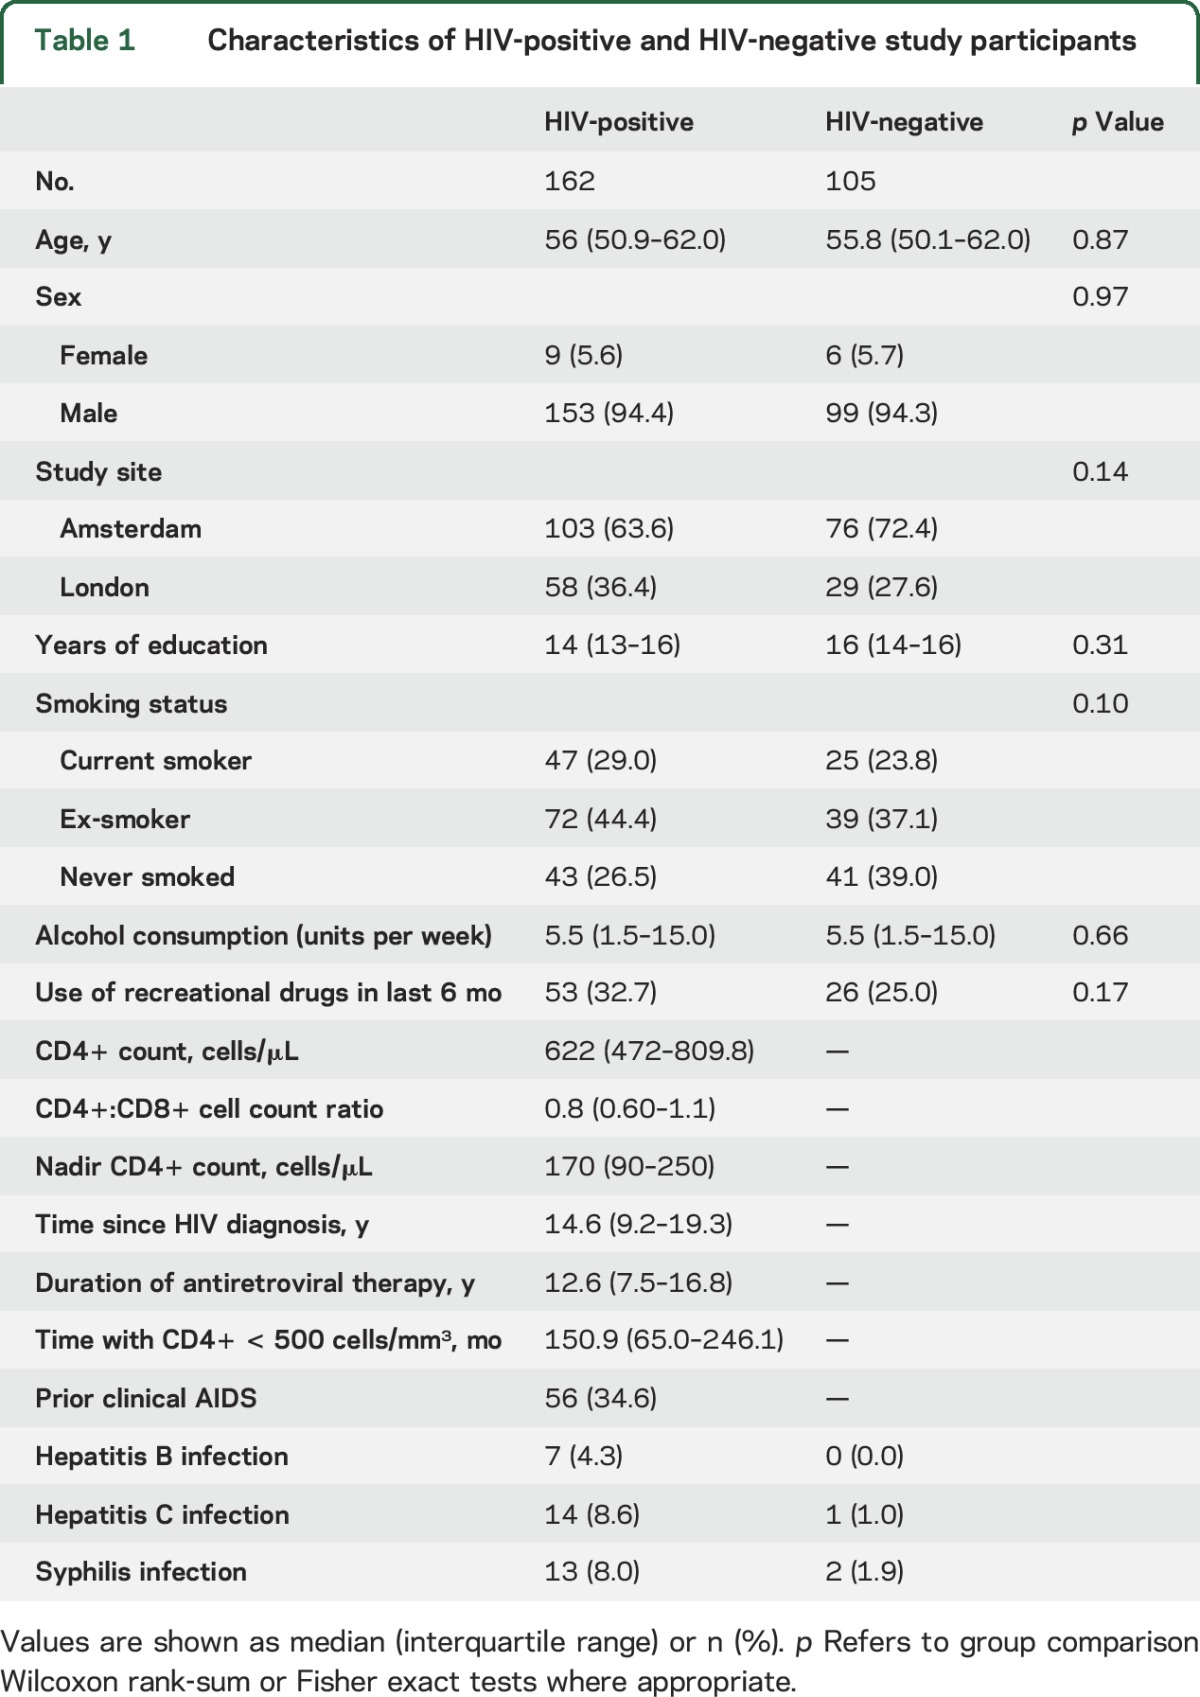
The study included 162 HIV-positive individuals and 105 HIV-negative controls who had highly similar demographic and lifestyle characteristics (table 1). These participants comprised the test set in the machine-learning analysis. Participants were recruited from 2 sites, London and Amsterdam, as part of the Comorbidity in Relation to AIDS (COBRA) collaboration. Exclusion criteria for COBRA were as follows: age under 45 years, current major depression (Patient Health Questionnaire–9 score of ≥15), confounding neurologic diseases, previous severe head injury (loss of consciousness ≥30 minutes), previous cerebral infections (including AIDS-defining CNS diseases), self-reported IV drug use within the last 6 months, daily use of recreational drugs (with the exception of cannabis), excess alcohol intake (>48 units per week), severe psychiatric disease, or MRI contraindications. All HIV-positive participants were required to be on cART and to have had undetectable plasma HIV RNA (<50 copies/mL) for ≥12 months prior to enrollment.
Table 1.
Characteristics of HIV-positive and HIV-negative study participants
A further 2,001 individuals (1,016 male, mean ± SD age 36.95 ± 18.12 years; range 18–90) comprised the training dataset. These individuals were drawn from publicly available data repositories (table e-1 at Neurology.org) and were screened according to each study's local inclusion protocols to ensure the absence of neurologic or psychiatric diseases and major health conditions.
Standard protocol approvals, registrations, and patient consents.
The study was approved by the institutional review board of the Academic Medical Center and the London (Stanmore) Research Ethics Committee. All participants gave written informed consent. For participants comprising the training dataset, ethical approval was granted for each contributing study and permission for subsequent data sharing was verified for each data repository.
Neuropsychological assessment.
Participants completed a comprehensive neuropsychological assessment, with tests of attention, executive function, language fluency, memory, speed of information processing, and motor function (table e-2). Raw test scores were standardized as t scores (age-, sex-, and education level–adjusted). Higher t scores represented better cognitive function. Test scores were averaged within domains to calculate domain-specific t scores and across domains to calculate a global t score. Three HIV-positive participants were missing data for one or more domains. Categorical classifications of cognitive impairment in HIV were made based on the global deficit score.25 The global deficit score is obtained by converting cognitive domain t scores to deficit scores and then averaging them. A score ≥0.5 was defined as cognitively impaired.
Neuroimaging data acquisition.
Acquisition parameters were harmonized between sites and scanners (London: Siemens [Munich, Germany] Verio 3T; Amsterdam: Philips [Best, the Netherlands] Intera, upgraded to Ingenia 3T). This resulted in the following protocols for 3D T1-weighted structural images: London: magnetization-prepared rapid gradient-echo, echo time (TE) 2.98 ms, repetition time (TR) 2,300 ms, inversion time 900 ms, flip angle 9°, field of view (FOV) 256 mm, 160 slices of 1.0 mm thickness, in-plane resolution 1.0 × 1.0 mm; Amsterdam: sagittal turbo field echo, TE 3.1 ms, TR 6.6 ms, flip angle 9°, FOV 270 mm, 170 slices of 1.2 mm thickness, in-plane resolution 1.1 × 1.1 mm. Three-dimensional structural images for the training set were acquired using various parameters and field strengths (1.5T and 3T), according to local study protocols (table e-1).
Brain age prediction procedure.
An overview of the brain age prediction procedure is presented in figure 1. We followed the protocol as previously outlined,22 with the minor adaptation that gray matter (GM) and white matter (WM) images were analyzed together, to generate a whole-brain predicted age, rather than tissue-specific age predictions. In brief, all images were preprocessed using SPM12 (University College London, UK) to generate normalized 3D maps of GM and WM volume, in Montreal Neurological Institute 152 (MNI152) space. Normalization used SPM-DARTEL for nonlinear registration and resampling included modulation and 4-mm smoothing. Information from 4 individuals was excluded at this stage (1 HIV-positive, 3 HIV-negative) due to excess motion artefact or poor head positioning, resulting in a final sample size of 161 HIV-positive and 102 HIV-negative participants for the test set, alongside 2,001 individuals in the training set.
Figure 1. Study methods.

Outline of machine learning brain age prediction methods used in the study. Data included 3 separate groups: healthy individuals (n = 2,001) comprised the training data, and HIV-positive individuals (n = 161) and HIV-negative controls (n = 102) comprised the test data, after quality control (n = 4 exclusions). (A) All data were preprocessed with statistical parametric mapping (SPM) to segment T1 images into gray matter (GM) and white matter (WM) images. These segmented images were then normalized to a custom template using DARTEL for nonlinear registration, before being resampled to Montreal Neurological Institute 152 (1.5 mm3) template space, using volumetric modulation and a 4-mm smoothing kernel. GM and WM images were then concatenated for each subject. (B) Machine learning age prediction used PRoNTo. (a) Representation of all data in a linear kernel form as a similarity matrix of the dot products between pairs of vectorized and concatenated volume images. (b) Supervised learning stage. Data from the training set were run through a Gaussian processes regression model to define the correspondence between brain volume maps and chronological age. Model accuracy was assessed on predictions made during a 10-fold cross-validation procedure. (c) Test set prediction. The coefficients from the model trained on the healthy sample were used to generate predicted age values from the data in the HIV-positive individuals and HIV-negative controls. Brain-predicted age difference (brain-PAD) scores were defined by subtracting chronological age from predicted age. (C) Statistical analysis based on brain-PAD scores as an index of apparent brain aging.
Brain age prediction was carried out by defining a Gaussian processes regression to model the relationship between 3D GM and WM volume maps and chronological age in the training set, using PRoNTo v2.0 (mlnl.cs.ucl.ac.uk/pronto). Age predictions on all participants were generated using 10-fold cross-validation. Model accuracy was expressed as the correlation between age and predicted age (Pearson r), total variance explained (R2), mean absolute error (MAE), and root mean squared error (RMSE). The statistical significance of this model was assessed using permutation testing (n = 1,000).
Coefficients from the validated regression model were then applied to the test data (i.e., HIV-positive and HIV-negative individuals). This generated a brain-predicted age estimate per participant. Finally, brain-PAD scores were calculated for each test participant by subtracting chronological age from brain-predicted age. Hence, a positive brain-PAD indicates that the participant's brain was predicted to be older than his or her chronological age. Brain-PAD scores were used in subsequent analysis to index age-adjusted, or relative, brain aging.
As neuroimaging data were acquired on multiple scanners, a separate sample of healthy volunteers were scanned in both London and Amsterdam (n = 11, age range 23–42 years) to assess between-scanner reliability. Brain-PAD scores were calculated for each participant from scans at both sites. The absolute agreement of brain-PAD score between scanners was high; intraclass correlation coefficient = 0.95, 95% confidence interval 0.84–0.99, p < 0.01.
Statistical analysis.
Further statistical analyses were conducted using R, v3.2.3. With brain-PAD scores as the dependent variable, HIV-positive and HIV-negative groups were compared using a linear regression. Covariates included scanner type, sex, intracranial volume (ICV), and smoking status, but not age. For analysis of neuropsychological performance, linear regression models were fit using domain t scores as the dependent variable, and brain-PAD score, HIV status, sex, and ICV as predictor variables. Interactions between HIV-status and brain-PAD score were then modeled by repeating the above linear regressions with the addition of an interaction term. Multiple comparison correction across the 6 domains was not carried out due to the non-independent nature of the neuropsychological tests. Effect sizes for linear regression were quantified using partial η2. Group differences in categorical variables (e.g., smoking status, sex, cognitive impairment) were assessed using Fisher exact tests. Group comparisons in neuropsychological test performance were performed using the Wilcoxon rank-sum test.
RESULTS
Age can be accurately predicted using neuroimaging data.
Cross-validation in the training set indicated that data from 3D brain volume maps accurately predicted chronological age in the training set (r = 0.94, R2 = 0.88, MAE = 5.01, RMSE = 6.31; figure 2). This remained significant after permutation correction (corrected p < 0.01).
Figure 2. Brain-predicted age in the training dataset.
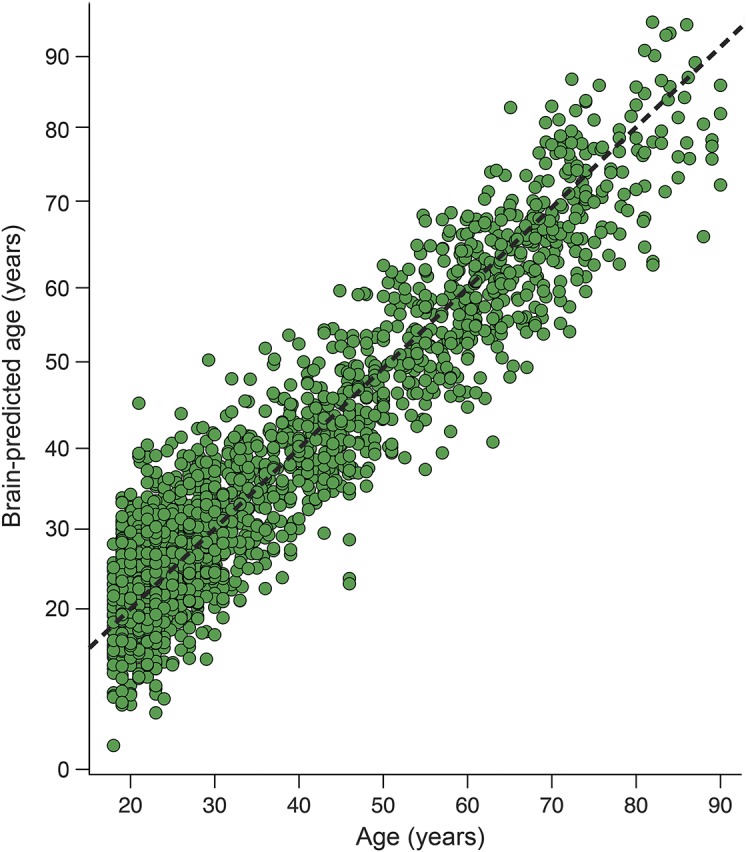
Scatterplot of chronological age (x-axis) and predicted brain age (y-axis), based on results of 10-fold cross-validation of the Gaussian processes regression model in the training dataset (n = 2,001). Dashed line (black) represents the line of identity (y = x), where predicted age = chronological age.
Brain-predicted age difference is higher in HIV-positive individuals.
HIV-positive individuals showed increased brain-PAD (brain-predicted age − chronological age) scores, compared to HIV-negative individuals (b = 3.31, SE = 1.0, t = 3.30, p < 0.01, η2 = 0.031; figure 3A). Mean brain-PAD score in HIV-positive individuals was 2.15 (SD 7.79) years, while in HIV-negative individuals it was −0.87 (SD 8.4) years. HIV-positive individuals' brain-PAD scores were greater than the training set mean (i.e., brain-PAD of 0) (t = 3.51, p < 0.01), while HIV-negative individuals' brain-PAD scores were not (t = −1.05, p = 0.3). Brain-predicted age correlated with chronological age in both groups (HIV-positive: r = 0.75, p < 0.01; HIV-negative: r = 0.69, p < 0.01; figure 3B). Importantly, there was no interaction between age and group in predicting brain-PAD (p = 0.28), indicating that the association with HIV disease did not vary as a function of chronological age.
Figure 3. Predicted age differences in HIV infection.

(A) Grouped data plot of brain-predicted age difference (brain-PAD) in HIV-positive individuals (red triangles) and HIV-negative controls (blue spots). Solid black lines indicate group mean brain-PAD values. (B) Scatterplot of chronological age in years (x-axis) against predicted brain age (y-axis) generated using structural neuroimaging. Points indicate HIV-positive individuals (red triangles) and HIV-negative controls (blue spots) and lines are regression lines for each group (HIV-positive = red; HIV-negative = blue), with 95% confidence intervals displayed. Dashed gray line is the line of identity (y = x).
HIV-positive individuals show evidence of impaired cognitive performance.
HIV-positive individuals showed impaired neuropsychological performance relative to HIV-positive controls in multiple cognitive domains. These were as follows: attention (W = 10,683.5, p < 0.01), processing speed (W = 10,674.5, p < 0.01), executive function (W = 10,004.5, p = 0.01) and motor function (W = 9,874, p = 0.02), alongside global cognitive performance (W = 10,499.5, p < 0.01). For language fluency (p = 0.30) and memory (p = 0.38), t scores did not differ between HIV-positive and HIV-negative groups. Global deficit score categorization showed that cognitive impairment was more common in the HIV-positive group compared to HIV-negative controls (number cognitively impaired: HIV-positive = 31 [19.1%], HIV-negative = 6 [5.7%], odds ratio 3.92 [95% confidence interval 1.53–11.94], p < 0.01).
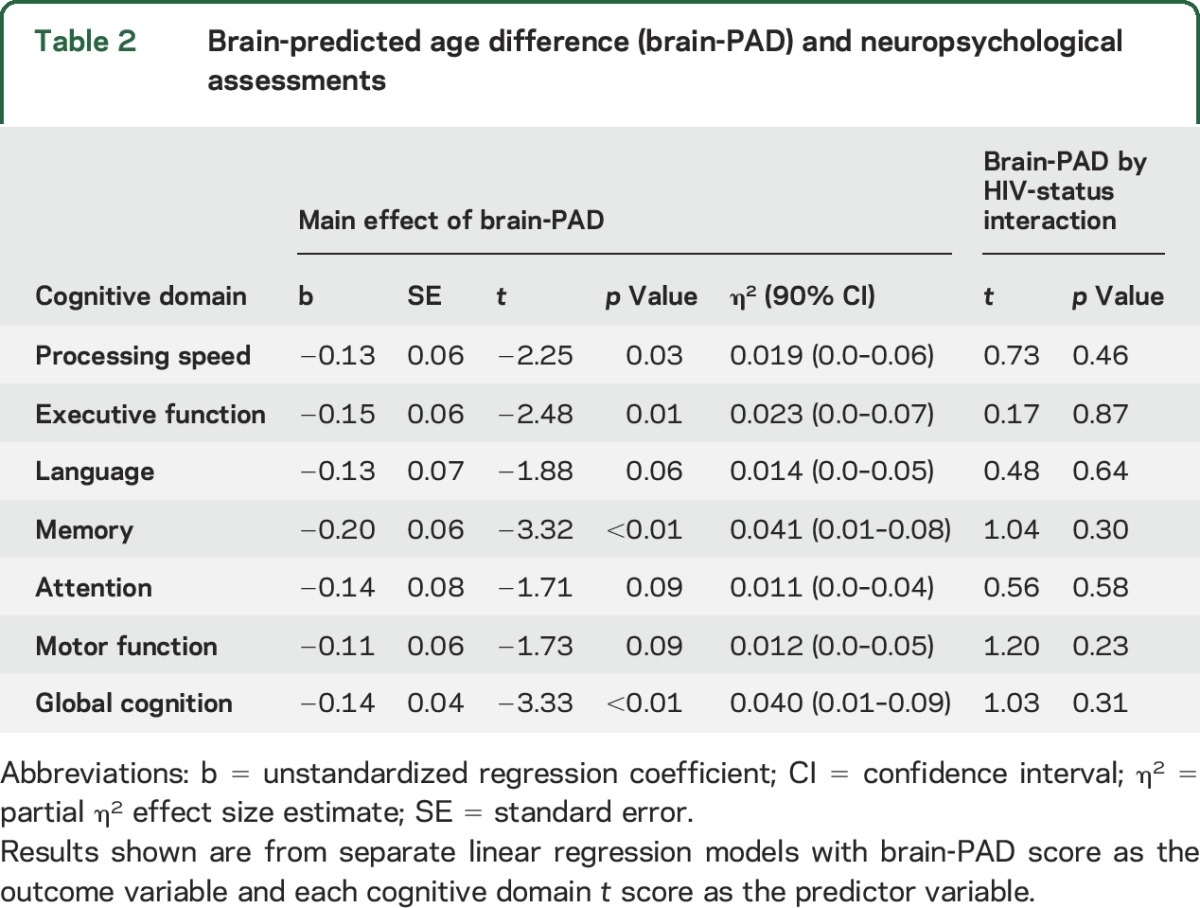
Brain-predicted age difference correlates with cognitive performance.
Brain-PAD related to cognitive performance across HIV-positive and HIV-negative participants. Brain-PAD was inversely associated with performance in the domains of information processing speed, executive function, and memory, and with global cognitive performance (table 2). Trend-level associations were evident for attention, language, and motor function (0.05 < p < 0.1). Interactions between HIV status and brain-PAD were not significant for any cognitive domain (p > 0.1), indicating that the influence of brain-PAD on cognitive performance did not vary according to HIV-status. Brain-PAD score did not differ based on global deficit score categorization of cognitive impairment (p > 0.1), either when grouping all participants together or when looking solely within HIV-positive individuals.
Table 2.
Brain-predicted age difference (brain-PAD) and neuropsychological assessments
Associations with HIV-related factors.
HIV-related clinical measures were generally unrelated to brain-PAD score in HIV-positive individuals (all p > 0.1). These included years since HIV diagnosis, duration of cART, nadir CD4 count, months spent with CD4 count <500 cells/μL, current CD4 count, current CD8 count, and CD4:CD8 ratio or a prior diagnosis of AIDS. We also assessed whether factors such as a history of hepatitis B or C infection, syphilis, cigarette smoking (pack-years), and recreational drug use within 6 months influenced brain-PAD in HIV-positive individuals; however, no associations were evident (all p > 0.1).
DISCUSSION
Increased levels of age-associated changes to brain structure were evident in HIV-positive individuals with suppressed plasma HIV viremia, compared to a highly comparable HIV-negative group. The magnitude of increased brain aging (i.e., brain-PAD score), derived from structural neuroimaging, related to neuropsychological test scores. Individuals with older brain-predicted ages, relative to chronological age, showed deficits in information processing speed, executive function, memory, and global cognitive performance. Brain-PAD score did not correlate with chronological age or duration of infection, suggesting that HIV disease does not accelerate the rate of age-associated brain atrophy.
Increased brain-PAD was associated with poorer cognitive performance in multiple domains. The characteristic pattern of age-related cognitive decline is associated with impairments in processing speed, executive function, and memory, while vocabulary and general knowledge are thought to be relatively stable.26 The largest effect sizes for a relationship with brain-PAD score were found for memory, executive function, and processing speed, similar to the expected pattern of typical cognitive aging. However, at least borderline effects were seen in all domains and the strength of these associations was relatively modest. This means that we cannot definitively conclude whether changes in brain-PAD score relate specifically to cognitive aging or more general cognitive impairment. Moreover, cognitive performance between domains is likely to be interrelated, potentially driven by information processing speed,27 or general intelligence. Interestingly, the relationship between brain-PAD and cognitive performance was seen in both HIV-positive and HIV-negative groups, despite observing greater cognitive impairment in HIV-positive individuals. This implies that brain-PAD reflects a general relationship between brain structure and cognition. HIV is potentially accentuating these age-related changes in brain structure, which then drives deficits in cognitive performance. That the damage to the brain in HIV relates to that seen in normal aging agrees with previous work that has reported a spatial overlap between HIV-associated brain regions and regions associated with aging and cognitive performance in both HIV-positive and HIV-negative individuals.11 Hence, it is plausible that chronic HIV disease could be driving atrophy in brain regions that commonly change with advancing age, resulting in deficits in cognitive performance.
Our results suggest that chronic HIV disease may cause abnormal brain aging, which could be either accelerated or accentuated.28 Accelerated aging implies an interaction with aging that progressively increases the risk of age-related morbidity, while accentuated aging implies that some initial process increased the burden of aging-related damage but remains static over time. Our findings favor the latter interpretation, as we found no relationship between brain-PAD score and chronological age or duration of HIV diagnosis. This fits with evidence from neuroimaging studies that have demonstrated independent effects of aging and HIV on the brain,10,11,16,19,29 and does not support reports of accelerating effects.12,21,30 However, these previous studies often included a preponderance of untreated individuals, those with detectable HIV viremia, or younger adults (i.e., <50 years old). These findings are difficult to extrapolate to older, well-treated HIV-positive populations, where the effects of aberrant aging will be more pertinent. Furthermore, inferences regarding duration of HIV diagnosis as a proxy of duration of actual HIV infection must be made cautiously when date of seroconversion is unknown.
Clinical parameters relating to HIV were not associated with brain-PAD. Previous research has associated nadir CD4 count14,15 and duration of known HIV infection13,17 with measures of brain structure, although not universally.10,16,19 The nature of the participants in these studies differs substantively from ours. In general, HIV-positive individuals in our study were older, and all were effectively treated with cART and had higher CD4 counts. Crucially, our HIV-negative control group was recruited to be highly comparable, reducing the influence of important confounding factors such as cigarettes, alcohol, and recreational drug use. The lack of association with current HIV-related parameters indicates that when viral replication is suppressed, such factors may have limited ongoing relevance to brain health.
Neuroimaging-based age predictions may represent a biomarker of the aging process. Such measures could potentially track neurodegeneration in the aging HIV-positive population and identify those at greater risk for poor cognitive outcomes. Cellular and molecular markers of biological aging have also indicated age-like increases in HIV, using telomere length, markers of CD8 T-cell senescence and DNA methylation levels.31–35 Our findings generally concur with these reports, which suggests that individuals with chronic HIV disease also experience increased accumulation of the cellular damage associated with aging, resulting in age-like brain atrophy. HIV-positive individuals were on average more than 3 years older compared to the control group. This is a lower estimate compared to age predictions from the epigenetic clock, where brain tissue and blood resulted in 7.4 and 5.2 years of increased aging, respectively.32 Whether this is due to differences in the methods or the characteristics of the HIV-positive individuals is unclear. A major consideration of DNA-based aging biomarkers is the type of cells used to derive the estimates. T cells, for example, may well have been affected by the presence of HIV. Brain age and DNA methylation age prediction methods are conceptually similar and it would be of interest to compare age predictions made using DNA methylation profiles and structural neuroimaging. Furthermore, integrating multiple sources of molecular, cellular, and physiologic data could provide highly informative insights into distinct compartments of biological aging or improve estimates of a more global biological age measure. Accurate aging biomarkers have great potential for detecting heightened risks of age-associated diseases in HIV-positive individuals and may aid in the design and recruitment of clinical trials of treatments aimed at reducing the burden of comorbid disease.
We observed lower brain volumes in HIV-positive individuals, presumably due to atrophy. Our model allows us to quantify this change and relate it to brain structure in healthy individuals. HIV-positive individuals had brains that resembled individuals 2.15 years older. We interpret this as increased brain aging, although one must be cautious in interpreting the results in this way. Brain atrophy does not necessarily mean aging per se. For example, neurologic insults (e.g., stroke, focal lesions from a traumatic brain injury, encephalitis) can result in brain tissue loss that is not primarily due to aging. However, our participants were free from a history of cerebral infections or focal neurologic injury. Hence, gross insults are unlikely to be driving the results. The observed brain tissue loss is likely to be the result of historical damage or the gradual buildup of deleterious factors, such as persistent neuroinflammation. It is unclear whether the biological mechanisms underlying brain tissue loss in HIV are the same as the mechanisms involved in brain aging. However, what is evident at the macroscopic level we have studied (i.e., volumetric MRI) is that the HIV brain appears prematurely aged.
Our study has further limitations. One is the cross-sectional design employed. Longitudinal studies are necessary for examining individual-specific trajectories of brain aging36 to properly evaluate evidence for accelerated aging. Also, brain-PAD showed high variability, indicating that it is potentially noise-prone. However, as ground truth brain age is unobtainable, this variation could be either measurement error or meaningful interindividual variability. However, high between-scanner reliability (intraclass correlation coefficient 0.95) and correlations with cognitive performance and other real-world measures in this and previous studies22 support the use of such a measure to index age-related changes to brain structure. Other limitations are that our sample predominantly included white, northern European men. HIV is a global pandemic, thus corroboration of increased brain age in HIV in other populations is important.37 Individuals in the training dataset used in the current study were generally not explicitly screened for HIV infection, though all were assessed to be cognitively normal and free of potentially confounding conditions. Undiagnosed rates of HIV are low (<1%), so this would have been unlikely to confound the results. Also, we did not investigate other HIV-related factors not directly associated with the virus that could also affect brain aging, such as antiretroviral toxicity, lifestyle, and cardiovascular disease.38 Finally, our machine learning method benefits from using a large independent normative database, where the relationship between 3D brain volume maps and age is modeled across the adult lifespan. However, HIV disease may result in specific brain changes that are not captured by this model and may explain some of the observed cognitive deficits. For instance, treated HIV has been associated with microstructural WM abnormalities39 and WM hyperintensities40 that would not be detected by our model. Future studies could incorporate further imaging modalities to better model differential patterns of brain aging in HIV.
HIV-positive individuals with undetectable plasma HIV RNA showed increased brain age, estimated using structural neuroimaging. This increase in apparent brain age related to neuropsychological performance across multiple cognitive domains, indicating that brain-predicted age may tap into aspects of cognitive aging, a major risk factor for negative long-term outcomes in older adults with HIV disease. However, chronological age was not associated with the magnitude of increased brain age. Thus our results are more consistent with the idea of accentuated, rather than accelerated, brain aging in treated HIV disease.
Supplementary Material
ACKNOWLEDGMENT
The authors thank the participants of the COBRA study.
GLOSSARY
- Brain-PAD
brain-predicted age difference
- cART
combination antiretroviral therapy
- COBRA
Comorbidity in Relation to AIDS
- FOV
field of view
- GM
gray matter
- ICV
intracranial volume
- MAE
mean absolute error
- MNI152
Montreal Neurological Institute 152
- RMSE
root mean squared error
- TE
echo time
- TR
repetition time
- WM
white matter
Footnotes
Supplemental data at Neurology.org
Contributor Information
Collaborators: COBRA collaboration, J. Schouten, K.W. Kooij, B.C. Elsenga, F.R. Janssen, M. Heidenrijk, J.H.N. Schrijver, W. Zikkenheiner, M. van der Valk, A. Henderiks, N.A. Kootstra, A.M. Harskamp-Holwerda, I. Maurer, M.M. Mangas Ruiz, T. Booiman, A.F. Girigorie, J. Villaudy, E. Frankin, A. Pasternak, B. Berkhout, T. van der Kuyl, J.A. ter Stege, M. Klein Twennaar, T. Su, E. Siteur-Van Rijnstra, K. Weijer, P.H.L.T. Bisschop, A. Kalsbeek, M. Wezel, I. Visser, H.G. Ruhé, L. Tembo, M. Stott, K. Legg, A. Lovell, O. Erlwein, N. Doyle, P. Norsworthy, P. Garagnani, C. Pirazzini, M. Capri, F. Dall’Olio, M. Chiricolo, S. Salviol, J. Hoeijmakers, J. Pothof, D. Burger, M. de Graaff-Teulen, A. Bürkle, T. Sindlinger, M. Moreno-Villanueva, A. Keller, M. Prins, M. Martens, S. Moll, J. Berkel, L. Möller, G.R. Visser, S. Zaheri, M.M.J. Hillebregt, Y.M.C. Ruijs, D.P. Benschop, M. Gisslén, D. Fuchs, H. Zetterberg, C. Libert, S. Dewaele, and G. Guaraldi
AUTHOR CONTRIBUTIONS
Design or conception of the study: J.H.C., A.W., C.A.S., C.B.L.M.M., F.W.N.M.W., P.R., D.J.S. Analysis and interpretation of data: J.H.C., J.U., M.W.A.C., D.D.F., R.A.v.Z. Drafting the manuscript: J.H.C., J.U., M.W.A.C., R.L., A.W., C.A.S., D.D.F., P.R., D.J.S., M.F.S.v.d.L., C.F., G.J.G., P.P., B.A.S., F.W.N.M.W.
STUDY FUNDING
Study funded by the European Union's Seventh Framework Programme (FP7/2007–2013) project (grant agreement no. 305522) for the Comorbidity in Relations to AIDS (COBRA) project.
DISCLOSURE
J. Cole, J. Underwood, M. Caan, D. De Francesco, R. van Zoest, R. Leech, F. Wit, P. Portegies, G. Geurtsen, B. Schmand, M. Schim van der Loeff, C. Franceschi, C. Sabin, C. Majoie, and A. Winston report no disclosures relevant to the manuscript. P. Reiss, through his institution, has received independent scientific grant support from Gilead Sciences, Janssen Pharmaceuticals Inc, Merck & Co., Bristol-Myers Squibb, and ViiV Healthcare; has served on scientific advisory board for Gilead Sciences; serves on data safety monitoring committee for Janssen Pharmaceuticals Inc.; and chaired a scientific symposium by ViiV Healthcare, for which his institution has received remuneration. D. Sharp has previously received funding for an investigator-led grant from Pfizer. Go to Neurology.org for full disclosures.
REFERENCES
- 1.Althoff KN, McGinnis KA, Wyatt CM, et al. Comparison of risk and age at diagnosis of myocardial infarction, end-stage renal disease, and non-AIDS-defining cancer in HIV-infected versus uninfected adults. Clin Infect Dis 2015;60:627–638. [DOI] [PMC free article] [PubMed] [Google Scholar]
- 2.Guaraldi G, Orlando G, Zona S, et al. Premature age-related comorbidities among HIV-infected persons compared with the general population. Clin Infect Dis 2011;53:1120–1126. [DOI] [PubMed] [Google Scholar]
- 3.Schouten J, Wit FW, Stolte IG, et al. Cross-sectional comparison of the prevalence of age-associated comorbidities and their risk factors between HIV-infected and uninfected individuals: the ageHIV cohort study. Clin Infect Dis 2014;59:1787–1797. [DOI] [PubMed] [Google Scholar]
- 4.Kooij KW, Wit FWNM, Schouten J, et al. HIV infection is independently associated with frailty in middle-aged HIV type 1-infected individuals compared with similar but uninfected controls. AIDS 2016;30:241–250. [DOI] [PubMed] [Google Scholar]
- 5.Deeks SG, Lewin SR, Havlir DV. The end of AIDS: HIV infection as a chronic disease. Lancet 2013;382:1525–1533. [DOI] [PMC free article] [PubMed] [Google Scholar]
- 6.Schouten J, Cinque P, Gisslen M, Reiss P, Portegies P. HIV-1 infection and cognitive impairment in the cART era: a review. AIDS 2011;25:561–575. [DOI] [PubMed] [Google Scholar]
- 7.Simioni S, Cavassini M, Annoni JM, et al. Cognitive dysfunction in HIV patients despite long-standing suppression of viremia. AIDS 2010;24:1243–1250. [DOI] [PubMed] [Google Scholar]
- 8.Schouten J, Su T, Wit FW, et al. Determinants of reduced cognitive performance in HIV-1-infected middle-aged men on combination antiretroviral therapy. AIDS 2016;30:1027–1038. [DOI] [PubMed] [Google Scholar]
- 9.Ritchie SJ, Dickie DA, Cox SR, et al. Brain volumetric changes and cognitive aging during the eighth decade of life. Hum Brain Mapp 2015;36:4910–4925. [DOI] [PMC free article] [PubMed] [Google Scholar]
- 10.Ances BM, Ortega M, Vaida F, Heaps J, Paul R. Independent effects of HIV, aging, and HAART on brain volumetric measures. J Acquir Immune Defic Syndr 2012;59:469–477. [DOI] [PMC free article] [PubMed] [Google Scholar]
- 11.Becker JT, Maruca V, Kingsley LA, et al. Factors affecting brain structure in men with HIV disease in the post-HAART era. Neuroradiology 2012;54:113–121. [DOI] [PMC free article] [PubMed] [Google Scholar]
- 12.Cardenas VA, Meyerhoff DJ, Studholme C, et al. Evidence for ongoing brain injury in human immunodeficiency virus-positive patients treated with antiretroviral therapy. J Neurovirol 2009;15:324–333. [DOI] [PMC free article] [PubMed] [Google Scholar]
- 13.Cohen RA, Harezlak J, Schifitto G, et al. Effects of nadir CD4 count and duration of human immunodeficiency virus infection on brain volumes in the highly active antiretroviral therapy era. J Neurovirol 2010;16:25–32. [DOI] [PMC free article] [PubMed] [Google Scholar]
- 14.Jernigan TL, Archibald SL, Fennema-Notestine C, et al. Clinical factors related to brain structure in HIV: the CHARTER study. J Neurovirol 2011;17:248–257. [DOI] [PMC free article] [PubMed] [Google Scholar]
- 15.Pfefferbaum A, Rosenbloom MJ, Sassoon SA, et al. Regional brain structural dysmorphology in human immunodeficiency virus infection: effects of acquired immune deficiency syndrome, alcoholism, and age. Biol Psychiatry 2012;72:361–370. [DOI] [PMC free article] [PubMed] [Google Scholar]
- 16.Towgood KJ, Pitkanen M, Kulasegaram R, et al. Mapping the brain in younger and older asymptomatic HIV-1 men: frontal volume changes in the absence of other cortical or diffusion tensor abnormalities. Cortex 2012;48:230–241. [DOI] [PubMed] [Google Scholar]
- 17.Kuper M, Rabe K, Esser S, et al. Structural gray and white matter changes in patients with HIV. J Neurol 2011;258:1066–1075. [DOI] [PubMed] [Google Scholar]
- 18.Heaps JM, Sithinamsuwan P, Paul R, et al. Association between brain volumes and HAND in cART-naive HIV plus individuals from Thailand. J Neurovirol 2015;21:105–112. [DOI] [PMC free article] [PubMed] [Google Scholar]
- 19.Wade BS, Valcour VG, Wendelken-Riegelhaupt L, et al. Mapping abnormal subcortical brain morphometry in an elderly HIV+ cohort. NeuroImage Clin 2015;9:564–573. [DOI] [PMC free article] [PubMed] [Google Scholar]
- 20.Nir TM, Jahanshad N, Busovaca E, et al. Mapping white matter integrity in elderly people with HIV. Hum Brain Mapp 2014;35:975–992. [DOI] [PMC free article] [PubMed] [Google Scholar]
- 21.Pfefferbaum A, Rogosa DA, Rosenbloom MJ, et al. Accelerated aging of selective brain structures in human immunodeficiency virus infection: a controlled, longitudinal magnetic resonance imaging study. Neurobiol Aging 2014;35:1755–1768. [DOI] [PMC free article] [PubMed] [Google Scholar]
- 22.Cole JH, Leech R, Sharp DJ; for the Alzheimer's Disease Neuroimaging I. Prediction of brain age suggests accelerated atrophy after traumatic brain injury. Ann Neurol 2015;77:571–581. [DOI] [PMC free article] [PubMed] [Google Scholar]
- 23.Gaser C, Franke K, Klöppel S, Koutsouleris N, Sauer H. BrainAGE in Mild cognitive impaired patients: predicting the conversion to Alzheimer's disease. PLoS One 2013;8:e67346. [DOI] [PMC free article] [PubMed] [Google Scholar]
- 24.Franke K, Gaser C, Manor B, Novak V. Advanced BrainAGE in older adults with type 2 diabetes mellitus. Front Aging Neurosci 2013;5:90. [DOI] [PMC free article] [PubMed] [Google Scholar]
- 25.Carey CL, Woods SP, Gonzalez R, et al. Predictive validity of global deficit scores in detecting neuropsychological impairment in HIV infection. J Clin Exp Neuropsychol 2004;26:307–319. [DOI] [PubMed] [Google Scholar]
- 26.Salthouse TA. Selective review of cognitive aging. J Int Neuropsychol Soc 2010;16:754–760. [DOI] [PMC free article] [PubMed] [Google Scholar]
- 27.Salthouse TA. The processing-speed theory of adult age differences in cognition. Psychol Rev 1996;103:403–428. [DOI] [PubMed] [Google Scholar]
- 28.Pathai S, Bajillan H, Landay AL, High KP. Is HIV a model of accelerated or accentuated aging? J Gerontol A Biol Sci Med Sci 2014;69:833–842. [DOI] [PMC free article] [PubMed] [Google Scholar]
- 29.Chang L, Andres M, Sadino J, et al. Impact of apolipoprotein E epsilon4 and HIV on cognition and brain atrophy: antagonistic pleiotropy and premature brain aging. Neuroimage 2011;58:1081–1089. [DOI] [PMC free article] [PubMed] [Google Scholar]
- 30.Wendelken LA, Jahanshad N, Rosen HJ, et al. ApoE epsilon4 is associated with cognition, brain integrity and atrophy in HIV over age 60. J Acquir Immune Defic Syndr 2016;73:426–432. [DOI] [PMC free article] [PubMed] [Google Scholar]
- 31.Zanet DAL, Thorne A, Singer J, et al. Association between short leukocyte telomere length and HIV infection in a cohort study: No evidence of a relationship with antiretroviral therapy. Clin Infect Dis 2014;58:1322–1332. [DOI] [PubMed] [Google Scholar]
- 32.Horvath S, Levine AJ. HIV-1 infection accelerates age according to the epigenetic clock. J Infect Dis 2015;212:1563–1573. [DOI] [PMC free article] [PubMed] [Google Scholar]
- 33.Chou JP, Ramirez CM, Wu JE, Effros RB. Accelerated aging in HIV/AIDS: novel biomarkers of senescent human CD8+ T cells. PLoS One 2013;8:e64702. [DOI] [PMC free article] [PubMed] [Google Scholar]
- 34.Gross Andrew M, Jaeger Philipp A, Kreisberg Jason F, et al. Methylome-wide analysis of chronic HIV infection reveals Five-year increase in biological age and epigenetic targeting of HLA. Mol Cell 2016;62:157–168. [DOI] [PMC free article] [PubMed] [Google Scholar]
- 35.Rickabaugh TM, Baxter RM, Sehl M, et al. Acceleration of age-associated methylation patterns in HIV-1-infected adults. PLoS One 2015;10:e0119201. [DOI] [PMC free article] [PubMed] [Google Scholar]
- 36.Cysique LA, Brew BJ. The effects of HIV and aging on brain functions: proposing a research framework and update on last 3 years' findings. Curr Opin HIV AIDS 2014;9:355–364. [DOI] [PubMed] [Google Scholar]
- 37.Thompson PM, Jahanshad N. Novel neuroimaging methods to understand how HIV affects the brain. Curr HIV/AIDS Rep 2015;12:289–298. [DOI] [PMC free article] [PubMed] [Google Scholar]
- 38.Smith RL, de Boer R, Brul S, Budovskaya Y, van der Spek H. Premature and accelerated aging: HIV or HAART? Front Genet 2013;3:328. [DOI] [PMC free article] [PubMed] [Google Scholar]
- 39.Su T, Caan MWA, Wit FWNM, et al. White matter structure alterations in HIV-1-infected men with sustained suppression of viraemia on treatment. AIDS 2016;30:311–322. [DOI] [PubMed] [Google Scholar]
- 40.Su T, Wit FW, Caan MW, et al. White matter hyperintensities in relation to cognition in HIV-infected men with sustained suppressed viral load on cART. AIDS 2016;30:2329–2339. [DOI] [PubMed] [Google Scholar]
Associated Data
This section collects any data citations, data availability statements, or supplementary materials included in this article.