

Abstract
Real-time microscopic imaging of moving organs at single-cell resolution represents a major challenge in studying complex biology in living systems. Motion of the tissue from the cardiac and respiratory cycles severely limits intravital microscopy by compromising ultimate spatial and temporal imaging resolution. However, significant recent advances have enabled single-cell resolution imaging to be achieved in vivo. In this protocol, we describe experimental procedures for intravital microscopy based on a combination of thoracic surgery, tissue stabilizers and acquisition gating methods, which enable imaging at the single-cell level in the beating heart in the mouse. Setup of the model is typically completed in 1 h, which allows 2 h or more of continuous cardiac imaging. This protocol can be readily adapted for the imaging of other moving organs, and it will therefore broadly facilitate in vivo high-resolution microscopy studies.
INTRODUCTION
Intravital microscopy can offer the ability to visualize and quantitatively measure biological events at the cellular level in the native tissue environment. Advances in optical imaging instrumentation, image analysis and new fluorescent molecular reporters have been combined to provide new opportunities to study the pathophysiology of complex diseases. For example, advanced intravital microscopic imaging has led to important insights in neuroscience1,2, immunology3,4 and cancer biology5–7, in which window chamber preparations or externalized organ segments can be more readily imaged using conventional microscopes. However, the use of intravital microscopy to image the orthotopic beating heart has been much more difficult because of the rapid motion of the contracting myocardium. Prior approaches have therefore largely relied on noncontracting in vitro preparations or Langendorf perfusion models8–10. Recently, our group11,12 and others13,14 have developed newer approaches to stabilize the beating heart and thus perform orthotopic intravital imaging. We have combined efficient tissue stabilization and cardiac gating approaches11, as well as motion artifact–free measurement of cardiac function in individual cardiomyocytes in the heart12. These approaches are compatible with most commercially available confocal and multiphoton imaging systems, and they therefore promise to be widely available for investigations of cardiovascular disease in the mouse model.
This paper describes our technology for cardiac intravital microscopy in the mouse. We provide specific protocols for the equipment setup, imaging and data processing to achieve stateof- the-art microscopic imaging. The protocol is organized in six different phases summarized in Figure 1. Although we focus on cardiac imaging, the principles can be applied to any other organ in which physiologic motion–induced artifacts are present.
Figure 1.

Schematics of the protocol. This protocol illustrates a methodology for cardiac intravital microscopy in the mouse. The protocol is divided into six different phases. Phase 1, from Steps 1–9, details the electronics and the microscope setup for imaging and data acquisition. Phase 2, from Steps 10–20, illustrates the necessary steps for anesthesia and animal monitoring during the entire duration of the protocol. Phase 3, from Steps 21–34, details the surgical procedure for cardiac intravital microscopy. Phase 4, from Steps 35–40, explains the correct procedure for stabilizer positioning. Phase 5, from Steps 41–45, gives the necessary steps for both microscopy imaging and data acquisition. Finally, Phase 6 from Steps 46–48 highlights data processing routines for final image reconstructions. The approximate cost for the hardware, software and all reagents that are necessary to perform the protocol is in the range of $650,000, $6,000 and $3,000 (in USD), respectively. All animal procedures and protocols were approved by the Institutional Animal Care and Use Committee of the Massachusetts General Hospital, and they are in accordance with the NIH Guide for the Care and Use of Laboratory Animals.
Applications of the method
Intravital microscopy in the mouse heart promises to have wide application in the study of heart disease and novel therapeutics. The mouse offers a powerful array of surgical and transgenic models of disease, and it has been extensively used for preclinical investigation. By using these protocols, subcellular spatial resolution and millisecond temporal resolution images of the beating heart can be achieved and imaging can be performed serially over hours. Fluorescent reporter technologies can be combined to add molecular pathway–specific readouts. This capability will enable rich characterization of cellular physiology and cell-to-cell interaction in the heart. Areas of particular promise for cardiac intravital microscopy include quantitative measurement of myocyte contraction and excitation-contraction coupling in systolic and diastolic heart failure, mechanisms of arrhythmia in acquired and genetic forms of heart disease, microvascular physiology and collateral formation in the ischemic heart, pharmacokinetics of novel drug therapies in the injured and healing myocardium, and leukocyte trafficking and cell death in myocardial infarction and heart failure.
Comparison with other techniques for cardiovascular investigation
Macroscopic imaging techniques such as MRI or computed tomography offer information about the structure and function of the whole heart, and they are crucial to the preclinical assessment of pathology in animal models. However, they lack the necessary spatial resolution to measure events at the cellular level. In vitro cellular assays are therefore essential for describing the molecular underpinnings of cardiovascular disease. Intravital optical microscopy and molecular imaging can fill an important void between these two scales of investigation by integrating pathway-specific information that is assessed at the subcellular level in the intact, native organ. The contracting Langendorf heart preparation offers an alternative setup for the study of cardiac biology, and the tissue stabilization and gating methods described here can also be readily used with it. However, this is an in vitro setup with important changes to native physiological parameters in the absence of systemic circulation or sympathetic nervous control. Similarly, heterotopic heart transplantation has been used for intravital imaging13, but this technique cannot adequately represent the physiologic loading conditions of the orthotopic heart. Intravital microscopy in the native beating heart is therefore uniquely suited to directly observe and monitor cellular interactions and dynamic physiology in vivo, and it will open new windows on biology in the contracting heart, such as the assessment of infiltrating immune cells in response to injury.
Experimental design
Periodic movement from cardiac contraction and respiration are the dominant sources of motion artifacts in intravital microscopy. As this physiologic motion occurs on the time scale of a single image acquisition, it can severely limit image resolution during intravital microscopy. Typical laser-scanning confocal or multiphoton microscopes can scan at a maximum of 15–30 frames per second, which is insufficient to remove motion artifact occurring at 7–9 Hz because of cardiac contraction. Higher-speed acquisition based on charge-coupled device (CCD) detection (e.g., wide-field imaging, spinning disk microscopy) helps minimize motion-induced artifacts, but at the price of reduced signal-to-noise ratio and imaging resolution. We have therefore developed a motion artifact removal protocol that is compatible with a conventional laser-scanning imaging device. This method uses mechanical tissue stabilization to ensure periodic reproducibility in the images and cardiorespiratory gating to remove the predictable, fixed artifacts from the images. Gating can be performed in a retrospective or a prospective manner, and high-resolution images can be assembled from acquired data spanning multiple sequential cardiac and respiratory cycles. Information from sequential images can then be processed using computational algorithms to obtain motion artifact–free images at any point in the cardiac cycle.
Stabilizer design
Mechanical stabilizers (see Fig. 2 for two options) are used to modulate and minimize excessive motion rather than to completely eliminate it. Complete mechanical immobilization will negatively impact physiological function, and it can damage the heart. The goal for intravital imaging is ‘soft’ mechanical immobilization, which gently restricts gross motion of the heart without compromising contractile function. Analogous stabilization approaches have been used in human cardiac surgery to enable coronary artery grafting in the beating heart without the use of cardiopulmonary bypass.
Figure 2.
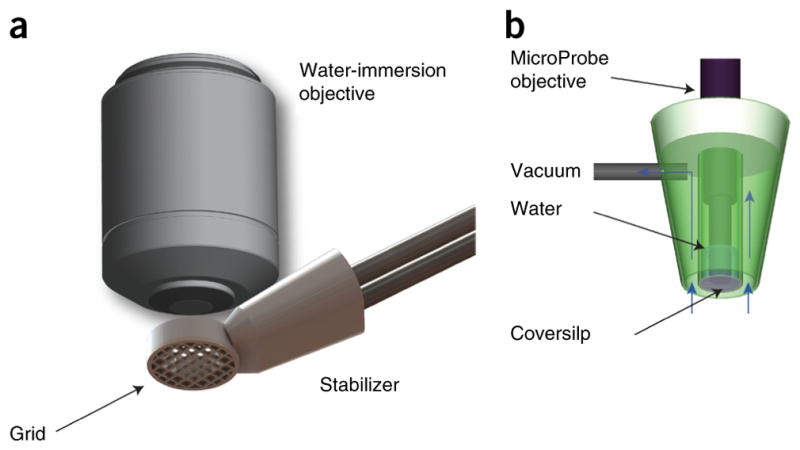
Mechanical tissue stabilizers. Mechanical tissue stabilizers can guarantee reproducibility in the motion over a physiological cycle during intravital microscopy imaging. (a) 3D-printed stabilizer used in the current protocol. The presence of a grid bonded to the pericardium provides efficient suppression of motion artifacts for identification and tracking of individual cardiomyocytes. (b) Suction-based stabilizer. Copyright 2012, from ‘Motion compensation using a suctioning stabilizer for intravital microscopy’ (ref. 15) by Vinegoni, C. et al. Adapted by permission of Taylor & Francis LLC, http://www.tandfonline.com.
The stabilizer presented in this protocol (Fig. 2a) is placed in direct contact with the epicardium. The imaging objective does not contact the heart, and only minimal pressure is present on the heart itself as it contracts against the stabilizer. The heart is essentially free to move during the phases of its cycle, and only its position in time is guided to induce reproducibility. As a result, blood flow is largely unrestricted and any perturbations are typically minimal. Although here we present one particular design of stabilizer, other choices are possible15 (Fig. 2b), and our protocol is not limited to the specific one used herein, provided that the requirements listed above are satisfied.
Acquisition schemes and image reconstruction
In laser-scanning microscopy, the excitation laser point moves along a trajectory across a horizontal imaging plane, and fluorescence signal is captured by a detector. Owing to respiratory and cardiac activity, the scanning point follows a path within the imaged organ that does not coincide with a single horizontal imaging plane across it, but instead spans a curved surface with a profile modulated by both motion and the specified acquisition parameters. As a result, the acquired images present in-frame artifacts (e.g., distortion, blurring) with a degree of severity along a physiological cycle that is a function of the organ’s instantaneous speed. Because of similarities with segmented cardiac gated acquisition schemes commonly adopted in cardiac MRI, different measurement protocols based on assisted motion-synchronized acquisition have been developed16–18. We have recently illustrated two of these approaches that are based either on prospective gating or retrospective triggering11,12.
Gated sequential segmented microscopy (SSM)19,20 adopts a sequential segmented gated acquisition scheme (Fig. 3). Here multiple images are acquired while recording both ECG and ventilation waveforms. Contiguous horizontal image lines (‘views’) drawn by the excitation laser raster path are grouped together in single patches (‘segments’) and gated out from the consecutively acquired images. Specifically, all the segments belonging to a precise gating window TGW of the cardiac cycle and coincident with the end of diastole (ventricles of the heart filling and motion minimal) are merged together giving rise to a final image without motion artifacts and truly representative of a horizontal imaging plane within the heart. In the gating scheme of Figure 3, we have assumed for the sake of simplicity that time gating acquisition windows are constant in length over time. This is actually true if the ventilator is transiently paused to remove residual motion artifact from changes in lung volume. In reality, respiratory motion also needs to be considered (Fig. 4), as does a second gating window.
Figure 3.
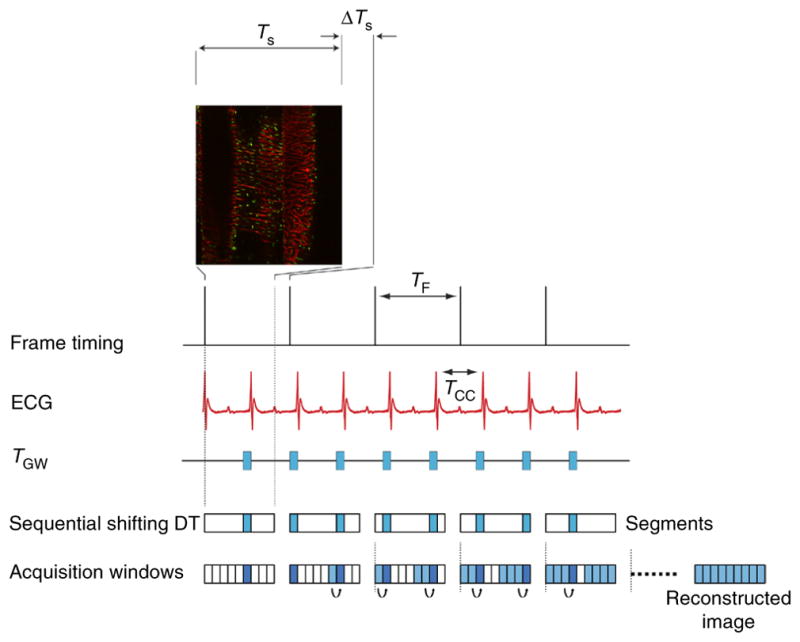
Scheme of principle for gated sequential segmented microscopy. The ‘Frame Active’ timing waveform from the PSU microscopy unit indicates the time at which images are collected when operating in sequential mode. Although a single image has a duration TS, the time between sequentially acquired images is slightly longer (TF) because of the reversal of the galvanometer mirror in the scanning unit. On the basis of the acquired ECG signal, single image segments are extracted from sequentially acquired images in correspondence with the cardiac time gating window TGW. Because cardiac-induced motion is minimal during diastole, TGW is chosen in coincidence with this phase. If a sequential shift is introduced appropriately, the isolated segments can be combined in sequence to give rise to a final motion artifact–free reconstruction. TCC corresponds to the time interval between two cardiac cycles. All animal procedures and protocols were approved by the Institutional Animal Care and Use Committee of the Massachusetts General Hospital, and they are in accordance with the NIH Guide for the Care and Use of Laboratory Animals.
Figure 4.
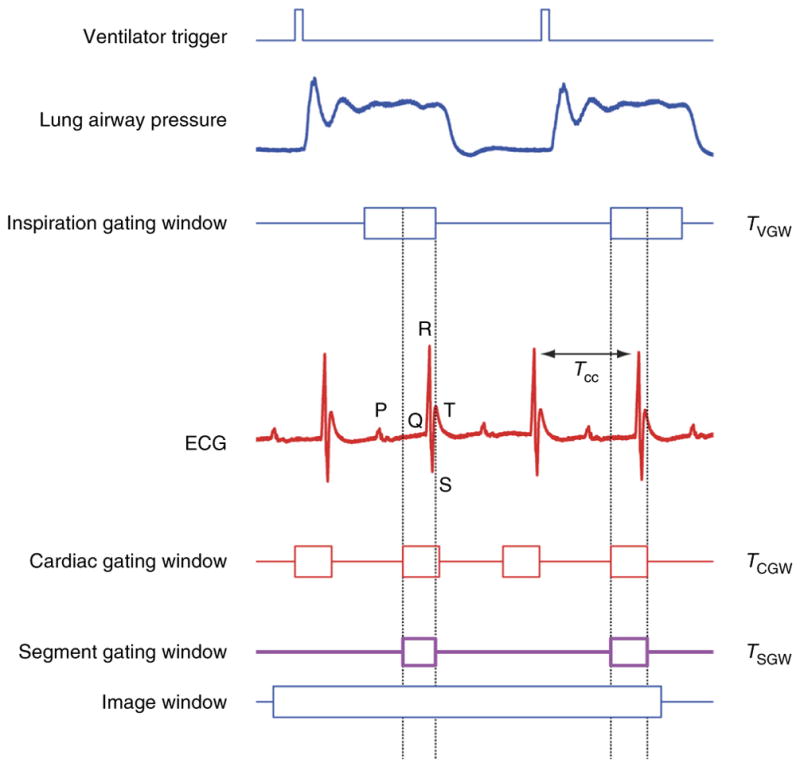
Cardiorespiratory gating. Timing diagram taking into consideration respiratory-induced motion components. The ventilator trigger signal and ECG are recorded and two time gating windows (cardiac TCGW and inspiration TR) are located at points of minimum displacement. TR is usually selected near the end of the inspiration or expiration phase. A new gating window, TSGW, equal to the intersection between the two, needs to be considered in order to isolate within all images all segments that are representative of the same volume.
Prospective sequential segmented microscopy (PSSM) adopts a prospectively triggered acquisition scheme (Fig. 5). Images acquired at a frequency similar to the mouse native heart rate are synchronized to a cardiac pacemaker, which enables precise synchronization of image acquisition with the cardiac cycle. In contrast to retrospective gating approaches, prospective gating provides exact reproducibility in the cardiac cycle, and it is not subject to physiologic variation heart rate or rhythm. By shifting the phase between image acquisition and the pacemaker signal and grouping together all ‘segments’ from consecutive images, which belong to the same time points of the cardiac cycle, one can obtain motion artifact–free image reconstructions of the heart at all phases of the contractile cycle.
Figure 5.

Scheme of principle for prospective sequential segmented microscopy. Microscope acquisition operates at a frequency compatible with a physiologic heart rate. A pacemaker operates at a frequency that is slightly different from the microscope frame-acquisition frequency (TCC < TF). Corresponding to different phases of the cardiac cycle (here represented in different colors), it is possible to isolate specific gating windows. By combining all segments from sequentially acquired images, final motion artifact–free images can be reconstructed at all phases of the cardiac cycle. All animal procedures and protocols were approved by the Institutional Animal Care and Use Committee of the Massachusetts General Hospital, and they are in accordance with the NIH Guide for the Care and Use of Laboratory Animals.
Alternatively, real-time prospective cardiac-gated microscopy can be used for fast imaging. Here, cardiac pacing is in synchronization with image acquisition. Although images in this case will contain motion artifacts, they will be consistently reproducible over the course of the cardiac cycle, and they can be of great use for fast screening and during selection of areas of interest.
Microscope setup
In our imaging setup, we make use of a commercially available imaging microscope (FV1000, Olympus) equipped with several laser lines for confocal imaging and with a Ti:Sapphire laser suitable for two-photon microscopy. Because of the inability to directly trigger acquisition at a fast rate, the microscopy system works as the ‘master’ to determine the timing for the secondary PC (‘slave’ configuration). This is a common limitation present in most commercial units, but custom-made platforms could alternatively be directly controlled from the secondary PC. The software provided (Supplementary Data 1) assumes that the microscope system acts as the master and provides image acquisition timing signals.
A few additional items are required in setting up the microscope intravital imaging platform. The microscope needs to be configured for upright imaging in order to access the thoracic cavity and to place the imaging stabilizer in proper position. In addition, a 3-axis x,y,z translation stage is highly recommended for more accurate positioning. Finally, water-immersion objectives with a 2-mm working distance are recommended for high-resolution imaging when combined with the stabilizer described here.
Acquisition parameters
Acquisition parameters depend on the imaging modality selected. For retrospective sequential segmented microscopy, the microscope should be run in unidirectional mode to allow for a large field of view. Image sizes of 256 × 256, 320 × 240, 320 × 320 and 512 × 512 with pixel integration times of 2–4 μs are recommended. The image size can be chosen depending on the desired quality of the final reconstructed image. It is important to note that a higher pixel density necessitates a higher number of segments necessary to reconstruct the final image. This condition will ultimately affect the number of raw images required. Integration times are not automatically selected by the Olympus Fluoview microscope software, and other choices are therefore possible. We use integration times of 2–4 μs to guarantee optimal signal-to-noise ratio while imaging the heart under low laser-intensity excitation (below 10 mW). Lower values can be chosen when using higher-power laser illumination. Alternatively, higher integration times can also be chosen, which will increase the total amount of time necessary to acquire a single image and to obtain a final artifact-free reconstruction. When you are using prospective gating, the microscope should be run in bidirectional scanning mode with an image size of 256 × 256 pixels and a frame acquisition time of 0.129 s, which is one of the default imaging configurations selectable through the Olympus Fluoview software to control microscopy acquisitions. The number of images to be saved is set according to the user’s preference.
Physiologic monitoring and anesthesia
The imaging protocol described here includes surgical exposure of the heart for possible prolonged imaging sessions up to 2 h. Longer imaging sessions may be possible, but they are currently limited by the nature of the open chest surgery and anesthesia. We use inhaled isoflurane anesthesia via an endotracheal tube inserted for mechanical ventilation. This anesthetic has been extensively tested, and it has relatively moderate cardiac depression compared with some injectable anesthetics21. It is crucial to continuously monitor several physiological parameters to maintain physiological homeostasis. In particular, hypothermia can become a major concern, and the mouse’s body temperature must be maintained near 37 °C using heating pads. We maintain hydration by perioperative fluid administration. In addition, cardiac activity is continuously monitored by ECG, and anesthesia is regulated over the course of the imaging session to prevent adverse effects. Hypothermia and cardiac depression can sometimes be seen as bradycardia or rhythm abnormalities on the ECG. If these are noted, the procedure is generally aborted and the animal is euthanized. For imaging sessions that require very precise monitoring and tight control of physiologic parameters, arterial blood pressure monitoring can be performed with an indwelling arterial catheter in the femoral artery or the carotid artery. We do not generally do this, however, because of the added complexity in placing and maintaining the arterial line through the procedure. Principles of monitoring are similar to, and adapted from, principles of open cardiac surgery and general anesthesia. The protocol by Pacher et al.22 offers additional excellent information about monitoring during open cardiac procedures in the mouse.
Fluorescent imaging reporters
This protocol can be combined with fluorescent molecular imaging probes to study important aspects of cardiovascular biology. Table 1 presents several probes that we have used in our research to identify cells and structures of interest and to study dynamic physiology in vivo. Multichannel illumination and detection can be performed to allow simultaneous investigation of multiple cell types or physiologic processes and to elucidate complex cellular interactions.
TABLE 1.
Fluorescent reporter options.
| Structure or physiology | Fluorescent reporter | Dosing and instructions (see Reagents for supplier information) |
|---|---|---|
| Capillary networks | Lectin: fluorescein or rhodamine label | Inject 50 μl of the 2 mg/ml stock solution directly by tail vein and wait for 10–15 min before imaging. Excite fluorescein label with a 488-nm laser and rhodamine with a 559-nm laser |
| Blood flow | Angiosense-680-IVM | Inject 150 μl at a dye concentration of 2 mol per mouse via the tail vein. Imaging can be performed within minutes of injection. Excite fluorescence using a 635-nm laser |
| Cardiomyocytes |
|
|
| Cell nuclei | Hoechst 33258 | Apply 50 μl of a 1/10,000 solution of Hoechst 33258 topically to the myocardial surface. Excite fluorescence using a 405-nm laser |
| Circulating leukocytes | Rhodamine-6G | Inject 0.2 mg/kg intravenous by tail vein and wait for 10–15 min before imaging. Excite fluorescence using a 559-nm laser |
| Tissue macrophages | CLIO-VT680 | Inject 15 mg of Fe per kg via the tail vein 12–24 h before imaging. Excite fluorescence using the 635-nm laser |
MATERIALS
REAGENTS
Anesthesia and analgesia
Buprenorphine (McKesson). Buprenorphine can be mixed in small batches and stored at room temperature (~21 °C) ! CAUTION Buprenorphine is an opioid agonist and a Schedule III controlled substance with an abuse potential similar to that of other Schedule III opioids. ▲ CRITICAL Store it in a locked drawer at room temperature away from heat and light until its expiration date.
Forane isoflurane (McKesson). Isoflurane should be used directly from manufacturer stock and stored at room temperature. It should not be used past the manufacturer-supplied expiration date ! CAUTION Forane is a halogenated anesthetic agent, and the National Institute for Occupational Safety and Health Administration (NIOSH) recommends that no worker should be exposed at ceiling concentrations >2 p.p.m. of any halogenated anesthetic agent over a sampling period not to exceed 1 h. It is highly recommended to work in a ventilated imaging room, or alternatively to use a proper scavenging system. ▲ CRITICAL Store it in a locked drawer at room temperature.
Pharmacologic agents
Metoprolol succinate (Sigma Aldrich, cat. no. 1441298). Metoprolol can be mixed just before the planned experiment, and it should be used within 24 h
Fluorescent dyes of choice
Angiosense-680-IVM (Perkin Elmer, cat. no. NEV10065). Draw the dose directly from the manufacturer-supplied stock, and store the stock at 4 °C
Fluorescein-labeled Griffonia (Bandeiraea) simplicifolia lectin I (Vector Labs, cat. no. FL-1101). Draw the dose directly from the manufacturer-supplied stock, and store the stock at 4 °C
Rhodamine-labeled Griffonia (Bandeiraea) Simplicifolia lectin I (Vector Labs, cat. no. RL-1102). Draw the dose directly from the manufacturer-supplied stock, and store the stock at 4 °C
Hoechst 33258 (Invitrogen, cat. no. H1399). Draw the dose directly from the manufacturer supplied stock and store the stock at 4 °C
Di-2-anepeq (Biotium, cat. no. 61013). Draw the dose directly from the manufacturer-supplied stock, and store the stock at 4 °C
CLIO-VT680 (Custom made, Massachusetts General Hospital, Center for Molecular Imaging Research Chemistry Core, http://csb.mgh.harvard.edu). Draw the dose directly from the stock and store the stock at 4 °C
Rhodamine 6G (Sigma Aldrich, cat. no. 83697). Doses can be mixed from the stock powder just before the experiment ! CAUTION Fluorescent dyes can be toxic, and they should be handled with care during preparation and tail vein administration. Consult the manufacturer’s MSDS for specific hazards. ▲ CRITICAL Store all dyes in a refrigerator at a temperature of 4 °C.
Oxygen supply
0.9% NaCl Inj USP (Hospira RL-0284)
Surgical tape (3M Tranpore, ref no. 1527-1)
Isopropyl alcohol 70% (MediChoice)
Alcohol wipes (Tyco/Healthcare, Kendall Webcol, cat. no. 6818)
Gauze Sponges (Covidien, cat. no. 2346)
Kimwipes delicate task wipers (Fisher Scientific, cat. no. 34155)
Sutures (Ethilon Black monofilament 8-0)
Hair remover lotion (CVS, cat. no. 867043)
Dust off compressed-gas duster (Staples, cat. no. 416701)
Standard protective equipment: nitrile gloves, mask, hat, lab coat
Cyanoacrylate tissue adhesive (Vetbond, 3M, cat. no. 1469SB or Krazy Glue, Staples, cat. no. 299867)
Mice
C57BL/6, wild type (Jackson Labs). Note that the protocol can also be applied to transgenic mouse strains, including mice expressing fluorescent reporters of interest. We have used various transgenic strains successfully such as the fractalkine Cx3cr1GFP/+, which expresses GFP in macrophage ! CAUTION All animal procedures and protocols must conform to all relevant governmental and institutional regulations. The procedure described herein was approved by the Institutional Animal Care and Use Committee of the Massachusetts General Hospital in accordance with the US National Institutes of Health (NIH) Guide for the Care and Use of Laboratory Animals.
EQUIPMENT
Bead sterilizer, Germinator 500 (CellPoint Scientific, cat. no. 5-1450)
Thermo plate (Olympus Tokai Hit, cat. no. MATS-XZSA)
Rectal thermocouple probe for mice (Harvard Apparatus, cat. no. MLT1404)
Hair trimmer (Harvard Apparatus, cat. no. 340205)
Perfluoroalkoxy alkane (PFA)-insulated stainless steel wire for pacemaker leads (0.002-inch base diameter, 0.0045-inch coated diameter, A-M Systems, cat. no. 790500)
Illuminator (EKE Schott ACEI or Optical Analysis Corporation ACE)
Stereo microscope Olympus SZ61
Bovie (cautery high-temperature fine tip, cat. no. AA01)
PE10 tubing (Scientific Commodities 0.011-inch inner diameter (i.d.); 0.025-inch outer diameter (o.d.), cat. no. BB31695-PE/1)
Needles, 30 gauge (Becton-Dickinson, PrecisionGlide 30G, ½ inch, cat. no. 305106)
Syringes insulin (Becton-Dickinson, Insulin Syringe U-100 29G, ½ inch, cat. no. 309301)
Angiocath for intubation (Exel 22G Safelet Cath 0.085 × 25 mm i.d. 0.65, cat. no. 12H09C)
Dumont no. 3c Forceps (Fine Science Tools, cat. no. 11231-20)
Fine scissors (Fine Science Tools, cat. no. 14060-11)
Fine scissors, curved (Fine Science Tools, cat. no. 14061-11)
Ventilator (Harvard apparatus Inspira ASV 55-7058)
Tubing to/from ventilator
Intubation tilting work stand (Hallowell EMC, cat. no. 000A3467)
Laryngoscope (Welch Allyn, cat. no. 60814)
Olympus FV1000MPE (Olympus USA)
2× air objectives (XL Fluor 2× 340 with 0.14 numerical aperture (NA), Olympus)
25× water objective (XLPlan N W MP 25× 1.05 NA 2 mm WD, Olympus)
Stabilizer positioning arm and translation stage (McMaster and Thorlabs)
Custom-designed tissue stabilizer (see STL and STEP files in Supplementary Data 2)
Electron microscopy grid (cat. no. 12433-CU, Ted Pella)
Personal computer (Secondary PC, PC-S) for data acquisition equipped with 1 PCI slot
Analog stimulus isolator (A-M Systems Model 2200)
Differential amplifier (Warner Instruments, DP-301)
ECG leads (ADInstruments, cat. no. MLA1213)
Data acquisition card (National Instruments, cat. no. NI PCI-6229)
BNC connector block (National Instruments, cat. no. NI BNC-2110)
BNC cables (Digikey, cat. no. ACX1796-ND)
Double banana plug/micro-grabber cable (Digikey, cat. no. 4768-K-48-ND)
Gas anesthesia vaporizer (Midmark model Matrx VIP 3000)
Mouse induction Chamber (Sure-Seal mouse induction chamber, World Precision Instruments)
Activated charcoal filter (F/air scavenger charcoal canister, Harvard apparatus)
MATLAB software for data analysis (MATLAB 2014, Mathworks)
Labview software for visual programming and data acquisition (Labview 2010, National Instruments)
EQUIPMENT SETUP
Custom intravital microscopy system
An overview of the essential components of the equipment setup needed for the protocol is shown in Figure 6. The cardiac intravital microscopy system (IMS), shown schematically in Figure 7, is based on a commercially available Olympus FV1000-MPE confocal and multiphoton microscope. Although this protocol uses an Olympus system controlled by a primary personal computer (PC-P), it is straightforward to extend it to most commercially available or custom-designed high-speed laser scanning microscopes. The IMS consists of animal ventilation and monitoring equipment in combination with the Olympus microscope, and it is interfaced with a secondary PC (PC-S) that records physiological and timing signals and provides cardiac pacing capability through a custom-written Labview software interface (Supplementary Data 1). A differential amplifier (Warner Instruments DP-301) is configured to provide a single-lead ECG. Animal ventilation is performed with a volume-control ventilator (Harvard Apparatus, ASV Inspira 55–7058), which provides the synchronization output. The secondary PC uses a data acquisition card (NI PCI-6229) to record the animal’s ECG, as well as the analog input synchronization signals from the microscope power supply unit (FV10-PSU, Frame Active signal) and the ventilator (Sync Out signal). Cardiac pacing is performed by supplying an analog output voltage waveform to a stimulus isolator (AM Systems, 2200 stimulator) operating in voltage-to-current conversion mode.
Figure 6.

Overview of the essential equipment setup necessary to use the protocol. (a) Surgical tools. (b) Stereomicroscope. (c) Ventilator and intubation tilting work stand. (d) Laser-scanning microscope for intravital imaging. (e) A typical integrated imaging platform. (f) Image acquisition and data monitoring is displayed during an intravital imaging session.
Figure 7.

Schematic of the cardiac intravital microscopy system for confocal and two-photon imaging. Timing waveforms from an animal ventilator and an ECG monitoring amplifier are recorded in combination with the ‘Frame Active’ signal from the microscopy PSU unit. When you are performing prospective sequential segmented microscopy, a triggered pacemaker device is also inserted (red wirings in the figure) to actively pace the heart at a frequency slightly different from the microscope acquisition frequency.
Olympus FV1000-MPE microscope configuration
The Olympus FV1000-MPE system can operate in confocal or multiphoton imaging modes. In confocal mode, fluorescence can be excited at wavelengths of 405, 559 or 635 nm provided by solid-state diode lasers. A multiline Argon laser also provides excitation wavelengths of 488 and 515 nm. Filter-based detection is used with up to four simultaneous emission channels. Multiphoton and second harmonic microscopy is enabled using a mode-locked Ti:Sapphire femtosecond tunable laser (Mai Tai DeepSee, 690–1,050-nm tuning range). The femtosecond laser unit is equipped with adjustable dispersion compensation to enable deep tissue imaging within the heart. Dichroic mirrors and emission filter sets allow for simultaneous acquisition of a maximum of four fluorescence channels. The microscope is controlled by the Olympus Fluoview software version 4.2 installed on the PC-P.
Tissue stabilizer construction
For the purposes of this protocol, an adhesive tissue stabilizer (Fig. 2b) is used11,12. Construct the stabilizer using 3D printing (STL format file for 3D printing and STEP format file for 3D CAD are included as Supplementary Data 2) on a 3D printer (Project 3500 HD, 3D Systems) with a medical application–approved material (VisiJet Crystal, 3D Systems); alternatively, similar designs can be made from conventional aluminum machining. Figure 8 illustrates the basic stabilizer assembly from the machined parts. The device is designed to have a sufficient cone acceptance angle to facilitate entry into the thoracic cavity and contact with the heart while also allowing the microscope objective to approach close enough to the tissue surface without touching the stabilizer. The distal stabilizer ring unit has an o.d. of 4 mm and an inner ring diameter of 2.5 mm, respectively. For enhanced stabilization and single-cell imaging, a commercially available electron microscopy grid (12433-CU, Ted Pella) with a 3.0-mm diameter and a 230-μm grid hole diameter can be affixed to the ring using cyanoacrylate adhesive. A thin ring of silicone can also be added on the upper surface of the stabilizer to improve retention of a drop of water on the tissue surface for use with the water-immersion objective lens. The back end of the tissue stabilizer is designed to interface with a multi-joint positioning arm attached to a vertical translation stage.
Figure 8.

Basic assembly of the stabilizer from the 3D machined parts. (a) 3D rendering of the stabilizer. (b) Components necessary to assemble the stabilizer. (c) Glue can be used to guarantee a permanent assembly of the different components. (d) Assembled stabilizer. (e) View in scale of the distal stabilizer ring unit.
Software
We acquire images using the proprietary Olympus Fluoview software provided with the purchase of the Olympus FV1000-MPE system. Timing waveform acquisition and image reconstruction can be performed with commercially available or open-source software packages such as Visual C++ (Microsoft), Python, MATLAB (MathWorks) or LabVIEW (National Instruments). Here we include two programs written in Labview for data acquisition and cardiac gating. Use the first program RetrospectiveGating.vi (Supplementary Data 1) to acquire the timing signal from the microscope (Frame Active signal), the ECG and the ventilator waveform. Save data in a binary file and then analyze and reconstruct using a custom-made MATLAB graphical user interface. Use the second program ProspectiveTriggering.vi (Supplementary Data 1) to acquire the timing signal from the microscope (Frame Active signal), the ECG and the ventilator waveform, while also sending a timed pacing signal to control the heart’s rhythm. Reconstruct images using a custom-made MATLAB program. For the purposes of completing this protocol, it is necessary to have a computer with both Labview and MATLAB installed.
PROCEDURE
Laser-scanning microscope and intravital imaging system initiation ● TIMING 10–15 min
▲ CRITICAL The animal procedures and protocols discussed here were approved by the Institutional Animal Care and Use Committee of the Massachusetts General Hospital, and they are in accordance with the NIH Guide for the Care and Use of Laboratory Animals. Before applying this protocol, make sure that you are in compliance with, and that you have obtained approval from, your own institution’s animal care and ethical review committees.
-
1|
Turn on the microscope controllers, laser subsystems and the PC-P, and launch the Fluoview control software (Supplementary Fig. 1). This protocol discusses results obtained using an Olympus FV1000MPE instrument. See the system user manual for the chosen instrument for precise start-up procedures. Also see the Equipment Setup section of this protocol for additional details about the microscope.
▲ CRITICAL STEP For two-photon microscopy applications, turn on the Ti:Sapphire femtosecond-mode locked laser at least 30 min before initiation of imaging to allow the laser to warm up.
-
2|
Select the microscope objectives. Choose a low-magnification lens (2–4×) for alignment purposes and a high-magnification lens (25–40×) for cellular imaging applications. This protocol uses Olympus lenses—a XL Fluor 2× 340 with a 0.14 NA for large field of view alignment, and an XLPlan N W MP 25× 1.05 N.A for high-resolution imaging in both confocal and two-photon modes.
-
3|
Set the microscope acquisition parameters using the software interface (Supplementary Fig. 1). See the Experimental design section for additional details about typical imaging parameters.
-
4|
Turn on the PC-S and launch the Labview-based monitoring programs (Supplementary Data 2) to record and deliver the physiologic control signals, and acquire the microscope timing data.
▲ CRITICAL STEP Depending on the imaging acquisition scheme you choose, the corresponding Labview program needs to be selected—i.e., RetrospectiveGating.vi (Supplementary Data 2) for retrospective imaging or ProspectiveGating.vi (Supplementary Data 1) for prospective imaging.
-
5|
Connect the ‘Frame Active’ signal output from the Olympus FV10-PSU to the BNC connector block on the PC-S (Supplementary Video 1). This allows for synchronization of microscope acquisition with ECG and ventilator waveforms. The Frame Active signal corresponds to pin number 1 on the 15-pin D-Sub port located on the backside of the PSU control unit for the main scanner, and it should be connected to BNC terminal AI1 of the NI BNC-2110 connector block. During image acquisition, the signal on the ‘Frame Active’ cable is HIGH (>2.9 V) during pixel acquisition, and it is LOW (<0.9 V) during the ‘over scan area’ and ‘retrace area’ phases of the scanning. Instead of the ‘Frame Active’ signal, it is possible to alternatively use the ‘Line Active’ signal from pin number 2 of the D-sub port. Here, during image acquisition, the signal is HIGH when one line is scanned, i.e., from the first pixel to the last one of each line, and it is LOW during the ‘fly-back’ phase. The MATLAB programs accompanying this protocol assume that the input to terminal AI1 is coming from the ‘Frame Active’ line, and therefore modifications to the code need to be implemented in order to obtain proper reconstructions.
-
6|
Connect the BNC terminal–labeled ‘Sync Out’ from the animal ventilator (ASV Inspira 55-7058) to the BNC terminal AI2 of the connector block NI BNC-2110 with a cable (Supplementary Video 1).
-
7|
Connect the output of the ECG amplifier DP-301 to the BNC terminal AI0 of the NI BNC-2110 connector block (Supplementary Video 1). Select the battery-operated amplifier in DC coupling with the knob located on the input panel. To record the animal’s ECG in differential mode, set the switches +in and -in to ON. In the ‘Filters’ panel, select the frequency response to 10 KHz (low pass) and 0.1 Hz (high pass). In the ‘Output’ panel, set the Gain switch to 100× and the DC offset at the output BNC to zero.
▲ CRITICAL STEP Because the amplifier is battery-operated, check that sufficient battery life is still available for the course of the experiment. A red LED located in the output panel will illuminate when ~20 h of battery life remains.
-
8|
Prepare the ECG leads for use with the amplifier by connecting two ‘BNC male to double-stacking binding post jack’ adapters (501-1033-ND, Digikey) to the two BNC inputs located in the Input panel. Bridge the grounds of both adapters using a cord patch banana plug (501-1328-ND, Digikey) inserted in the adapters’ black jacks. Insert the green and red wire ends of the electrode leads (ADInstruments, MLA1213) in the 2.54-mm in-line cross holes of the red banana jacks of Input 1 and Input 2, respectively. Inset the black lead into either one of the in-line cross holes of the previously bridged black banana jacks.
-
9|
Set up the pacemaker by connecting the ‘Signal In’ port on the AM Systems 2200 Stimulator to the AO0 port on the NI BNC-2110 using a BNC cable (Supplementary Video 1). Also connect a double banana plug/micrograbber cable (Digikey) to the ‘Output’ ports on the interface front panel. Set the polarity to + and the range to 0.1 mA/V.
■ PAUSE POINT The basic microscope setup and system connections can be set up in advance of any animal experiments, and the setup does not have to be repeated before each experiment. In our laboratory, we leave the cardiac IMS intact between experiments. Before each successive experiment, it is therefore only necessary to repeat the power-up steps for the components (Steps 1–4).
Animal monitoring, anesthesia and intubation ● TIMING 15–20 min
-
10|
Administer analgesia with buprenorphine, 0.1 mg/kg s.c., to the mouse between 30 and 60 min before surgery.
-
11|
Turn on the anesthesia unit with a flow of 100% oxygen at a rate of 1.5–2 liters per minute mixed with 4–5% (vol/vol) isoflurane delivered to an anesthesia chamber (Fig. 9a), and place the mouse in the chamber. Rapid induction of deep anesthesia is recommended for optimal surgical preparation.
! CAUTION Take precautions to avoid inhalation of isoflurane during the procedure using a well-ventilated room and a scavenging system. Activated-charcoal filters can be used to capture exhaust from the anesthesia chamber or from the ventilator. Runoff gas from the nose cone anesthesia unit can be removed using a suction hose connected to a ventilated house vacuum line.
? TROUBLESHOOTING
-
12|
Place the anesthetized mouse on a heated plate with a nose cone providing 100% oxygen mixed with 1.5–2% (vol/vol) isoflurane, and tape the four paws to an 1/8-inch-thick aluminum plate, which will serve as the back board for the animal during the procedure. The mouse’s body temperature should be maintained at 37 °C using a heating plate with a rectal thermometer feedback control. For a simpler setup, use a heat plate without feedback control with a temperature of 40 °C, as has been suggested in other surgical protocols21.
-
13|
Perform a toe-pinch test to ensure the absence of the pain reflex before the start of the surgical procedure. If the animal withdraws to pain, increase the dose of isoflurane by 1%, wait for 1–2 min and repeat the toe-pinch test.
? TROUBLESHOOTING
-
14|
Construct an i.v. catheter using PE-10 tubing and the shaft of a 30-G, ½-inch needle. The shaft of the needle can be severed from the plastic hub by using forceps to bend it repeatedly over a 180° arc until it breaks. Flush the catheter with sterile saline using a 29-G, ½-inch insulin syringe.
! CAUTION Avoid bubbles in the infusion line, which can lead to air emboli that can compromise cardiac function.
-
15|
Identify a tail vein as the dark stripe running along the length of either side of the tail. Use forceps to insert the needle at a shallow angle into the tail until blood flashes into the catheter tubing (Fig. 9b). Flush the catheter into the vein using sterile saline. Tape the tail vein in place at multiple points along the tail to ensure stability over the course of the experiment.
-
16|
Insert the ECG leads into the paws’ s.c. tissue (Supplementary Video 2). The ground connection should be placed on the right hind leg, whereas the positive and negative leads should be placed in the right and left front legs to produce a configuration equivalent to that of lead I on a conventional ECG (left arm–right arm).
▲ CRITICAL STEP Make sure that the needles are in secure contact with the s.c. tissue to avoid noise on the ECG signal.
? TROUBLESHOOTING
-
17|
Place the mouse on the intubation tilting work stand and adjust the stand to the upright position. At this point, the isoflurane should still be flowing to the nose of the animal. Use a pair of Adson forceps to gently extend the tongue from the mouth, and then insert the laryngoscope, applying gentle pressure upward on the tongue to bring the vocal cords into direct view.
-
18|
Under the laryngoscope, insert a 22-G angiocath through the vocal cords and into the trachea. Tape the angiocath in place and attach it to the ventilator tubing.
▲ CRITICAL STEP Pay particular care during this procedure to avoid any trauma to the larynx and trachea, which can compromise the animal’s airway.
▲ CRITICAL STEP Switch the isoflurane/oxygen flow to the ventilator and away from the nose cone to enable continuous anesthesia through the ventilator circuit. Check that the chest rises with each breath supplied by the ventilator to ensure correct placement of the angiocath. We use a similar concentration of isoflurane delivered by the ventilator as by nose cone: typically 1.5–2% (vol/vol) isoflurane mixed with oxygen.
-
19|
Adjust the ventilator settings according to the manufacturer’s recommendations for the Harvard Apparatus Inspira ASV unit. For volume control mode, typical tidal volume VT goes according to the equation VT = 0.0062 × Mb 1.01 ml, where Mb is the mass of the animal in kilograms, whereas respiratory rate goes according to the equation fR = 53.5 × Mb−0.26 breaths per min. For a 25-g mouse, typical settings would be VT = 0.15 ml and fR = 140 breaths per min.
! CAUTION To safely eliminate waste anesthesia from the environment, connect the exhaust port of the ventilator to a charcoal-filtration scavenger. Review the manufacturer’s user manual for the ventilator for additional details of the proper setup and exhaust control.
▲ CRITICAL STEP Keep the length of the ventilator tubing as short as possible to prevent the addition of dead space to the ventilator circuit. If long tubing lengths are necessary to accommodate the experimental setup, add additional tidal volume empirically to ventilator settings.
? TROUBLESHOOTING
-
20|
Transfer the intubated animal from the intubation workstand back to the heat plate under the stereo microscope.
Figure 9.

Highlights from two different phases of the protocol. Important steps during phase 2 (animal monitoring and anesthesia) and phase 3 (surgical preparation) of the protocol are highlighted. (a) Isoflurane gas anesthesia vaporizer and delivery chamber. (b) Insertion of the tail vein i.v. line. (c) Primary skin incision. (d) Cautery through the superficial muscle layer to reveal the ribs. (e) Separation of the fourth intercostal space to access the pleural space. (f) Open thoracotomy incision. (g) Exposed heart with the pericardium intact. (h) Pacemaker lead sutured to the ventricular surface. (i) Expanded view of the area indicated with a green box in h. All animal procedures and protocols were approved by the Institutional Animal Care and Use Committee of the Massachusetts General Hospital, and they are in accordance with the NIH Guide for the Care and Use of Laboratory Animals.
Surgical preparation for imaging ● TIMING 15–30 min
▲ CRITICAL Several excellent resources exist discussing thoracotomy procedures for the mouse that complement the procedure steps below23,24.
-
21|
Administer 0.5–1.0 ml of sterile normal saline i.p. to provide hydration during the surgical procedure.
-
22|
Place the animal in the right lateral decubitus position with the left front leg stretched in the cranial direction (Fig. 10).
-
23|
Shave the area over the left side of the thoracic cavity, and then apply a depilatory agent to remove the remaining hair.
-
24|
Remove the hair and excess depilatory cream from the mouse using gauze.
-
25|
Cleanse the left thorax region using topical Betadine.
-
26|
Make a 10–15-mm incision from the left axilla to the left sternal border crossing over the fourth intercostal space using scissors (Fig. 9c).
▲ CRITICAL STEP This step and Steps 27–32 should be done with the aid of a stereomicroscope for enhanced visualization.
-
27|
Use cautery to cut through the s.c. tissue and superficial muscular layer to expose the ribs (Fig. 9d).
! CAUTION Do not injure the pectoralis muscle (Fig. 11) if survival surgery is planned, as this will compromise the ability of the animal to ambulate during recovery. Also avoid injury to the internal thoracic artery, which runs along the lateral aspect of the sternum. If the artery is injured, significant bleeding may occur. Use cautery to stop the bleeding if encountered.
-
28|
Use a pair of forceps with fine tips to lift gently upward on the fifth rib, and then gently puncture through the muscle and underlying pleura of the fourth intercostal space using the tip of the curved scissors. Once into the mediastinum, open the scissors to gently widen the incision (Fig. 9e,f).
! CAUTION Avoid touching the heart or the lung with the scissors during puncture into the mediastinum.
-
29|
Insert retractors on the upper and lower ribs of the incision space, and gently open the mediastinal window (Fig. 9g). Use tape on the retractor thread to hold the position.
-
30|
Incise the pericardium by gently tearing it using a pair of fine-tip forceps in each hand. Separate the pericardium from the heart surface to expose direct access to the myocardium. If retrospective gating only is desired, proceed to Step 33.
▲ CRITICAL STEP Once the pericardium is open, intermittent hydration with isotonic normal saline must be applied to prevent desiccation of the myocardial surface.
-
31|
Fashion the pacemaker leads out of PFA-insulated stainless steel wire by removing the distal 1 mm of the PFA coating from the wire at both ends using a flame.
-
32|
Suture one of the pacemaker leads in direct contact with the left ventricular myocardium using an 8–0 Ethilon suture (Fig. 9h,i), and suture the other lead in contact with the soft tissue overlying the thorax as a ground reference. Connect the other ends of these two leads to the two banana plug connectors that directly insert into the stimulator.
! CAUTION Suturing to the beating heart requires fine control of the instrument. Take care to pass the needle very superficially on the ventricular wall to avoid substantial injury to the myocardium, which may cause severe bleeding or myocardial dysfunction.
-
33|
Cover the animal with a surgical drape leaving open only the mediastinal window to the heart (Fig. 12a).
-
34|
Transfer the animal to the microscope stage (Fig. 12b) for placement of the tissue stabilizer (Fig. 12c–e) and subsequent imaging (Fig. 12f).
Figure 10.
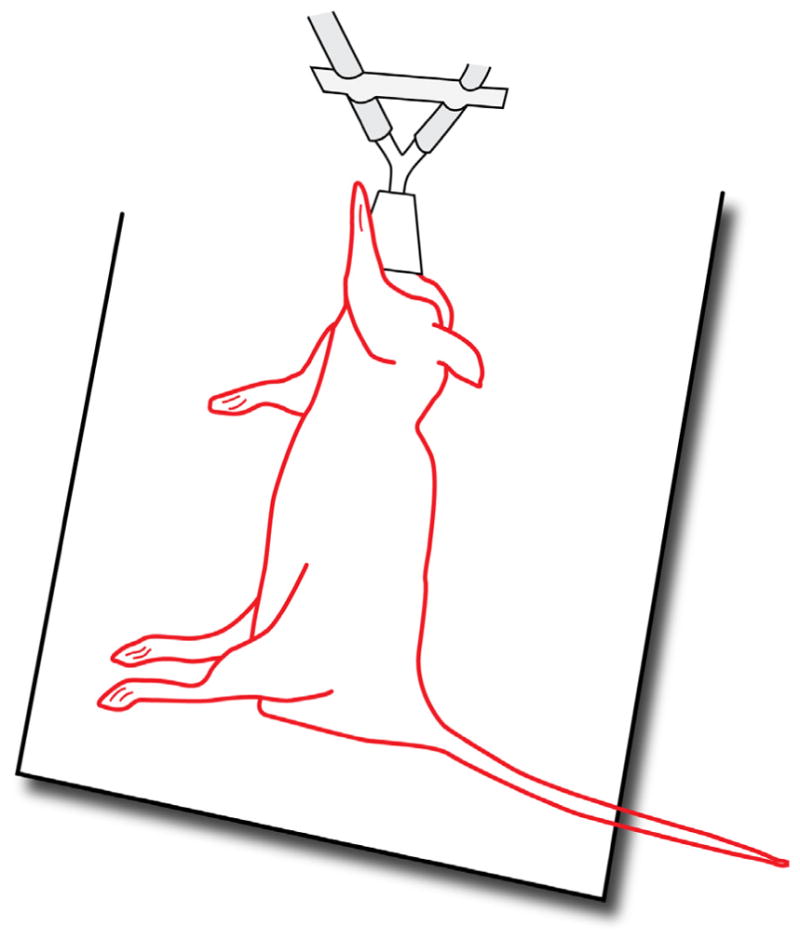
Right lateral decubitus positioning. The drawing illustrates the mouse in the right lateral decubitus position with the left front leg stretched in the cranial direction (Step 22).
Figure 11.
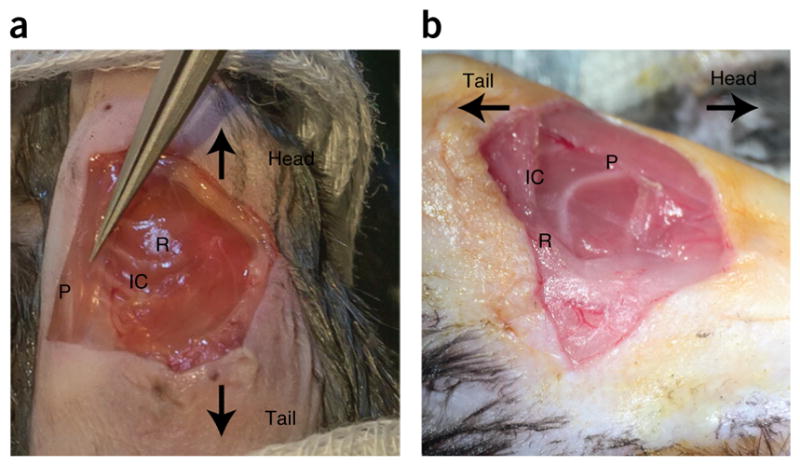
Pectoralis muscle. (a,b) Two views of the pectoralis muscle. The two views indicate how changing the illumination path and angle view with the surgical microscope can help to clearly identify the pectoralis muscle. P, pectoralis muscle. R, rib. IC, fourth intercostal space. Care needs to be taken to not injure the muscle if survival surgery is planned (Step 27). All animal procedures and protocols were approved by the Institutional Animal Care and Use Committee of the Massachusetts General Hospital, and they are in accordance with the NIH Guide for the Care and Use of Laboratory Animals.
Figure 12.

Positioning and intravital imaging of the mouse. (a) A surgical drape covers the animal during the procedure, except for the exposed thoracotomy. (b) The animal is placed under the microscope on a heated stage. (c) The stabilizer also sits on the stage, and it is positioned using a translation stage (d). Imaging is performed without the objective lens contacting the mouse or the stabilizer. (e) A low-magnification lens (2×) helps to identify the region of interest and to position the high-magnification objective at the center of the stabilizer. (f) After positioning, the high-magnification objective is immersed in water for imaging. All animal procedures and protocols were approved by the Institutional Animal Care and Use Committee of the Massachusetts General Hospital, and they are in accordance with the NIH Guide for the Care and Use of Laboratory Animals.
Tissue stabilizer positioning and preparation for imaging ● TIMING 10–15 min
-
35|
Place the tissue stabilizer on to the positioning arm and translation stage (Figs. 12d and 13). For the purposes of this protocol, an adhesive stabilizer is described. To provide improved stabilization, an electron microscopy grid can be attached to the bottom of the stabilizer, as described in Equipment Setup.
▲ CRITICAL STEP Adjust the stabilizer positioning arm and translation stage to place the stabilizer ring as close as possible to the heart surface without coming into contact with it. The tissue adhesive dries very quickly, and the stabilizer must therefore be rapidly positioned on the heart surface once the adhesive is applied to the device.
-
36|
Wick away any excess moisture on the heart surface with a lens tissue or Kimwipe.
! CAUTION Avoid abrading the tissue surface with the wipe, as this may injure superficial cells.
-
37|
Apply a thin layer of cyanoacrylate adhesive to the bottom of the stabilizer using a disposable paintbrush (Fig. 13b and Supplementary Fig. 2a). The adhesive layer should be ~100 μm in thickness.
▲ CRITICAL STEP Avoid applying excessive adhesive to the stabilizer ring, as this will run over the tissue surface and prevent successful optical imaging. The goal is to contact the adhesive only with the heart surface directly under the stabilizer and not in the imaging window. Compressed air can be used to gently blow off excess adhesive from the center imaging window before placement on the tissue surface.
? TROUBLESHOOTING
-
38|
Apply the stabilizer to the heart by gently, but quickly, bringing the device with adhesive into contact with the beating heart (Fig. 13c). The stabilizer should bond to the thin layer or pericardium on the heart surface within seconds, securing the device in place. Allow ~30–60 s to pass before applying liquid again to the heart surface to ensure complete bonding.
-
39|
Verify stabilization of the tissue by visualizing the stabilizer on the heart under the microscope using a low-magnification (e.g., 2×) lens. The stabilized tissue surface will show restricted motion of the heart at the boundary with the stabilizer ring. Apply a drop of saline to the center of the stabilizer to further test the adequacy of the tissue seal (Fig. 13d–f and Supplementary Fig. 2b,c). If the tissue is inadequately stabilized, excess motion will be visible between the heart and the stabilizer, and the device will not hold a drop of saline for tissue immersion. In this case, it will be necessary to remove the stabilizer by applying gentle upward pressure to the device, which effectively peels the thin layer of adhesive from the heart surface. The stabilizer can then be placed again, as described in Steps 36–38.
? TROUBLESHOOTING
-
40|
Select the microscope objective required for the imaging experiment. For standard laser scanning confocal microscopy, various magnifications between 10× and 40× can be used to achieve different fields of view and magnification. For multiphoton microscopy, high-NA lenses (>1.0) must be used to provide sufficient two-photon excitation. In this protocol, an Olympus 25× 1.05 NA lens is used for both confocal and multiphoton imaging, unless otherwise stated (Fig. 13g and Supplementary Video 3).
Figure 13.

Positioning of the heart stabilizer. Different phases during the positioning of the stabilizer. (a) Step 35. (b) Step 37. (c) Step 38. (d) Step 39. Water is placed in the stabilizer. (e) Magnified view corresponding to the red box in d. (f) Water fills the stabilizer. (g) Step 40. All animal procedures and protocols were approved by the Institutional Animal Care and Use Committee of the Massachusetts General Hospital, and they are in accordance with the NIH Guide for the Care and Use of Laboratory Animals.
Administration of stains for intravital imaging ● TIMING 1–2 min
-
41|
Administer the selected fluorescent stains for intravital imaging. Table 1 provides commonly used fluorescent reporters to highlight various cardiac structures or physiology. The route of administration depends on the specific reporter, with some being optimally delivered by an i.v. route and others optimally delivered topically. Stains are typically given 15–30 min before imaging.
! CAUTION For i.v. administration of a fluorescent reporter, avoid giving a total volume of more than 200 μl at any one time. Administration of more than this amount or rapid delivery of even smaller volumes can lead to volume overload of the heart.
Selection of microscope parameters ● TIMING 1 min
-
42|
Set the microscope laser parameters. Select either confocal mode with one-photon visible laser excitation or two-photon mode with near-IR femtosecond laser excitation. Typical one-photon excitation confocal imaging at 488 nm requires between 5 and 10 mW on the sample, whereas two-photon imaging at 910 nm requires between 2 and 10 mW. Choose the desired laser excitation wavelengths to match the chosen intravital fluorescence reporters for the experiment.
! CAUTION Operation of confocal and two-photon microscopes requires training and attention to safety to avoid both personal injury and damage to the equipment. The user should undergo required equipment training and laser safety training and should be thoroughly familiar with the operating manual and standard-use protocols of the imaging device being used. This protocol assumes a general working knowledge of the Olympus FV1000 imaging procedures.
-
43|
Select the appropriate detection light path, including the dichroic mirrors and emission filters. Choose the filter sets that best match the fluorescence emission spectra of the desired reporter agents.
-
44|
Adjust the gain on the photomultiplier tube (PMT) for each fluorescence detection channel. Higher gain enhances the detected signal level but also increases the background noise level in the image. The balance between laser exposure level and PMT gain must be made empirically through adjustment of settings during imaging. In confocal mode, the pinhole diameter can also be adjusted to enhance the detected signal level. However, a larger pinhole diameter decreases the confocal axial resolution, and this must be balanced along with the PMT gain and laser exposure level to optimize the image quality and resolution for the specific fluorophore and structure of interest.
-
45|
Record test images to check for adequate image signal, and to optimize the microscope settings (Supplementary Video 3).
? TROUBLESHOOTING
Acquisition of cardiac gated images ● TIMING 30 min
-
46|
Acquire the gated images. Gated acquisition of cardiac intravital microscopy images can be performed using either retrospective (option A) or prospective (options B or C) modes. Prospective gating requires the added complexity in the acquisition phase of using cardiac pacing, but it offers the advantages of real-time gated image acquisition and the ability to create motion artifact–free images throughout the contractile cycle. Retrospective acquisitions allow simple data acquisition without the need for pacing, but they require more complex postprocessing to reconstruct gated images. This step can be performed using option A, or options B or C, depending on whether retrospective or prospective acquisition is preferred.
(A) Retrospective gating
-
Run the development environment Labview on the PC-S, and open the program ‘RetrospectiveGating.vi’ that is provided as Supplementary Data 1. This launches a data acquisition program that uses modified routines from two separate example Labview programs available from National Instruments: ‘retriggerable_ao.vi’ and ‘Cont Acq&Graph Voltage-To File(Binary).vi’ (Supplementary Fig. 3).
! CAUTION While opening the program, the fields for both the Channel and the Timing parameters are set to the default values. Although all the parameters can be modified by the user before running the program, it is recommended to maintain the default values in order to use the reconstruction software. See Supplementary Table 1 for more details.
-
Click the run button (right arrow icon in the toolbar) or press the Ctrl+R key combination. This opens a dialog box asking for the input of a file name, in which all the data are going to be saved. Choose the desired path and enter the file name. Next, press the OK button in order to start the data acquisition.
▲ CRITICAL STEP Ensure that all hardware I/O channels plugged into the connector block are correctly assigned, as indicated in the previous points and summarized in the ‘Channel Parameters’ panel.
To make sure that all connections are set properly, it is recommended to start a test acquisition and to monitor the ECG and the ventilation signal, as well as the ‘Frame Active’ signal.
Press the ‘Start’ button to initiate the acquisition and ‘Stop’ to terminate it. ECG and ventilation signals, together with the microscope ‘Frame Active’ signal, are acquired and saved into a binary file, which is named ‘BinaryFile.bin’ for convenience.
Set the Olympus FV1000-MPE microscope parameters as suggested in the Experimental design section. The microscope should be run in the unidirectional scanning mode. The number of images to be acquired is set according to the user’s preference.
(B) Real-time prospective cardiac gating
Open the Labview program entitled ‘ProspectiveGating.vi’ (Supplementary Data 1) on the secondary PC. Supplementary Figure 4 provides a screenshot of the software interface. Make sure that the connections are correct, as described above. This software uses modified routines from two separate example Labview programs that are available from National Instruments: ‘retriggerable_ao.vi’ and ‘Cont Acq&Graph Voltage-To File(Binary).vi’.
Select the pacing stimulus pulse information, including the pulse width, pulse frequency, and amplitude in volts. A pulse width of 2 ms, an amplitude of 2 V and a frequency of 7–9 Hz are typical.
Turn on the stimulus isolator (AM Systems 2200) and set the parameters.
-
Test the pacemaker. Select ‘Free Run’ from the ‘Operating Mode’ drop-down menu, and press the ‘Enable Pacing’ button. Run the program by pressing the right arrow in the upper left corner of the program window. Stop pacing by pressing the red ‘STOP ACQ’ button.
▲ CRITICAL STEP Verify that there is capture of the ventricle with the pacing stimulus, which is evident by synchronization of the ECG with the pacing spike train and widening of the QRS component of the ECG. See Supplementary Figure 5, which illustrates capture of the paced signal. To pace the ventricle, the pacemaker frequency must be higher than the native heart rate.
? TROUBLESHOOTING
Enable recording of the ECG, the microscope ‘Frame Active’ signal and ventilator synchronization signals by pressing the ‘Save File’ button. When the program is run, a dialog prompt will request a name and file location for the saved data.
Set the Olympus FV1000-MPE microscope parameters. The microscope should be run in bidirectional scanning mode with an image size of 256 × 256 pixels and frame acquisition time of 0.129 s, which corresponds to a frame rate of 7.75 Hz. Digital zoom can range from 2.0× and higher, corresponding to a maximum field of view of 256 × 256 μm. The digital zoom should be selected to enable sufficient pixel resolution to resolve structures of interest according to general Nyquist sampling considerations. For example, if subcellular features on the scale of 1 μm in size are to be resolved, then a pixel spacing of at most 0.5 μm per pixel must be selected. The number of images to be saved should be set according to the user’s preference.
Select ‘Real-Time—8 Hz’ from the ‘Operating Mode’ drop-down menu. With real-time cardiac gating, the microscope’s ‘Frame Active’ signal is used to trigger each pacing spike such that the image acquisition is precisely synchronized to the cardiac cycle.
Start the Labview program on the secondary PC with both the ‘Enable Pacing’ and ‘Save File’ settings on. Pacing will not start until the microscope acquisition starts.
Start the FV1000 microscope acquisition to acquire a time series of images with the specified number of images. As images are acquired, verify that the capture of the heart with the pacing signal is achieved. The acquired images will now be gated to the cardiac cycle, and only the ventilator motion will remain.
-
If complete cardiorespiratory gating is required, the ventilator can be briefly paused to remove the respiratory motion artifact.
! CAUTION Avoid long pauses in the ventilator cycle, which can compromise animal health during the procedure. Typical pauses of 5–15 s are well tolerated.
(C) PSSM
Repeat Step 46B(i–vi).
For PSSM, select ‘PSSM’ from the ‘Operating Mode’ drop-down menu. With PSSM, a small frequency shift is selected between the pacing frequency and the microscope acquisition frequency. The sequential phase shifting of the pacing spike relative to the cardiac cycle allows sampling of the entire cardiac cycle at all lines of the image. Reconstruction of motion artifact–free images at all points of the cardiac cycle can then be performed.
Select the number of images to be acquired in the PSSM sequence from the ‘PSSM Mode’ drop-down menu on the Labview program interface. Set this number as the number of images to be acquired in the FV1000 microscope software as well.
Start the Labview program on the secondary PC with both the ‘Enable Pacing’ and ‘Save File’ settings on. Pacing will start immediately.
Pause the ventilator by pressing the red ‘Run/Stop’ button on the front of the ventilator.
-
Start the FV1000 software to acquire a time series of images with the specified number of images corresponding to the number of images in the ‘PSSM Mode’ setting on the Labview software.
▲ CRITICAL STEP Start the microscope acquisition within seconds of pausing the ventilator to avoid prolonged cessation of ventilation. The Harvard Apparatus Inspira ASV ventilator also allows a start/stop electronic trigger signal to be provided for automatic starting and stopping of the ventilator. The software provided assumes a manual start/stop to allow for most general implementation and flexibility in the use of the protocol with other ventilator equipment.
When all images in the sequence have been acquired, restart the ventilator by again pressing the red ‘Run/Stop’ button on the ventilator.
Image reconstruction ● TIMING 30 min
-
47|
Process the gated images. Retrospective gating requires careful reconstruction of images using postprocessing software to select data at a specific time during the cardiac cycle. Prospective gating has relatively simpler data processing because of the fact that the gating regime has been carefully specified during acquisition using cardiac pacing protocols. This step can be performed using option A or option B, depending on whether retrospective or prospective acquisition has been conducted.
(A) Retrospective gating
Download the ‘RetrospectiveReconstruction.zip’ file (in Supplementary Data 1) on the data acquisition PC, and unzip it in a directory to create the folder ‘RetrospectiveReconstructionFolder’.
Transfer the *.tif files acquired with the Fluoview program from the system control PC into a folder of your choice (‘ImageFolder’) in the data acquisition PC.
Copy the binary file ‘BinaryFile.bin’ created by the Labview acquisition program on the PC-S and containing the ECG, the ‘Frame Active’ signal, and the ventilator signals into the folder called ‘ImageFolder’.
Open MATLAB, and add the RetrospectiveReconstructionFolder folder in the MATLAB path folder list (FileSet→PathAdd→Folder).
-
Run the following command to convert the binary file ‘BinaryFile.bin’ into a txt format file ‘TXTFile.txt’. This file can be useful for analyzing the ECG signal to find problems with synchronization or acquisition:
≫ bin2txt BinaryFile.bin
-
Reconstruct the images using the custom-built graphical user interface program by running the following command. This command launches the main program RetrospectiveReconstrunction (Supplementary Fig. 6):
≫ reconstruct <enter>
In the RetrospectiveReconstrunction window, click the browse button next to the label ‘1. Image file folder’ and navigate to select a directory in which the raw image files to be reconstructed are located (ImageFolder). Next, click the browse button next to the label ‘2. Signal file’ and navigate to the signal file containing the timing information of the ECG, ventilation and the microscope time-frame window (TXTFile.txt). A message box saying ‘Please wait. Signals are being loaded’ will be displayed, and it will automatically disappear when the loading is completed. Depending on the size of the signal file, the loading time may take more than a few seconds. Once the selections of the file folder with images and the signal file are complete, a raw image in the selected image file folder will be displayed in the ‘Raw image’ panel window. The image number can be changed in order to look at another raw image located within the same directory.
-
Choose the desired imaging channel to be reconstructed in the list box below the field ‘3. Channel of reconstruction’. Next, press the ‘reconstruct’ button located below the field ‘4. Reconstruct’. A reconstructed image will be displayed in the center of the program window.
? TROUBLESHOOTING
Set the values for the four parameters described in the panel ‘5. Gating parameters’ in order to optimize the final reconstructions. Press the ‘reconstruct’ button to display the result in the ‘Reconstructed image’ panel window. Adjust the parameters and repeat the procedure by pressing the ‘reconstruct’ button until an optimal reconstruction is obtained. See Supplementary Figure 6 for more details regarding the setting parameters.
Click the save button to save the reconstructed image. A filename and a desired image format can be chosen. Supplementary Video 4 illustrates a typical image acquisition and reconstruction when operating in retrospective gating modality.
(B) Prospective gating
Transfer the *.tif files recorded by the Fluoview software on the PC-P to the PC-S for data processing.
If needed or desired, images can be image processed for noise reduction.
Download the file ‘ProspectiveReconstruction.zip’ (Supplementary Data 1) on the data acquisition PC and unzip it in a directory to create the folder ‘ProspectiveReconstructionFolder’.
Open MATLAB and run the program’ ProspectiveReconstruction’. This will open a graphical user interface for processing prospective gated images (Supplementary Fig. 7). The viewer provided with this protocol takes the sequence of *.tif files acquired from the FV1000 and either displays the images directly as ‘Raw Data’ or processes them using the ‘PSSM’ algorithm to display the contractile cycle. The viewer stretches the image contrast to fit the range of the data for each processed image. The user must enter the file path of the *.tif files for processing, as well as the number of images in the sequence. The processed images are saved again as *.tif files in a subdirectory. The viewer also creates an .mp4 video from the processed images. Information about the heart rate or phase of the image relative to the cardiac cycle is not required. The user-selected pacing rate and the number of images acquired determine the temporal resolution. These parameters are specified at the time of acquisition of the data, as described above.
Enter the image numbers for the images to be processed.
Press the ‘New Path’ button to select the folder containing the FV1000 images for processing.
To process the raw data, press the ‘Raw Data’ button. This routine scales each of the images acquired, and it produces a time-series video of the gated images. This is useful for processing real-time gated data.
-
For PSSM sequences, process the reconstruction of the contractile cycle by pressing the ‘PSSM’ button. Supplementary Video 5 illustrates a typical image acquisition and reconstruction when operating in prospective gating modality.
▲ CRITICAL STEP Check that the ‘Start/End Images’ fields contain the correct image numbers spanning the entire PSSM sequence.
Termination of the experiment ● TIMING 5 min
-
48|
Euthanize the animal when the imaging experiment is complete. Euthanasia should be performed according to an institution-approved protocol. Survival imaging experiments can also be performed, but these are beyond the current scope of this protocol. For a typical experiment with 1 h of imaging and assuming a well-trained animal surgeon skilled in the procedures described here, the survival of the animals until the end of imaging is ~90%.
? TROUBLESHOOTING
Troubleshooting advice can be found in Table 2.
TABLE 2.
Troubleshooting table.
| Step | Problem | Possible reason(s) | Solution(s) |
|---|---|---|---|
| 11, 13, 19 | Difficulty anesthetizing the mouse before surgery | Interruption of flow of anesthesia to the animal | Tubing may be disconnected or occluded, preventing flow to the nose cone or the ventilator. Check existing tubing to ensure adequate gas flow. In addition, the anesthesia chamber may be empty. Ensure that sufficient isoflurane is present in the chamber to last through the entire procedure |
| 16, 45, 46B(iv) | Low-quality ECG trace measured through the differential amplifier | There is poor tissue contact with the ECG leads, or interfering noise is present | Minimize interfering electrical noise from other active devices such as the heat plate and the overhead lights. Consider wrapping the length of the ECG leads with insulating electrical tape. If noise affects the quality of the ECG, we recommend the use of a metal mesh Faraday cage placed around the mouse. In addition, a general signal-processing algorithm can be very effective in removing noise spikes and white noise, and in increasing QRS detection accuracy. A protocol describing ECG monitoring in mice can be found in ref. 25 |
| 19 | Animal is breathing spontaneously despite ventilation | Endotracheal tube may be in the esophagus rather than in the trachea | Check for the rise of the chest with ventilation. If it is not present, remove the endotracheal catheter and reintubate the mouse according to Step 18 |
| 37, 39 | Inadequate seal of the adhesive stabilizer to the heart surface | Excess liquid on the heart surface or poor-quality adhesive | Gently wick off the excess moisture from the heart surface using a Kimwipe. In addition, open a new bottle of adhesive and repeat the attempt at stabilization |
| 45 | Low or absent image signal level | Image is not in focus, or there is inadequate light exposure on the tissue | There are multiple possible causes; verify that the objective’s focal point is set near the surface of the tissue by manually scanning the z axis until the image is visible. Ensure that the laser shutter for the selected illumination wavelength is open. Increase the exposure power level if needed. In two-photon mode, verify that the femtosecond laser is mode-locked by checking the monitoring software for the laser |
| 46 | Difficulty pacing the heart | Native heart rate is too high, or there is inadequate contact of the pacing leads with the tissue | The pacing rate must be higher than the native heart rate in order to overdrive the pace of the heart. If necessary, consider using a pharmacologic agent such as a beta blocker to lower the mouse heart rate to allow pacing. Also check that the pacing lead is securely attached to the heart surface with the exposed wire in direct contact with the myocardium. Turn up the amplitude of the stimulus pulse if necessary to achieve capture |
| 47 | Retrospective gating software fails to read the ECG correctly | Poor ECG signal quality | Before initiating an imaging session, make sure that the ECG electrode needles are well placed and that the ECG signal is clean |
● TIMING
Timing to complete the protocol depends on the specific experiment and on the surgical and microscopy skill set of the user. Some steps for the microscope setup are necessary the first time that the protocol is performed but do not need to be repeated on subsequent experiments. With practice, the user will also improve in surgical skill and reduce the overall protocol time. The following guidelines provide rough estimates of the time required for various subsections of the protocol.
Steps 1–9, electronics setup for laser-scanning microscope and intravital imaging system initiation: 10–15 min
Steps 10–20, animal monitoring, anesthesia and intubation: 15–20 min
Steps 21–34, surgical preparation for imaging: 15–30 min
Steps 35–40, tissue stabilizer positioning and preparation for imaging: 10–15 min
Steps 41–45, setting imaging parameters: 15–30 min
Steps 46 and 47, imaging and image reconstruction: 30–60 min
ANTICIPATED RESULTS
When performed optimally, this protocol will yield high-quality microscopy images of the beating heart. Specific structures can be highlighted in the images through selection of the appropriate intravital fluorescent reporter and administration use (Table 1). Retrospective gating can provide highquality cellular images at an isolated phase of the cardiac cycle, typically at the end of diastole. This method offers relative simplicity in the hardware acquisition, but it suffers from low image temporal resolution, and therefore it is not optimal for visualizing dynamic events in the myocardium.
Figure 14a,b illustrates typical data achieved using retrospective gating. Note that a large field of view is possible using retrospective gating and sequential segmented microscopy because of the fact that the image is assembled slowly in sections over many heart beats. For optimum image quality and for visualizing dynamic events such as myocyte contraction with high temporal resolution, prospective gating is the preferred method. Prospective gating can provide true motion artifact–free images of the heart with subcellular resolution at any point in the cardiac cycle. Figure 14c–e demonstrates subcellular-resolution images of single cardiomyocytes in the heart at different phases (Fig. 14f) of the cardiac cycle.
Figure 14.
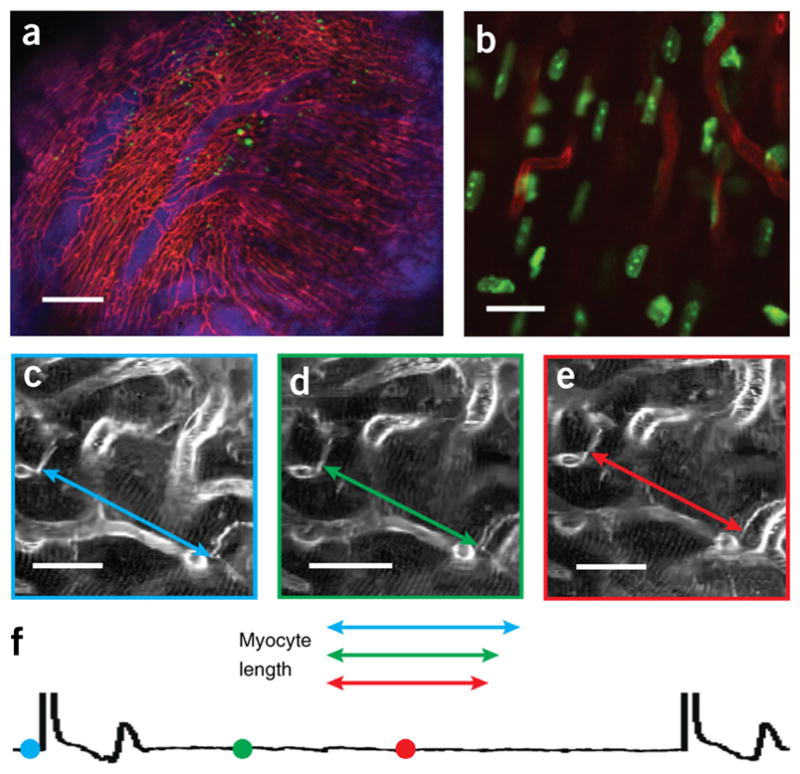
Intravital imaging of the structure and function in the beating heart at cellular resolution. (a,b) Sequential segmented microscopy with retrospective gating enables multichannel fluorescence confocal microscopy of the heart in diastole over a large field of view (a) and at single-cell resolution (b). Reproduced with permission from ref. 11, Nature Publishing Group. (c–f) Prospective gating allows motion artifact–free imaging of cardiomyocytes at all phases of the cardiac cycle. (c–e) Measurements of the contractile changes of a single cardiomyocyte are obtained at three distinct time points of the cardiac cycle (f). The colored symbols on the cardiac cycle (f) show the stage of the cardiac cycle at which the images shown in c–e were taken. From left to right, the symbols correspond to the images shown in c–e. Scale bars, (a) 200 μm; (b) 10 μm; (c–e) 20 μm. All animal procedures and protocols were approved by the Institutional Animal Care and Use Committee of the Massachusetts General Hospital, and they are in accordance with the NIH Guide for the Care and Use of Laboratory Animals.
Supplementary Material
Acknowledgments
The project was funded by US National Institutes of Health (NIH) Contracts HHSN268201000044C and R01EB006432. This work was also supported by the National Research Foundation of Korea funded by the Korean Government (MSIP) 2012M3A6A3055694. A.D.A. was funded by the American Heart Association 14FTF20380185.
Footnotes
Note: Any Supplementary Information and Source Data files are available in the online version of the paper.
AUTHOR CONTRIBUTIONS C.V., A.D.A., S.L. and R.W. designed the study, analyzed data and wrote the manuscript; C.V., A.D.A. and S.L. developed the system hardware and software and performed imaging experiments; A.D.A. performed surgical procedures.
COMPETING FINANCIAL INTERESTS The authors declare no competing financial interests.
References
- 1.Shih AY, et al. Two-photon microscopy as a tool to study blood flow and neurovascular coupling in the rodent brain. J Cereb Blood Flow Metab. 2012;32:1277–1309. doi: 10.1038/jcbfm.2011.196. [DOI] [PMC free article] [PubMed] [Google Scholar]
- 2.Devor A, et al. Frontiers in optical imaging of cerebral blood flow and metabolism. J Cereb Blood Flow Metab. 2012;32:1259–1276. doi: 10.1038/jcbfm.2011.195. [DOI] [PMC free article] [PubMed] [Google Scholar]
- 3.Murooka TT, et al. HIV-infected T cells are migratory vehicles for viral dissemination. Nature. 2012;490:283–287. doi: 10.1038/nature11398. [DOI] [PMC free article] [PubMed] [Google Scholar]
- 4.Sung JH, et al. Chemokine guidance of central memory T cells is critical for antiviral recall responses in lymph nodes. Cell. 2012;150:1249–1263. doi: 10.1016/j.cell.2012.08.015. [DOI] [PMC free article] [PubMed] [Google Scholar]
- 5.Pittet MJ, Weissleder R. Intravital imaging. Cell. 2011;147:983–991. doi: 10.1016/j.cell.2011.11.004. [DOI] [PMC free article] [PubMed] [Google Scholar]
- 6.Condeelis J, Weissleder R. In vivo imaging in cancer. Cold Spring Harb Perspect Biol. 2010;2:a003848. doi: 10.1101/cshperspect.a003848. [DOI] [PMC free article] [PubMed] [Google Scholar]
- 7.Fukumura D, Duda DG, Munn LL, Jain RK. Tumor microvasculature and microenvironment: novel insights through intravital imaging in pre-clinical models. Microcirculation. 2010;17:206–225. doi: 10.1111/j.1549-8719.2010.00029.x. [DOI] [PMC free article] [PubMed] [Google Scholar]
- 8.Rubart M, Wang E, Dunn KW, Field LJ. Two-photon molecular excitation imaging of Ca2+ transients in Langendorff-perfused mouse hearts. Am J Physiol Cell Physiol. 2003;284:C1654–C1668. doi: 10.1152/ajpcell.00469.2002. [DOI] [PubMed] [Google Scholar]
- 9.Matsumoto-Ida M, Akao M, Takeda T, Kato M, Kita T. Real-time 2-photon imaging of mitochondrial function in perfused rat hearts subjected to ischemia/reperfusion. Circulation. 2006;114:1497–1503. doi: 10.1161/CIRCULATIONAHA.106.628834. [DOI] [PubMed] [Google Scholar]
- 10.Bub G, et al. Measurement and analysis of sarcomere length in rat cardiomyocytes in situ and in vitro. Am J Physiol Heart Circ Physiol. 2010;298:H1616–H1625. doi: 10.1152/ajpheart.00481.2009. [DOI] [PMC free article] [PubMed] [Google Scholar]
- 11.Lee S, et al. Real-time in vivo imaging of the beating mouse heart at microscopic resolution. Nat Commun. 2012;3:1054. doi: 10.1038/ncomms2060. [DOI] [PMC free article] [PubMed] [Google Scholar]
- 12.Aguirre AD, Vinegoni C, Sebas M, Weissleder R. Intravital imaging of cardiac function at the single-cell level. Proc Natl Acad Sci USA. 2014;111:11257–11262. doi: 10.1073/pnas.1401316111. [DOI] [PMC free article] [PubMed] [Google Scholar]
- 13.Li W, et al. Intravital 2-photon imaging of leukocyte trafficking in beating heart. J Clin Invest. 2012;122:2499–2508. doi: 10.1172/JCI62970. [DOI] [PMC free article] [PubMed] [Google Scholar]
- 14.Jung K, et al. Endoscopic time-lapse imaging of immune cells in infarcted mouse hearts. Circ Res. 2013;112:891–899. doi: 10.1161/CIRCRESAHA.111.300484. [DOI] [PMC free article] [PubMed] [Google Scholar]
- 15.Vinegoni C, Lee S, Gorbatov R, Weissleder R. Motion compensation using a suctioning stabilizer for intravital microscopy. Intravital. 2012;1:115–121. doi: 10.4161/intv.23017. [DOI] [PMC free article] [PubMed] [Google Scholar]
- 16.Scott AD, Keegan J, Firmin DN. Motion in cardiovascular MR imaging. Radiology. 2009;250:331–351. doi: 10.1148/radiol.2502071998. [DOI] [PubMed] [Google Scholar]
- 17.Tsao J, Kozerke S. MRI temporal acceleration techniques. J Magn Reson Imaging. 2012;36:543–560. doi: 10.1002/jmri.23640. [DOI] [PubMed] [Google Scholar]
- 18.Atkinson DJ, Edelman RR. Cineangiography of the heart in a single breath hold with a segmented turboFLASH sequence. Radiology. 1991;178:357–360. doi: 10.1148/radiology.178.2.1987592. [DOI] [PubMed] [Google Scholar]
- 19.Lee S, Vinegoni C, Feruglio PF, Weissleder R. Improved intravital microscopy via synchronization of respiration and holder stabilization. J Biomed Opt. 2012;17:96018. doi: 10.1117/1.JBO.17.9.096018. [DOI] [PMC free article] [PubMed] [Google Scholar]
- 20.Vinegoni C, et al. Sequential average segmented microscopy for high signal-to-noise ratio motion-artifact-free in vivo heart imaging. Biomed Opt Express. 2013;4:2095–2106. doi: 10.1364/BOE.4.002095. [DOI] [PMC free article] [PubMed] [Google Scholar]
- 21.Constantinides C, Mean R, Janssen BJ. Effects of isoflurane anesthesia on the cardiovascular function of the C57BL/6 mouse. ILAR J. 2011;52:e21–e31. [PMC free article] [PubMed] [Google Scholar]
- 22.Pacher P, Nagayama T, Mukhopadhyay P, Batkai S, Kass DA. Measurement of cardiac function using pressure-volume conductance catheter technique in mice and rats. Nat Protoc. 2008;3:1422–1434. doi: 10.1038/nprot.2008.138. [DOI] [PMC free article] [PubMed] [Google Scholar]
- 23.Tarnavski O, et al. Mouse cardiac surgery: comprehensive techniques for the generation of mouse models of human diseases and their application for genomic studies. Physiol Genomics. 2004;16:349–360. doi: 10.1152/physiolgenomics.00041.2003. [DOI] [PubMed] [Google Scholar]
- 24.Redel A, et al. Impact of ischemia and reperfusion times on myocardial infarct size in mice in vivo. Exp Biol Med. 2008;233:84–93. doi: 10.3181/0612-RM-308. [DOI] [PubMed] [Google Scholar]
- 25.Ho D, et al. Heart rate and electrocardiography monitoring in mice. Curr Protoc Mouse Biol. 2011;1:123–139. doi: 10.1002/9780470942390.mo100159. [DOI] [PMC free article] [PubMed] [Google Scholar]
Associated Data
This section collects any data citations, data availability statements, or supplementary materials included in this article.