Significance
Molecular motors perform a variety of functions such as muscle movement and nuclear positioning during cell division. One such motor protein, cytoplasmic dynein, is responsible for oscillations of the nucleus during meiosis of the unicellular eukaryote, fission yeast. In this study, we used genetics, live-cell fluorescence microscopy, and image processing to identify the key players that keep dynein at the cortex while it performs the function of back-and-forth nuclear movement by producing force on the microtubule. We discovered that the membrane phospholipid PI(4,5)P2 and, surprisingly, the myosin I motor Myo1 are both indispensable for nuclear oscillations in fission yeast. This study thus demonstrates one of the few instances of interplay between different classes of motor proteins in the cell.
Keywords: Mcp5, PIP2, cytoplasmic dynein, myosin I, cortical anchoring
Abstract
Several key processes in the cell, such as vesicle transport and spindle positioning, are mediated by the motor protein cytoplasmic dynein, which produces force on the microtubule. For the functions that require movement of the centrosome and the associated nuclear material, dynein needs to have a stable attachment at the cell cortex. In fission yeast, Mcp5 is the anchor protein of dynein and is required for the oscillations of the horsetail nucleus during meiotic prophase. Although the role of Mcp5 in anchoring dynein to the cortex has been identified, it is unknown how Mcp5 associates with the membrane as well as the importance of the underlying attachment to the nuclear oscillations. Here, we set out to quantify Mcp5 organization and identify the binding partner of Mcp5 at the membrane. We used confocal and total internal reflection fluorescence microscopy to count the number of Mcp5 foci and the number of Mcp5 molecules in an individual focus. Further, we quantified the localization pattern of Mcp5 in fission yeast zygotes and show by perturbation of phosphatidylinositol 4-phosphate 5-kinase that Mcp5 binds to phosphatidylinositol 4,5-bisphosphate [PI(4,5)P2]. Remarkably, we discovered that the myosin I protein in fission yeast, Myo1, which is required for organization of sterol-rich domains in the cell membrane, facilitates the localization of Mcp5 and that of cytoplasmic dynein on the membrane. Finally, we demonstrate that Myo1-facilitated association of Mcp5 and dynein to the membrane determines the dynamics of nuclear oscillations and, in essence, dynein activity.
In fission yeast, during meiotic prophase, the fused nucleus of the zygote undergoes several hours of oscillatory movements from one cell pole to the other (1–4). Abrogation of these oscillations leads to improper chromosome pairing and recombination, leading to sporulation defects (2). The key players required for the movement of the nucleus are (i) the minus-end–directed motor protein cytoplasmic dynein, which is the force generator (2, 5); (ii) the anchor protein of dynein at the cortex, meiotic coiled-coil (CC) protein 5 (Mcp5), which acts as a link between dynein and the cell membrane (6, 7); and (iii) the microtubule cytoskeleton, which transduces the force produced by dynein to the spindle pole body (SPB, centrosome in yeast) and thereby to the nucleus underlying it (1). In fission yeast, cells lacking either dynein or Mcp5 are viable in interphase but do not exhibit oscillations during meiosis and thus show defects in sporulation (2, 6–8).
The minus-end–directed cytoplasmic dynein protein complex, a ∼1-MDa protein, is a homodimer of two heavy chains that performs the functions of transport of cargo and nuclear organization in several systems (9). In fission yeast, dynein expression is temporally restricted to prophase I of meiosis, when it is required for powering the oscillatory movement of the fused nucleus (2). The population of dynein that is responsible for producing force is that which is bound stably to the underlying cortex via the anchor protein Mcp5 (6, 7).
The anchor protein Mcp5 is the homolog of budding yeast Num1, with an N-terminal CC and a C-terminal pleckstrin homology (PH) domain (6, 7). As its name suggests, Mcp5 is also expressed only during meiotic prophase I (10). Both the CC and PH domains are essential for anchoring dynein at the cortex and hence for nuclear oscillations (6, 7). The CC domain is required for the attachment between Mcp5 and dynein, whereas the PH domain is required for Mcp5’s membrane localization (6, 7). Using single-molecule imaging of cytoplasmic dynein, it was discovered that the attachment of dynein to the cortical anchors occurs in a two-step process, with the first step being the attachment to the microtubule (11). In addition, although dynein diffuses in the cytoplasm and on the microtubule, directional movement of dynein is activated upon binding to cortical Mcp5 (11). Recently, similar activation was also observed in budding yeast, wherein binding to Num1 released the inhibition of the dynein motor (12). The PH domain of Num1 was concluded to bind to PI(4,5)P2 based on in vitro pull-down experiments as well as studies involving a temperature-sensitive mutant of the budding yeast phosphatidylinositol 4-phosphate 5-kinase [PI(4)P5K], Mss4 (13, 14). Functional homologs of Mcp5 in higher animals are ternary complexes that have divided the functions of dynein attachment and membrane localization among the three different proteins NuMA/LGN/Gαi (15).
In budding yeast, recent work has been instrumental in understanding Num1’s interaction with the membrane and the effect of this attachment with the associated cytoplasmic dynein motors in metaphase spindle movements (14, 16). In fission yeast during nuclear oscillations, the lipid molecule underlying Mcp5’s association with the membrane has been speculated to be PI(4,5)P2 (6), similar to that in budding yeast, but has not been tested. In addition, the precise localization of Mcp5 along the membrane and that of PI(4,5)P2 in relation to Mcp5 is unknown.
The only known myosin I protein in fission yeast, Myo1, is required for actin regulation and maintaining cell shape (17, 18). Additionally, Myo1 has been demonstrated to be required for the organization of membrane lipids, with cells devoid of the nonfilamentous, single-headed motor exhibiting aberrant sterol localization but normal actin cytoskeleton (19). Further, PI(4,5)P2 in mammalian cells has been seen to localize to cholesterol-dependent rafts (20–22). Hence, Myo1 could serve as a good starting point for testing the role of membrane organization in dynein localization and activity at the cortex.
Here, we use fluorescence microscopy to quantify the number of Mcp5 foci at the membrane and the number of proteins per focus. By using a temperature-sensitive mutation of PI(4)P5K, we show that Mcp5 binds to PI(4,5)P2 on the membrane. In addition, we demonstrate that perturbation of the membrane domains in a Myo1 deletion background affects Mcp5’s association to the membrane, thereby affecting dynein localization and activity, leading to aberrant nuclear oscillations. We have thus demonstrated a remarkable interplay between different motor groups, with the activity of a myosin motor being required for the activity of cytoplasmic dynein.
Results
Mcp5 Clusters into Spots of ∼10 Molecules at the Membrane.
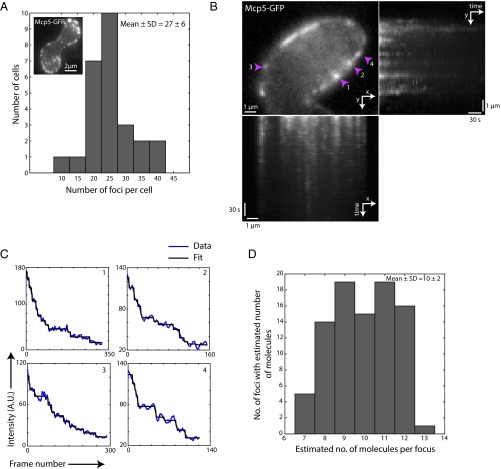
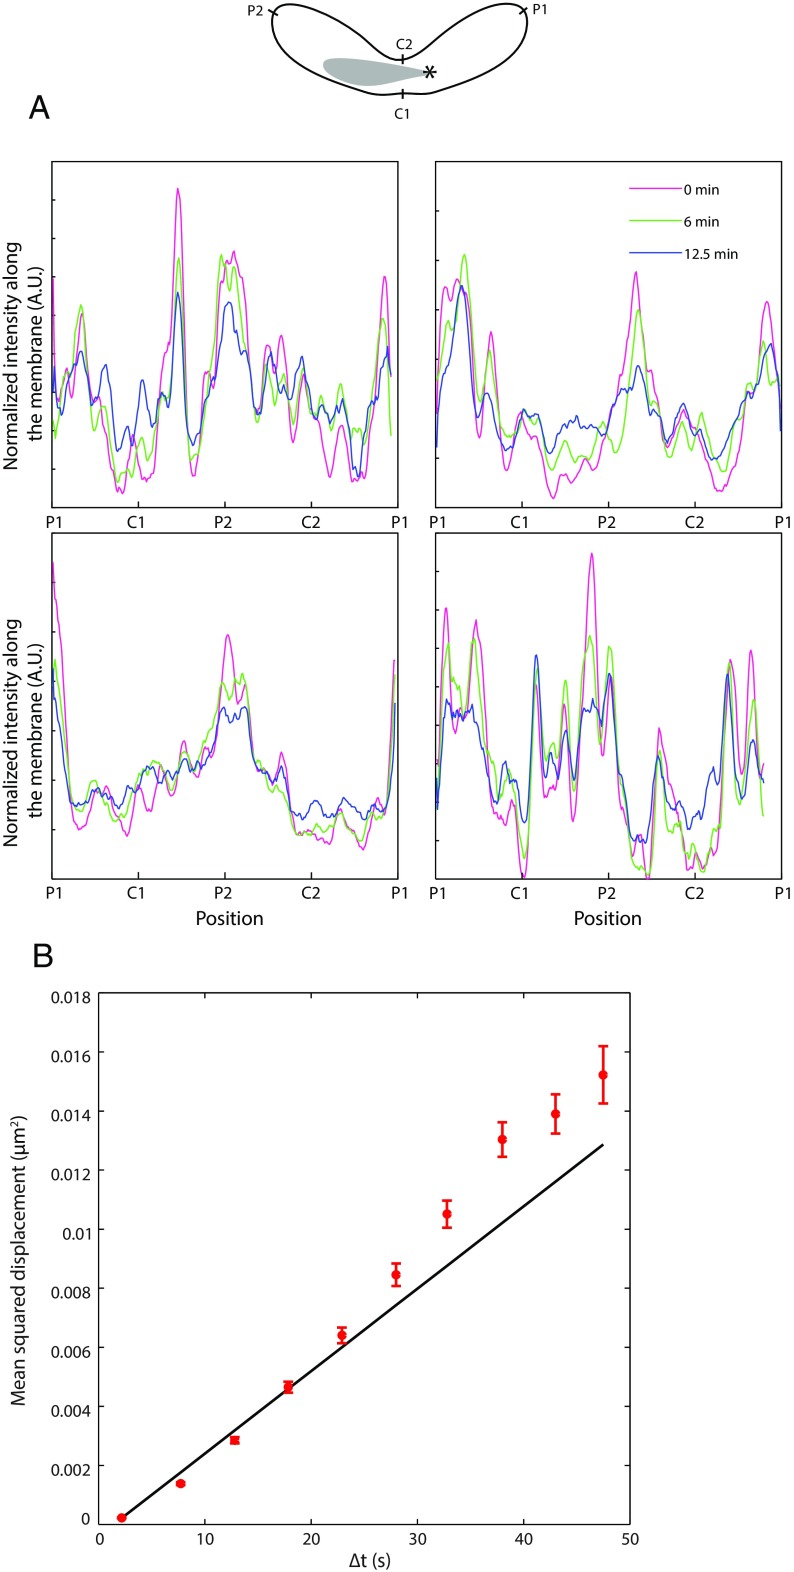
Mcp5 that is expressed during meiotic prophase clusters into distinct foci at the cell membrane (Fig. 1A, Inset and Movie S1). We first set out to count the number of such cortical Mcp5 foci per cell. We used a rolling ball average protocol with a diameter of 50 pixels to subtract background, and using intensity-based thresholding to include the top 2–4% of pixel intensities, we estimated 27 ± 6 (mean ± SD) Mcp5 foci per cell (n = 26 cells). The Mcp5 spots were fairly stable over a period of minutes, which was ascertained by examination of the intensity profile of Mcp5 at the membrane over the course of the time lapse (Fig. S1A).
Fig. 1.
Each cluster of Mcp5 contains ∼10 molecules. (A) Inset shows a representative maximum intensity projection of a fission yeast zygote (strain FY16854xFY16855; Table S1) expressing Mcp5-GFP imaged using a confocal microscope; plot is the histogram of number of foci counted per cell versus number of cells with given number of foci. The mean ± SD of the number of foci per cell was estimated to be 27 ± 6 (n = 26 cells). (B) Enlarged portion of a zygote expressing Mcp5-GFP (strain FY16854xFY16855; Table S1) imaged using a TIRF microscope. The maximum intensity projection onto y axis along time is shown on Right of the image and the maximum intensity projection onto the x axis along time is shown Below. (C) The points 1, 2, 3, and 4 marked with the magenta arrowheads in B are shown as representative data for bleaching step analysis. The raw five-frame sliding average data (blue) are plotted alongside the fits obtained from STEPFINDER software (black). (D) The histogram of the estimated number of molecules per Mcp5 focus is plotted to obtain a mean ± SD of 10 ± 2 molecules per focus (n = 89 foci).
Fig. S1.
Mcp5 foci do not exhibit dynamics at long and short time scales. (A) Schematic of a fission yeast zygote depicting the positions P1, C1, P2, and C2 on the membrane (Top) and the characteristic normalized intensity profiles of Mcp5 along the membrane at 0 min (magenta), 6 min (green), and 12.5 min (blue). The peaks of intensity of Mcp5 remain relatively unchanged with time, indicating little dynamics/turnover of Mcp5 foci. (B) MSD analysis of Mcp5 foci as a function of the time lag (red, error bars represent SEM, n = 77 foci tracked for at least 100 s from 12 cells, strain FY16854 × FY16855; see Table S1). A weighted fit to the equation MSD = 2DΔt + offset (black) yielded a diffusion coefficient D of 6.9 × 10⁻⁵ ± 4.3 × 10⁻⁶ µm2/s.
Because Mcp5 localizes to the membrane, we used Total Internal Reflection Fluorescence (TIRF) microscopy to count the number of Mcp5 molecules per focus (Fig. 1B). Time-lapse streams consisting of 5,000 frames with an exposure time of 20 ms were obtained of zygotes expressing fluorescent Mcp5. To reduce the background noise, a five-frame sliding average of the time lapse was taken. The intensity of the Mcp5 foci for each time point was then estimated using the Low Light tracking tool plugin for Fiji (23), which in addition also tracked the foci in x and y over time. The intensity of the foci was subjected to analysis using the STEPFINDER software (24) to count the number of bleaching steps of GFP (Fig. 1C and SI Materials and Methods). The number of steps obtained corresponded to the number of Mcp5 molecules, as each Mcp5 molecule contained a GFP tag (25). We thus estimated the number of Mcp5 molecules per cluster to be 10 ± 2 (mean ± SD, n = 89 foci; Fig. 1D). Mean squared displacement (MSD) analysis of the tracking data yielded extremely slow diffusion of the Mcp5 clusters, thereby ruling out dynamic Mcp5 clusters at shorter time scales (Fig. S1B).
PLC-PH and Mcp5 in a Zygote Show Preferential Localization to the Centers and the Poles of the Cell, Respectively.
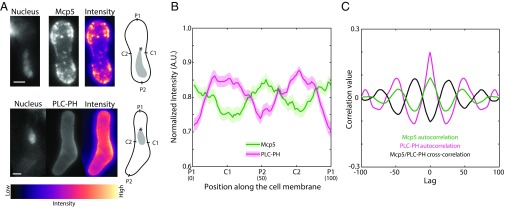
The localization of the anionic phospholipid PI(4,5)P2 is, to the best of our knowledge, unreported in fission yeast zygotes during nuclear oscillations. In addition, the location of Mcp5 foci with respect to PI(4,5)P2 is unknown. So we observed the localization of Mcp5 tagged with GFP and that of the PH domain of human phospholipase C (PLCδ1) tagged with GFP (henceforth called PLC-PH) using confocal microscopy (Fig. 2A). The latter binds specifically to PI(4,5)P2 (26) and thus acts as a proxy for PI(4,5)P2 localization. The nucleus of the cell was stained using Hoechst to assign the leading and the lagging sides at any given time point. We observed that both Mcp5 and PLC-PH signals were enriched at the cell membrane (Fig. 2A and Fig. S2A). We assigned the leading pole as P1 and the lagging pole as P2 (Fig. 2A, schematic). C1 and C2 were the centers of the cell going clockwise from P1 and P2, respectively. We plotted the intensity profiles of Mcp5 and PLC-PH along these membrane positions. Intriguingly, we observed that locations that exhibited higher intensity of Mcp5 were accompanied by low intensity of PLC-PH, and conversely, wherever the intensity of Mcp5 was low along the membrane, the intensity of PLC-PH was found to be high (Fig. 2B and Fig. S2 B and C). We define and henceforth refer to this recurrence of Mcp5 and PLC-PH intensities at poles and center of the cell, respectively, as “spatial periodicity.”
Fig. 2.
Localization patterns of PLC-PH and Mcp5 on the membrane are complementary. (A) Confocal microscope images showing the maximum intensity projection of the Hoechst-stained nucleus (Top and Bottom Left), the summed intensity projection (Top and Bottom Center), and the intensity map (Top and Bottom Right) of a cell expressing fluorescent Mcp5 (strain FY16854xFY16855; Table S1) and PLC-PH (strain AJC-D40xL972; Table S1), respectively, and the schematics depicting the locations P1, C1, P2, and C2 along the membrane of the cell. The intensity range is shown below the images. The asterisk marks the position of the SPB with respect to the nucleus (gray). (Scale bar, 2 µm.) (B) The mean normalized intensity profiles of Mcp5 (green, n = 41 cells) and PLC-PH (magenta, n = 51 cells) along the positions P1, C1, P2, and C2 are plotted. The lighter shaded regions depict the SEM of the normalized intensity profiles. The numbers in parentheses below the plot indicate the bin number (SI Materials and Methods for details). (C) Autocorrelation analyses of Mcp5 signals (green) and PLC-PH signals (magenta) exhibit spatial periodicity, with Mcp5 signal being repeated at the poles and the PLC-PH signal at the centers. The intensity signals of Mcp5 and PLC-PH are inversely correlated (black), as can be seen from the negative correlation at zero lag.
Fig. S2.
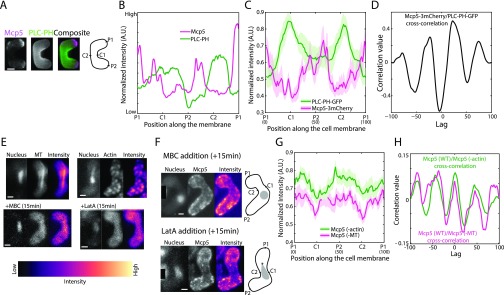
Mcp5 and PLC-PH signals exhibit complementarity and Mcp5 clustering is not affected by perturbation of the cytoskeleton. (A) Confocal microscope images showing the maximum intensity projection of Mcp5-3mCherry (Left, magenta), PLC-PH-GFP (Center, green), and the composite (Right) alongside the schematic depicting the locations P1, C1, P2, and C2 along the membrane of the cell (strain VA026; see Table S1). (B) The normalized intensity profiles of Mcp5 (magenta) and PLC-PH (green) of the cell in A along the positions P1, C1, P2, and C2 are plotted. Mcp5 and PLC-PH localizations appear complementary. (C) The mean normalized intensity profiles of Mcp5 (magenta) and PLC-PH (green) from the same cells along the positions P1, C1, P2, and C2 are plotted (n = 6 cells). The lighter shaded regions depict the SEM of the intensity profile. The numbers in parentheses below the plot indicate the bin number (see SI Materials and Methods for details). (D) The cross-correlation analysis of Mcp5 and PLC-PH in this background (black) shows an inverse correlation as in Fig. 2C. (E) Confocal microscope images showing the maximum intensity projection of the Hoechst-stained nucleus (left image), the maximum intensity projection (center image), and intensity map (right image) of fission yeast zygotes expressing tubulin-GFP (Left, strain KI001 × L972; see Table S1) and Lifeact-GFP (Right, strain MMY1824 × L972; see Table S1), before and after the treatment with MBC (Left) and LatA (Right), respectively. (F) Confocal microscope images showing the maximum intensity projection of the Hoechst-stained nucleus (Left), the summed intensity projection (Center), and intensity map (Right) of fission yeast zygotes expressing fluorescent Mcp5 (strain FY16854 × FY16855; see Table S1) treated with MBC (Top) and LatA (Bottom; see SI Materials and Methods) and the schematics depicting the locations P1, C1, P2, and C2 along the membrane of the cell. The asterisk marks the position of the SPB with respect to the nucleus (gray). The intensity range is shown to the left of the images. (G) The mean normalized intensity profiles of Mcp5 in cells treated with MBC (magenta) and LatA (green) along the positions P1, C1, P2, and C2 are plotted (n = 8 and 11 cells, respectively). The lighter shaded regions depict the SEM of the intensity profiles. The numbers in parentheses below the plot indicate the bin number (see SI Materials and Methods for details). (H) Cross-correlation analyses of wild-type Mcp5 signal with that of Mcp5 signals in cells treated with MBC (magenta), and LatA (green) exhibit periodicity similar to that seen in Fig. 2C. (Scale bar, 2 µm.)
Specifically, on an average, the localization of Mcp5 was quantified to be higher at the poles than at the center of the cell, which is consistent with previous observations by Saito et al. and Yamashita et al. (6, 7). Conversely, PLC-PH was enriched at the membrane toward the cell center rather than at the poles (Fig. 2B). The spatial periodicity of the Mcp5 and PLC-PH signals was apparent in an autocorrelation analysis (Fig. 2C; SI Materials and Methods for more details). The difference between Mcp5 and PLC-PH localization at the membrane was ascertained using cross-correlation analysis, with the two signals being inversely correlated (Fig. 2C and Fig. S2D). Additionally, the preferential localization of Mcp5 to the poles was found to be independent of the actin and microtubule cytoskeleton (Fig. S2 E–H).
Mcp5 and PLC-PH Compete for the Same Binding Spots on the Membrane.
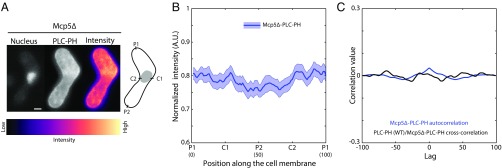
Although the inverse correlation of PLC-PH and Mcp5 localization at the membrane was surprising, it could have resulted from both molecules competing for PI(4,5)P2 on the membrane. To test this hypothesis, we constructed a strain that expressed PLC-PH in the background of Mcp5 deletion (Mcp5Δ-PLC-PH, strain VA024; see Table S1; Fig. 3A). We observed that the PLC-PH intensity along the membrane in this strain did not exhibit preferential localization at the center (Fig. 3B). The spatial periodicity that was exhibited at the centers by wild-type PLC-PH localization had also disappeared in the autocorrelation plot (Fig. 3C). Cross-correlation analysis between wild-type PLC-PH intensity profile and Mcp5Δ-PLC-PH intensity profile confirmed this finding, with the signals showing no correlation (Fig. 3C).
Table S1.
Strains and plasmids used in this study
| Name | Genotype | Source |
| AJC-D40 | h+ leu1-padh1-PHP-GFP-leu1-32 ura4-D18 | John Callegari |
| AY277 | h90 num1-3mCherry-hphR ade6-M216 leu1 ura4-D18 | Akira Yamashita |
| FC1261 | h– myo1(H/TH1)-kanMX leu1-32 ura4-D18 ade6 | Fred Chang |
| FY12794 | h90 leu1-32 ura4-D18 ade6-M210 cam2::ura4+ | NBRP |
| FY13570 | h− myo1::kanr ade6-M216 leu1 | NBRP |
| FY13572 | h90 myo1::kanr ade6-M216 leu1 | NBRP |
| FY13579 | h− myo1+-GFP<<kanr ade6-M210 leu1 | NBRP |
| FY15622 | h90 leu1 lys1 ura4-D18 | NBRP |
| FY16831 | h− ade6-M26 ura4- D18 mcp5::ura4+ | NBRP |
| FY16854 | h+ his2 leu1-32 ura4-D18 mcp5::[mcp5-GFP-3′UTR-Lys3+] | NBRP |
| FY16855 | h− ade6-M2106 mcp5::[mcp5-GFP-3′UTR-Lys3+] | NBRP |
| FY16951 | h90 myo1::GFP cam2::ura4 ura4-D18 | NBRP |
| IF960 | h90 num1-3mCherry-hphR ade6-M216 leu1 | Akira Yamashita |
| KI001 | h+ sid4-GFP::kan r kan r -nmtP3-GFP-atb2+ nmt1-pCOX4-RFP::leu1+ ura4-D18 ade6-M210 | Iva Tolić |
| KP167 | h− leu1 its3-1 | Kuno Takayoshi |
| L972 | h- WT | Iva Tolić |
| L975 | h+ WT | Iva Tolić |
| MMY1824 | h+ pAct1 Lifeact-GFP::leu1+ ade6-210 ura4-D18 leu1-32 | Mithilesh Mishra |
| SV91 | h90 mcp5-mCherry-kan r dhc1-GFP-Leu2 leu1-32 lys1 ura4-D18 | Iva Tolić |
| SV111 | h90 dhc1-mCherry-nat r leu1-32 lys1 ura4-D18 | Iva Tolić |
| VA024 | h90 leu1-padh1-PHP-GFP-leu1-32 ura4-D18 ade6-M26 mcp5::ura4+ | This study |
| VA026 | h90 leu1-padh1-PHP-GFP-leu1-32 ura4-D18 num1-3mCherry-hphR ade6-M216 | This study |
| VA044 | h- myo1::kanr leu1 num1-3mCherry-hphR ade6-M216 ura4-D18 | This study |
| VA045 | h+ myo1::kanr leu1 num1-3mCherry-hphR ade6-M216 ura4-D18 | This study |
| VA046 | h90 myo1+-GFP<<kanr ade6-M210 leu1 num1-3mCherry-hphR ade6-M216 ura4-D18 | This study |
| VA049 | h90 myo1::kanr ade6-M216 dhc1-mCherry-nat r leu1-32 lys1 ura4-D18 | This study |
| VA050 | h90 leu1-padh1-PHP-GFP-leu1-32 ura4-D18 myo1::kanr ade6-M216 leu1 | This study |
| VA051 | h90 mcp5-mCherry-kan r dhc1-GFP-Leu2 leu1-32 lys1 ura4-D18 ade6-M210 cam2::ura4+ | This study |
| VA053 | h90 num1-3mCherry-hphR ade6-M216 leu1 ura4-D18 myo1(H/TH1)kanMX | This study |
| FYP2932 (plasmid) | pRGT1 mcp5-GFP | NBRP |
| FYP2934 (plasmid) | pRGT1 mcp5 (C-CΔ)-GFP | NBRP |
Fig. 3.
Preferential localization of PLC-PH to the cell centers is abolished in a cell devoid of Mcp5. (A) Confocal microscope images showing the maximum intensity projection of the Hoechst-stained nucleus (Left), the summed intensity projection (Center), and the intensity map (Right) of a Mcp5Δ cell expressing fluorescent PLC-PH (strain VA024; Table S1) and the schematic depicting the nucleus (gray), and locations P1, C1, P2, and C2 along the membrane of the cell. (Scale bar, 2 µm.) (B) The mean normalized intensity profile of PLC-PH (“Mcp5Δ-PLC-PH,” blue, n = 27 cells) along the positions P1, C1, P2, and C2 is plotted. The lighter shaded region depicts the SEM of the normalized intensity profile. The numbers in parentheses below the plot indicate the bin number (SI Materials and Methods for details). Unlike in Fig. 2B, PLC-PH’s membrane localization does not show preference to the center. (C) Autocorrelation analysis of PLC-PH signals (blue) exhibits no spatial periodicity. The cross-correlation analysis of wild-type PLC-PH and PLC-PH in Mcp5Δ background (black) does not show any significant correlation.
its3-1 Zygotes Exhibit Perturbed Localization of PLC-PH and Mcp5 at the Membrane.
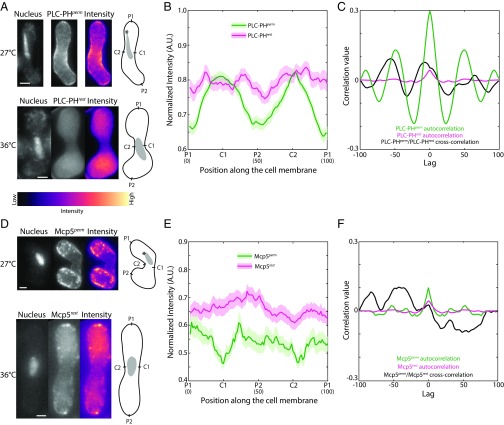
To confirm that Mcp5 indeed binds to PI(4,5)P2, we set out to deplete PI(4,5)P2 in fission yeast zygotes by using the temperature-sensitive mutant of PI(4)P5K, its3-1. Its3 in fission yeast was identified to be the sole kinase for the production of PI(4,5)P2 (27). its3-1 cells produce only 10% of PI(4,5)P2 compared with wild-type cells even at permissive temperatures of 25–27 °C and almost no detectable PI(4,5)P2 at a restrictive temperature of 33–36 °C (27). PI(4,5)P2 in fission yeast is required for actin organization (28), and during meiosis, F-actin is essential for the progression of cell fusion (29). As a result, we did not observe zygote formation in crosses made and maintained at restrictive temperatures. Therefore, to induce meiosis, its3-1 cells expressing PLC-PH were first crossed at 27 °C and then shifted to restrictive temperatures of 36 °C 3–4 h before imaging (Fig. 4A). In these cells, both the its3-1 mutation and the expression of PLC-PH, which binds to free PI(4,5)P2 and makes them unavailable for binding by other proteins, led to depletion of PI(4,5)P2.. In such a background, we observed perturbation of the cortical localization of PLC-PH (Fig. 4A), with no specific preference for the cell centers (Fig. 4 B and C), which is also apparent in the cross-correlation analysis between localization of PLC-PH at permissive temperature and PLC-PH of zygotes shifted to restrictive temperature (Fig. 4C). Additionally, the majority of PLC-PH signal was in the cytoplasm.
Fig. 4.
PLC-PH and Mcp5 localization patterns are perturbed in its3-1 zygotes. (A) Confocal microscope images showing the maximum intensity projection of the Hoechst-stained nucleus (Top and Bottom Left), the summed intensity projection (Top and Bottom Center), and the intensity map (Top and Bottom Right) of an its3-1 zygote expressing fluorescent PLC-PH at permissive temperature of 27 °C (“PLC-PHperm,” strain KP167xAJC-D40; Table S1) and after shift to restrictive temperature of 36 °C (“PLC-PHrest,” strain KP167xAJC-D40; Table S1), respectively, and the schematics depicting the locations P1, C1, P2, and C2 along the membrane of the cell. The intensity range is shown below the images. (B) The mean normalized intensity profiles of PLC-PHperm (green, n = 76 cells) and PLC-PHrest in experimental cells shifted to restrictive temperature 3–4 h before nuclear oscillations phase (magenta, n = 19 cells) along the positions P1, C1, P2, and C2 are plotted. The lighter shaded regions depict the SEM of the intensity profiles. The numbers in parentheses below the plot indicate the bin number (SI Materials and Methods for details). (C) Autocorrelation analysis of control PLC-PHperm signal (green) exhibits spatial periodicity at the cell centers, whereas PLC-PHrest signal (magenta) exhibits no such spatial periodicity. Cross-correlation analysis (black) reveals an aberrant correlation between the two signals, indicating a perturbation in PLC-PHrest localization upon shift to restrictive temperature. (D) Fluorescence microscope images showing the maximum intensity projection of the Hoechst-stained nucleus (Top and Bottom Left), the summed intensity projection (Top and Bottom Center), and the intensity map (Top and Bottom Right) of an its3-1 zygote expressing fluorescent Mcp5 at permissive temperature of 27 °C (“Mcp5perm,” strain KP167xVA026; Table S1) and after shift to restrictive temperature of 36 °C (“Mcp5rest,” strain KP167xVA026; Table S1), respectively, and the schematics depicting the locations P1, C1, P2, and C2 along the membrane of the cell. (E) The mean normalized intensity profiles of Mcp5perm (green, n = 25 cells) and Mcp5rest in experimental cells shifted to restrictive temperature 3–4 h before nuclear oscillations phase (magenta, n = 37 cells) along the positions P1, C1, P2, and C2 are plotted. The lighter shaded regions depict the SEM of the intensity profiles. The numbers in parentheses below the plot indicate the bin number (SI Materials and Methods for details). (F) Autocorrelation analysis of control Mcp5perm signal (green) shows a spatial periodicity that is absent in the Mcp5rest signal (magenta). Cross-correlation analysis (black) reveals improper correlation between the two signals upon shift to restrictive temperature. The asterisk marks the position of the SPB with respect to the nucleus (gray). Note that the SPB position is unknown in the PLC-PHrest and Mcp5rest cell, as nuclear oscillations were not apparent. (Scale bar, 2 µm.)
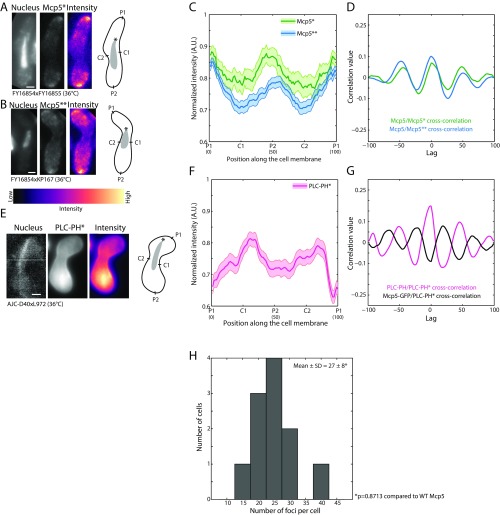
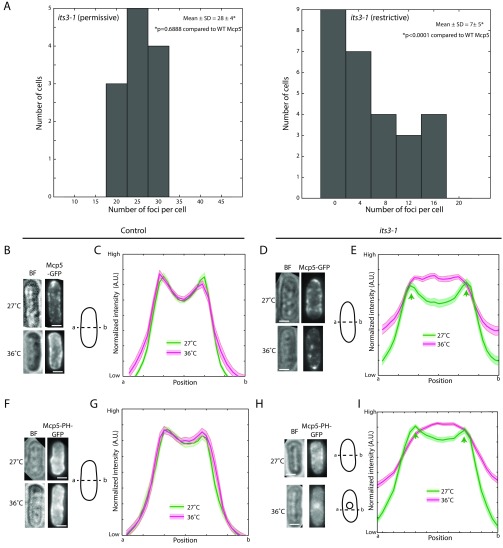
Similarly, the association of Mcp5 with the membrane was perturbed in zygotes with its3-1 mutation at restrictive temperature, with preferential attachment to the poles being abrogated in these cells (Fig. 4 D–F). At restrictive temperature, we observed no significant differences from wild type in Mcp5/PLC-PH distribution or Mcp5 foci number in other strains without the temperature-sensitive its3-1 mutation (Fig. S3). In contrast, the number of Mcp5 clusters in PI(4,5)P2-depleted cells was significantly reduced from the wild-type estimate and that of its3-1 cells grown at permissive temperature—that is, ∼30 per cell, to 7 ± 5 per cell (mean ± SD, n = 27 cells; Fig. S4A).
Fig. S3.
Mcp5 localization and clustering are unaffected in cells lacking its3-1 mutation grown at 36 °C. (A) Confocal microscope images showing the maximum intensity projection of the Hoechst-stained nucleus (Left), the summed intensity projection (Center), and intensity map (Right) of a cell expressing fluorescent Mcp5 at 36 °C (“Mcp5*,” strain FY16854 × FY16855; see Table S1) and the schematics depicting the locations P1, C1, P2, and C2 along the membrane of the cell. (B) Confocal microscope images showing the maximum intensity projection of the Hoechst-stained nucleus (Left), the summed intensity projection (Center), and intensity map (Right) of a cell expressing fluorescent Mcp5 at 36 °C (“Mcp5**,” strain FY16854 × KP167; see Table S1) and the schematics depicting the locations P1, C1, P2, and C2 along the membrane of the cell. The intensity range is shown below the images. (C) The mean normalized intensity profiles of Mcp5* (green, n = 13 cells) and Mcp5** (blue, n = 53 cells) along the positions P1, C1, P2, and C2 are plotted. The lighter shaded regions depict the SEM of the intensity profiles. The numbers in parentheses below the plot indicate the bin number (see SI Materials and Methods for details). Note that even though the Mcp5** signal is from a cross with the its3-1 strain at restrictive temperature, the FY16854 cell in the cross contains wild-type levels of PI(4, 5)P2 and hence displays Mcp5 profile similar to that of wild-type cells. (D) Cross-correlation analyses of Mcp5* signal (green) and Mcp5** signal (blue) with wild-type Mcp5 (see Fig. 2B) show high correlation at zero lag. (E) Confocal microscope images showing the maximum intensity projection of the Hoechst-stained nucleus (Left), the summed intensity projection (Center), and intensity map (Right) of a cell expressing fluorescent PLC-PH at 36 °C (“PLC-PH*,” strain AJC-D40 × L972; see Table S1) alongside the schematics depicting the locations P1, C1, P2, and C2 on the membrane of the cell. (F) The mean normalized intensity profile of PLC-PH* (magenta, n = 37 cells) along the positions P1, C1, P2, and C2 is plotted. The lighter shaded region depicts the SEM of the intensity profile. The numbers in parentheses below the plot indicate the bin number (see SI Materials and Methods for details). (G) Cross-correlation analysis of PLC-PH* with wild-type PLC-PH (magenta, see Fig. 2B) shows highest correlation at zero lag, and that with wild-type Mcp5 (black, see Fig. 2B) shows inverse correlation at zero lag similar to that seen in Fig. 2C. The asterisk marks the position of the SPB with respect to the nucleus (gray). (Scale bar, 2 µm.) (H) Histogram of number of Mcp5 foci counted per cell versus number of cells with given number of foci in cells expressing fluorescent Mcp5 grown at 36 °C (strain FY16854 × FY16855; see Table S1). The mean ± SD of the number of foci per cell was estimated to be 27 ± 8 (n = 11 cells).
Fig. S4.
Mcp5 clustering is perturbed in PI(4,5)P2-depleted cells. (A) Histograms of number of Mcp5 foci counted per cell versus number of cells with given number of foci in its3-1 cells grown at 27 °C (Left) and at 36 °C (Right) (strain KP167 × VA026; see Table S1). The mean ± SD of the number of foci per cell in control cells (Left) was estimated to be 28 ± 4 (n = 12 cells), and that in cells where PI(4,5)P2 was depleted (Right) was estimated to be 7 ± 5 (n = 27 cells). (B) Bright-field image (“BF”; Top and Bottom Left) and the maximum intensity projections of Mcp5-GFP (Top and Bottom Right) of a control cell (strain FY15622 transformed with plasmid FYP2932; see Table S1) imaged using confocal microscopy at permissive temperature of 27 °C (Top) and restrictive temperature of 36 °C (Bottom), alongside the schematic of a cell with line ab, along which the intensity profile of the interphase cell is plotted. (C) The mean normalized intensity profile of Mcp5-GFP along the positions a–b is plotted at permissive (green, n = 31 cells) and restrictive (magenta, n = 32 cells) temperatures. The lighter shaded regions depict the SEM of the intensity profiles. (D) Bright-field image (BF; Top and Bottom Left) and the maximum intensity projections of Mcp5-GFP (Top and Bottom Right) of an its3-1 cell (strain KP167 transformed with plasmid FYP2932; see Table S1) imaged using confocal microscopy at permissive temperature of 27 °C (Top) and restrictive temperature of 36 °C (Bottom), alongside the schematic of a cell with line ab along which the intensity profile of the interphase cell is plotted. (E) The mean normalized intensity profile of Mcp5-GFP expressed in its3-1 zygotes along the positions a–b is plotted at permissive (green) and restrictive (magenta) temperatures (n = 37 and 36 cells, respectively). The lighter shaded regions depict the SEM of the intensity profiles. Although Mcp5 showed robust localization to the membrane at permissive temperatures (green arrows), perturbation of PI(4,5)P2 displaced Mcp5 from the cortex at restrictive temperature. (F) Bright-field image (BF; Top and Bottom Left) and the maximum intensity projections of Mcp5-PH-GFP (Top and Bottom Right) of a control cell (strain FY15622 transformed with plasmid FYP2934; see Table S1) imaged using confocal microscopy at permissive temperature of 27 °C (Top) and restrictive temperature of 36 °C (Bottom), alongside the schematic of a cell with the line ab, along which the intensity profile of the interphase cell is plotted. (G) The mean normalized intensity profile of Mcp5-PH-GFP along the positions a–b at permissive (green, n = 29 cells) and restrictive temperatures (magenta, n = 22 cells) is plotted. The lighter shaded regions depict the SEM of the intensity profiles. Note that there is no significant change in the localization of either Mcp5 or Mcp5-PH-GFP at restrictive temperatures in this control background. (H) Bright-field image (BF; Top and Bottom Left) and the maximum intensity projections of Mcp5-PH-GFP (Top and Bottom Right) of an its3-1 cell (strain KP167 transformed with plasmid FYP2934; see Table S1) imaged using confocal microscopy at permissive temperature of 27 °C (Top) and restrictive temperature of 36 °C (Bottom), alongside the schematic of the cell with line ab along which the intensity profile of the interphase cell is plotted. At restrictive temperature, Mcp5-PH-GFP showed increased localization at the nucleus; therefore, a line running just below the nucleus was chosen so as to avoid interference. (I) The mean normalized intensity profile of Mcp5-PH-GFP along the positions a–b at permissive (green) and restrictive temperatures (magenta) is plotted (n = 27 and 34 cells, respectively). The lighter shaded regions depict the SEM of the intensity profiles. Two distinct peaks (green arrows) can be seen at the its3-1 cell boundaries where PH-GFP accumulates at permissive temperatures, whereas these peaks disappear at restrictive temperature due to relocalization of Mcp5-PH-GFP to the cell interior. (Scale bar, 2 µm.)
Then, to directly test whether Mcp5 localization was affected by PI(4,5)P2 depletion, we transformed the its3-1 strain with Mcp5-GFP and Mcp5-PH-GFP expression vectors (Fig. S4; Table S1). Interphase cells in fission yeast do not normally express Mcp5 (6, 7), but cells transformed with the vectors showed clusters of Mcp5 and Mcp5-PH at the cortex, similar to those found in meiotic zygotes (Fig. S4 B, D, F, and H). Cells were first grown at permissive temperature of 27 °C, fixed, and imaged using confocal microscopy (Fig. S4 B, D, F, and H, Top). The cells were then shifted to restrictive temperature of 36 °C for 5.5 h, fixed, and then imaged in the same fashion (Fig. S4 B, D, F, and H, Bottom). In its3-1 strain expressing Mcp5, membrane localization of Mcp5 was observed after being grown in permissive temperature (Fig. S4E, green), whereas after 5.5 h in restrictive temperature, the cells did not exhibit Mcp5 along the membrane (Fig. S4E, magenta). The clustering of Mcp5 at the membrane was perturbed, with a reduction in total number of clusters as well as higher diffuse signal in the cytoplasm. This switch in localization pattern did not occur in wild-type cells at elevated temperatures (Fig. S4 B and C). Additionally, the signal of Mcp5-PH in its3-1 cells was apparent at the membrane at permissive temperature (Fig. S4I, green) and underwent a dramatic redistribution from the membrane into the cytoplasm after growth at restrictive temperatures (Fig. S4I, magenta), with a significant localization at the nucleus as well. The wild-type control did not exhibit this switch in distribution of Mcp5-PH at restrictive temperatures (Fig. S4 F and G). This suggests that PH domain of Mcp5 depends on PI(4,5)P2 for membrane localization.
Myo1 Is Essential for Localization of PLC-PH and Mcp5 at the Cortex.
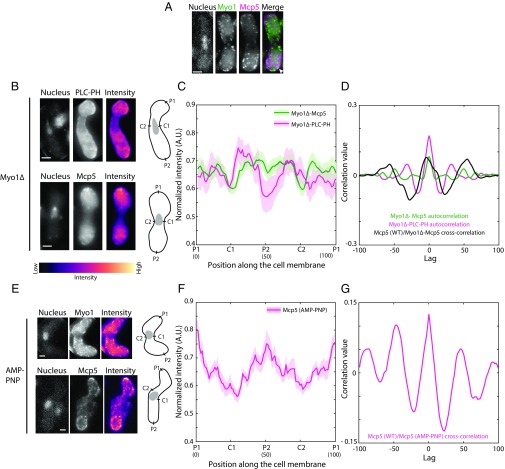
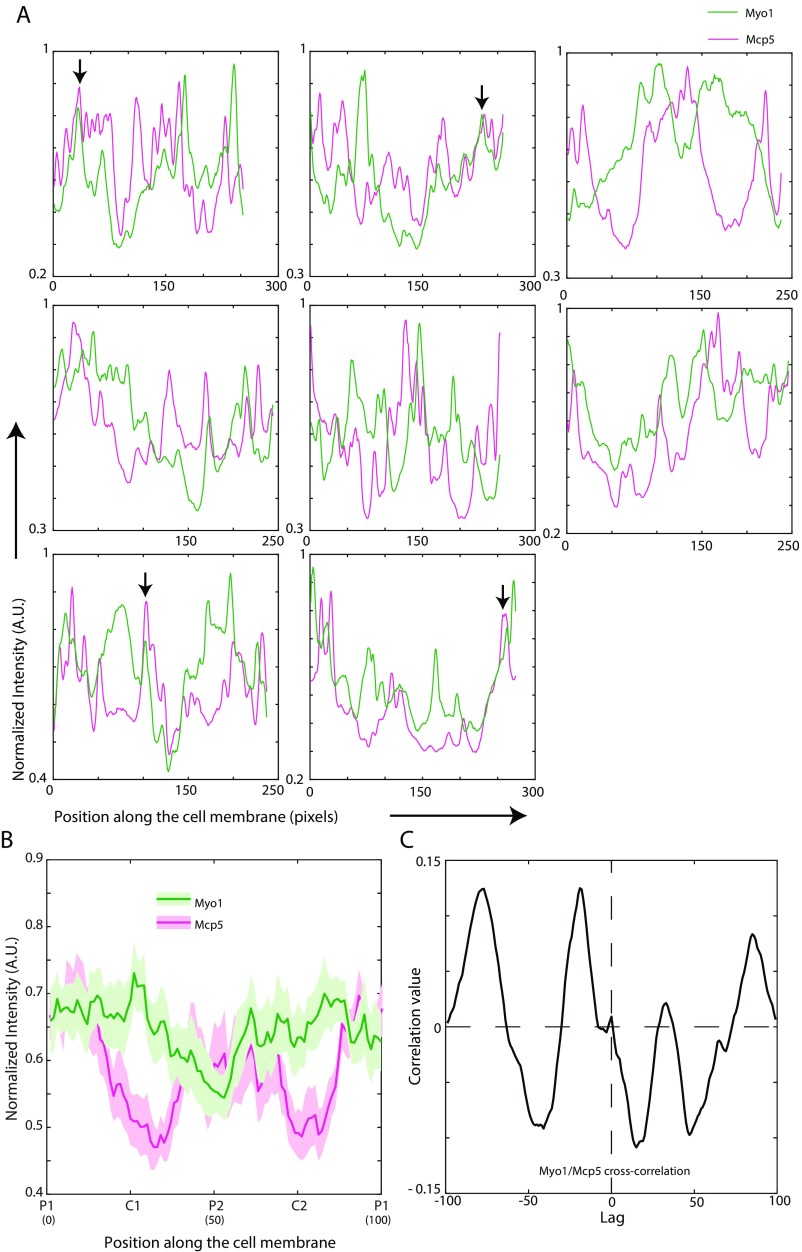
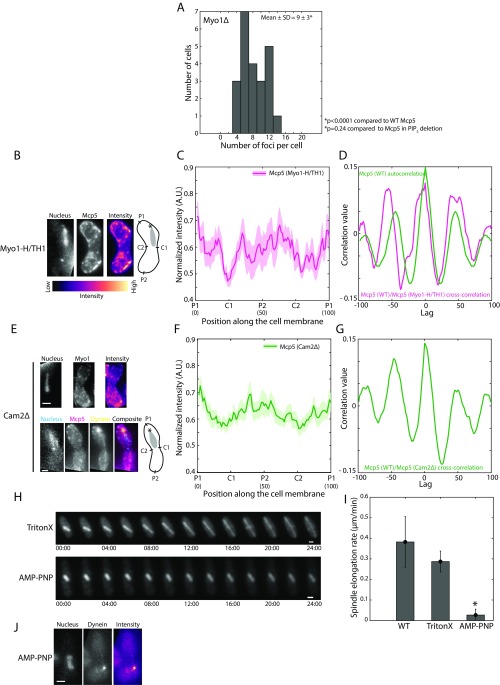
Although we observed that Mcp5 occupies the poles more so than the centers of the zygotic membrane, it is not clear why this is the case. Myo1, which participates in the organization of sterol-rich domains in the fission yeast membrane (30), was then tested for its role in ensuring restriction of Mcp5 localization primarily to the poles. Hence, we constructed a strain that expresses Myo1 tagged with GFP and Mcp5 tagged with 3mCherry to check for localization of Mcp5 with respect to Myo1 (strain VA046; Table S1). We counted 23 ± 5 Myo1 foci (mean ± SD, n = 9 cells) per cell, which is similar to the number of Mcp5 foci in a wild-type cell. However, we only observed weak colocalization of the two proteins (Fig. 5A and Fig. S5), likely because of the dynamic attachment of Myo1 to the membrane (19). We then constructed strains that expressed fluorescently tagged PLC-PH and Mcp5 in the background of Myo1 deletion (strain VA050 and strain VA044xVA045; Table S1). Similar to the case where PI(4,5)P2 was depleted, both these constructs exhibited perturbed localization of PLC-PH and Mcp5 compared with wild-type cells (Fig. 5B). The preferential associations of PLC-PH and Mcp5 to the centers and to the poles, respectively, were affected (Fig. 5 C and D). Additionally, the number of Mcp5 clusters in the Myo1∆ zygotes was also significantly different from wild type with 9 ± 3 (mean ± SD, n = 23 cells) clusters per cell (Fig. S6A), which is similar to the number of clusters in zygotes where PI(4,5)P2 was depleted (Fig. S4A).
Fig. 5.
Myo1 is required for proper localization of PLC-PH and Mcp5 to the membrane. (A) Fluorescence microscope images of the Hoechst-stained nucleus (Left), fluorescent Myo1 (green, Second From Left), fluorescent Mcp5 (magenta, Third From Left), and the merge of the three signals (Right) (strain VA046; Table S1). A representative region of colocalization of Myo1 and Mcp5 signal is marked with the white arrowhead. (B) Fluorescence microscope images showing the maximum intensity projection of the Hoechst-stained nucleus (Top and Bottom Left), the summed intensity projection (Top and Bottom Center), and the intensity map (Top and Bottom Right) of Myo1Δ zygotes expressing fluorescent PLC-PH and Mcp5 (Top and Bottom, respectively, strain VA050 and strain VA044xVA045; Table S1), and the schematics depicting the locations P1, C1, P2, and C2 along the membrane of the cell. The intensity range is shown below the images. (C) The mean normalized intensity profiles of Myo1Δ-Mcp5 (green, n = 27 cells) and Myo1Δ-PLC-PH (magenta, n = 11 cells) along the positions P1, C1, P2, and C2 are plotted. The lighter shaded regions depict the SEM of the intensity profiles. The numbers in parentheses below the plot indicate the bin number (SI Materials and Methods for details). (D) Autocorrelation analyses of Myo1Δ-Mcp5 (green) and Myo1Δ-PLC-PH signal (magenta) show spatial periodicity that is different from wild-type Mcp5 and PLC-PH signals (Fig. 2C). Cross-correlation analysis (black) between wild-type Mcp5 and Myo1Δ-Mcp5 intensities yields an aberrant correlation. (E) Fluorescence microscope images showing the maximum intensity projection of the Hoechst-stained nucleus (Top and Bottom Left), the summed intensity projection (Top and Bottom Center), and the intensity map (Top and Bottom Right) of AMP–PNP-treated zygotes (SI Materials and Methods for details) expressing fluorescent Myo1 and Mcp5 (Top and Bottom, respectively, strain FY13579xL975 and strain FY16854xFY16855; Table S1) and the schematics depicting the locations P1, C1, P2, and C2 along the membrane of the cell. (F) The mean normalized intensity profiles of AMP–PNP-treated Mcp5 (SV91, magenta, n = 13 cells) along the positions P1, C1, P2, and C2 are plotted. The lighter shaded regions depict the SEM of the intensity profiles. The numbers in parentheses below the plot indicate the bin number (SI Materials and Methods for details). (G) Cross-correlation analysis (magenta) between wild-type Mcp5 and Mcp5 in AMP–PNP-treated cells. (Scale bar, 2 µm.)
Fig. S5.
Myo1 and Mcp5 do not exhibit significant colocalization. (A) Plots of normalized Myo1 (green) and Mcp5 (magenta) signal along the membrane of eight different cells (strain VA046; see Table S1). Colocalization of the signals was seen in some instances, and representative examples are marked with black arrows. (B) The mean normalized intensity profiles of Mcp5 (magenta) and Myo1 (green) along the membrane, expressed in the same cell, are plotted (n = 10 cells, strain VA046; see Table S1). The lighter shaded regions depict the SEM of the intensity profiles. The numbers in parentheses below the plot indicate the bin number (see SI Materials and Methods for details). (C) Cross-correlation of Mcp5 and Myo1 intensities (black) indicated low correlation value at zero lag—that is, low colocalization.
Fig. S6.
Mcp5’s preferential localization at the poles does not require Myo1’s motor activity. (A) Histogram of number of Mcp5 foci counted per cell versus number of cells with given number of foci in Myo1Δ zygotes (strain VA044xVA045; see Table S1). The mean ± SD of the number of foci per cell was estimated to be 9 ± 3 (n = 23 cells). (B) Fluorescence microscope images showing the maximum intensity projection of the Hoechst-stained nucleus (Left), the summed intensity projection (Center), and intensity map (Right) of a Myo1-H/TH1 cell expressing fluorescent Mcp5 (strain VA053; see Table S1) and the schematics depicting the locations P1, C1, P2, and C2 along the membrane of the cell. The intensity range is shown below the images. (C) The mean normalized intensity profile of Mcp5 in Myo1-H/TH1 background (magenta, n = 9 cells) along the positions P1, C1, P2, and C2 is plotted. The lighter shaded regions depict the SEM of the intensity profiles. The numbers in parentheses below the plot indicate the bin number (see SI Materials and Methods for details). (D) Autocorrelation of wild-type Mcp5 signal [strain AY277; see Table S1, “Mcp5 (WT),” green] shows spatial periodicity as observed before. Cross-correlation analysis of wild-type Mcp5 signal and that of Mcp5 signal in Myo1-H/TH1 strain (magenta) shows a similar trend as that seen in the wild-type Mcp5 autocorrelation. (E) Fluorescence microscope images showing the maximum intensity projection of the Hoechst-stained nucleus (Left), the summed intensity projection (Second From Left), and intensity map (Third From Left) of Cam2Δ cells expressing fluorescent Myo1 (Top, strain FY16951; see Table S1) and Mcp5 (Bottom, magenta) and dynein (Bottom, yellow, strain VA051; see Table S1) and the schematics depicting the locations P1, C1, P2, and C2 along the membrane of the cell. (F) The mean normalized intensity profile of Mcp5 in Cam2Δ cells (green, n = 13 cells) along the positions P1, C1, P2, and C2 is plotted. The lighter shaded regions depict the SEM of the intensity profile. The numbers in parentheses below the plot indicate the bin number (see SI Materials and Methods for details). (G) Cross-correlation analysis of wild-type Mcp5 signal and that of Mcp5 signal in Cam2Δ background (green) shows a similar trend as that seen in the wild-type Mcp5 autocorrelation in D. (H) Montage of spindle elongation in cells with fluorescent tubulin (strain KI001; see Table S1) treated with TritonX-100 (Top) and AMP–PNP (Bottom) and imaged for 24 min. The numbers below the montages depict time (mm:ss). (I) Plot of spindle elongation rate in control (WT, n = 8 cells), TritonX-100–treated (TritonX, n = 4 cells), and AMP–PNP-treated (AMP–PNP, n = 7 cells) cells. The TritonX-100–treated cells elongate at a rate that is not significantly different from that of control cells, whereas the elongation of the spindle in AMP–PNP-treated cells is severely reduced. (J) Fluorescence image of the Hoechst-stained nucleus (Left), maximum intensity projection of the fluorescently labeled dynein (Center, strain SV91; see Table S1), and intensity map of the dynein fluorescence (Right) depicting the complete loss of cortical dynein foci in AMP–PNP-treated cells (n= 13 cells). In the schematics, the asterisk marks the position of the SPB with respect to the nucleus (gray). (Scale bar, 2 µm.)
Myo1’s Motor Activity Is Not Essential for Myo1 and Mcp5’s Membrane Localization.
Takeda et al. (19) have previously demonstrated that a Myo1 construct containing the motor domain and the tail homology 1 (TH1) domain of Myo1, without domains TH2 and TH3, is capable of organizing sterol-rich regions in the membrane of fission yeast, similar to that seen in cells expressing full-length Myo1. We visualized the localization of Mcp5 in this background where TH2 and TH3 domains of Myo1 were deleted (strain VA053; Table S1). As expected, we observed localization of Mcp5 similar to that seen in wild type in these zygotes, with enrichment specifically at the poles (25 ± 4 clusters per cell, n = 10 cells; Fig. S6 B–D). However, it is not known whether Myo1’s motor activity is required for its association to the membrane and consequently that of Mcp5. To test this, we first used a deletion strain of the calmodulin light chain 2 (Cam2), which is required for enhancing Myo1’s motor motility in fission yeast (31). We did not observe a difference from wild type in Myo1 or Mcp5 localization in the Cam2∆ background (23 ± 3 clusters per cell, n = 5 cells, and 22 ± 2 clusters per cell, n = 9 cells, respectively) and observed the characteristic cortical foci of dynein during the oscillations of the nucleus (Fig. S6 E–G). To specifically block ATP-driven motor activity, we used AMP-PNP, a nonhydrolyzable analog of ATP. As seen previously (32), a concentration of 2 mM AMP-PNP was sufficient to prevent elongation of fission yeast mitotic spindle (Fig. S6 H and I), indicating that AMP-PNP was successful in abrogating all motor activity. So too, when we treated fission yeast zygotes undergoing nuclear oscillations with AMP-PNP for 30 min, we first observed cessation of nuclear oscillations concomitant with a complete loss of dynein foci from the membrane (n = 13 cells; Fig. S6J). However, treatment with AMP-PNP did not prevent wild type-like localization of Myo1 or Mcp5 (Fig. 5 E–G) to the membrane, with 20 ± 5 clusters (n = 7 cells) and 24 ± 2 clusters (n = 6 cells), respectively, indicating that Myo1’s motor activity was not essential for its association with the membrane or for Mcp5’s Myo1-facilitated pole-specific localization at the cortex.
Myo1 Deletion Affects Association of Dynein with the Cortex.
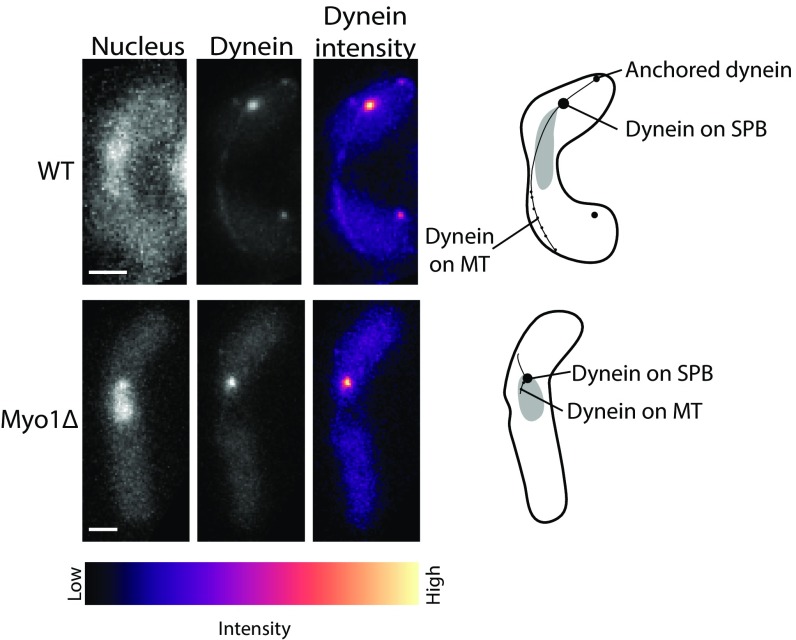
Because cells lacking Myo1 showed altered association patterns of Mcp5 with the membrane, we set out to test the role of Myo1 in ensuring cortical localization of dynein during nuclear oscillations. To this end, we constructed a strain that expressed fluorescently tagged dynein heavy chain (Dhc1) in the background of Myo1 deletion (strain VA049; Table S1). In 90% of wild-type zygotes during nuclear oscillations, Dhc1 was observed on the SPB, as bright spots on the cortex and as fainter spots on the microtubule (Fig. 6, Top; n = 27/30 cells). The cortical dynein spots in the wild-type cell are responsible for force production and, as a result, nuclear oscillations. In the wild-type cells exhibiting nuclear oscillations, we observed 2 ± 1 (mean ± SD) cortical dynein spots per cell. However, in the Myo1Δ background, Dhc1 was mostly absent from the cortex and the microtubule, being concentrated primarily on the SPB (Fig. 6, Bottom; n=25/30 cells). This confirms that by perturbing localization of Mcp5 to the membrane via deletion of Myo1, the association of dynein with the cortex is also affected.
Fig. 6.
Dynein dissociates from the cortex in cells lacking Myo1. Fluorescence images of Hoechst-stained nucleus (Top and Bottom Left), fluorescent Dhc1 (“Dynein,” Top and Bottom Center), and the intensity map of Dhc1 in wild-type (Top) and Myo1Δ (Bottom) fission yeast zygotes (strain SV111 and strain VA049, respectively; Table S1). The intensity range is shown below the images. The schematics that appear alongside the images depict the localization of dynein at different locations in the cell. In a Myo1Δ background, dynein is absent from the cortex and the microtubules and appears almost exclusively on the SPB. (Scale bar, 2 µm.)
PI(4,5)P2 Depletion and Myo1 Deletion Abrogate Nuclear Oscillations.
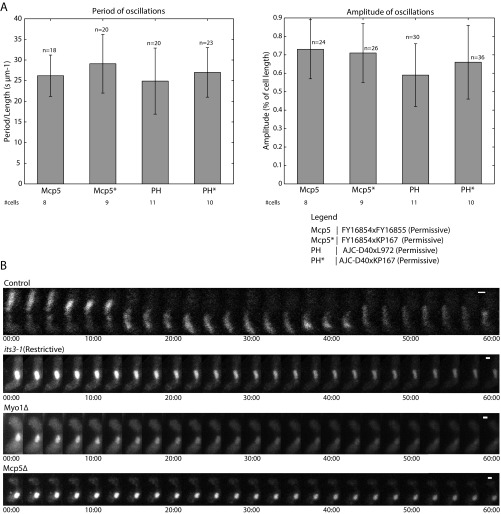
Finally, we set out to test the effect of PI(4,5)P2 depletion and Myo1 deletion on nuclear oscillations in fission yeast. Because Mcp5 localization is affected in both cases, we expected irregularities in the nuclear oscillations in both these backgrounds. Wild-type cells exhibit robust oscillations from one cell pole to the other, with a period of oscillation of about 10 min and amplitude of around 5 µm (Fig. 7A and Fig. S7A). As before, we induced meiosis in cells expressing PLC-PH in the its3-1 background at 27 °C and shifted them to the restrictive temperature of 36 °C 3–4 h before the horsetail nuclear movement stage. In this case, we observed that the oscillation of the horsetail nucleus was completely abrogated (Fig. 7B and Fig. S7B; n = 19 cells), similar to what was observed in cells lacking Mcp5 altogether (Fig. 7D and Fig. S7B; n = 27 cells). So too, deletion of Myo1, which leads to mislocalization of dynein, caused cessation of the nuclear oscillations (Fig. 7C and Fig. S7B; n = 24 cells).
Fig. 7.
Nuclear oscillations are affected in cells depleted of PI(4,5)P2 and lacking Myo1. (A) Image of the nucleus stained with Hoechst (Left) and the maximum intensity projection onto the y axis along time (Right) of a representative control cell (strain FY16854xKP167; Table S1), showing robust nuclear oscillations. The amplitude and period of oscillations are quantified in Fig. S7A. (B) Image of the nucleus stained with Hoechst (Left) and the maximum intensity projection onto the y axis along time (Right) of a representative its3-1 cell shifted to restrictive temperature 3–4 h before the nuclear oscillations phase (strain KP167xAJC-D40; Table S1), showing impaired nuclear oscillations. (C) Image of the nucleus stained with Hoechst (Left) and the maximum intensity projection onto the y axis along time (Right) of a representative Myo1Δ cell (strain FY13572; Table S1), showing cessation of nuclear oscillations. (D) Image of the nucleus stained with Hoechst (Left) and the maximum intensity projection onto the y axis along time (Right) of a representative Mcp5Δ cell (strain VA024; Table S1), showing abrogation of nuclear oscillations.
Fig. S7.
Horsetail nuclear oscillations are perturbed in cells without PI(4,5)P2 or Myo1. (A) Bar plots showing the comparison of the period of oscillations normalized to cell length (Left, in units of s µm−1) and amplitude of oscillations (Right, as a percentage of cell length) in different strains in which cells were grown at permissive temperature and PI(4,5)P2 levels were not depleted. The number of oscillations that were considered for each dataset is indicated above the bars, and the number of cells analyzed for each dataset is indicated below the plots. The legend for the cross performed for each dataset is as indicated (see Table S1 for more details). (B) Montage of nuclear oscillations in a Hoechst-stained control zygote (Top, strain FY16854xKP167; see Table S1). Nuclear oscillations are prominently absent in zygotes with PI(4,5)P2 depletion [its3 (Restrictive), Second From Top, strain KP167xAJC-D40; see Table S1], with deletion of Myo1 (Myo1Δ, Third From Top, strain FY13572; see Table S1) or Mcp5 (Mcp5Δ, Bottom, strain VA024; see Table S1). The duration of each time lapse from which the montages were made was 60 min (n > 3 cells per dataset). The numbers below the montages depict time (mm:ss). (Scale bar, 2 µm.)
SI Materials and Methods
Imaging of Zygotes in TIRF for Identification of Bleaching Steps.
Fission yeast cells expressing Mcp5-GFP (FY16854 × FY16855; Table S1) were allowed to undergo meiosis. Cells were adhered onto glass-bottom dishes coated with 2 mg/mL lectin and were imaged under a TIRF microscope in liquid EMM-N. Cells that were in the horsetail nuclear movement phase were selected and imaged in a stream with 30 mW laser power of a 488-nm laser, 20-ms exposure time, and 5,000 repetitions. For identification of bleaching steps, the time lapse obtained for each cell was subjected to a five-frame sliding average to improve the signal-to-noise ratio. Thus, we had time lapses with an effective time interval of 0.1 s. These were then analyzed with STEPFINDER software to detect bleaching steps.
Analysis of Mcp5, PLC-PH, and Myo1 Signal on the Membrane in Fission Yeast Zygotes.
To analyze the profile of Mcp5, PLC-PH, and Myo1 localization on the membrane, cells that were in the horsetail nuclear movement were identified. The leading side was assigned based on the nuclear movement. The leading pole was assigned P1 and the lagging pole P2. In cells where nuclear oscillations were not apparent, such as in cells with PI(45)P2 depletion, Myo1 deletion, or MBC– and AMP–PNP-treated cells, one pole was arbitrarily assigned as P1 and the opposite P2. C1 and C2 were the central regions of the cell going clockwise from P1 and P2, respectively. The outline of the membrane was traced in Fiji and the “Plot profile” function was carried out to obtain the intensity for each cell along P1, C1, P2, C2, and coming back to P1.
All of the intensities thus obtained for each dataset were first normalized individually for intensity and for the cell perimeters (length). Additionally, in the profile for Figs. S2B and S5A, because the signal intensities were incomparable between Mcp5-3mCherry and PH-GFP and between Myo1-GFP and Mcp5-3mCherry, respectively, the data were offset by subtracting each normalized intensity value from the mean for that dataset. The data for each cell was then binned into 100 points. Thus, P1 corresponds to bin 0 and 100, P2 corresponds to bin 50, C1 to bin 25, and C2 to bin 75. The mean across each bin for all of the cells was obtained to get the mean intensity and the SEM at that particular bin location for that particular dataset.
Correlation Analysis.
Autocorrelation and cross-correlation analyses were performed on the mean normalized intensity values of Mcp5, PLC-PH, and Myo1 along the membrane between different datasets as described in the captions of the figures. The mean normalized intensity values (obtained as described above) were then treated for offset correction by subtracting each normalized intensity value from the mean of the dataset. The correlation analysis was performed using the xcorr function in Matlab. The x axis of the plot thus obtained shows the lag—for example, at lag 0, the 0 bins of two signals that are considered for cross/autocorrelation are superimposed on each other; that is, P1 of one signal against P1 of another; at lag 50, the P1 position (bin 0) of one curve is imposed on the P2 position (bin 50) of the other and so on. The y axis gives the correlation value: higher value indicates higher correlation.
Treatment of Zygotes with Carbendazim (MBC), Latrunculin A (LatA), and AMP–PNP.
For depolymerization of the microtubules and actin, zygotes were treated with 25 μg/mL MBC (Sigma-Aldrich, cat. no. 378674) and 100 μM LatA (Sigma-Aldrich, cat. no. L5163), respectively, as described previously (11, 19), and imaged 15 min after addition of drugs. The drugs were not washed out during imaging.
AMP–PNP treatment at a concentration of 2 mM was carried out as described previously (32). Briefly, cells were permeabilized for 10 min with 0.3% TritonX-100 in EMM-N, washed thrice with EMM-N, and treated with 2 mM AMP–PNP (Sigma-Aldrich, cat. no. A2647) in EMM-N for 30 min during imaging. The efficacy of 2 mM AMP–PNP in abrogating ATP-driven processes was tested as before (32) by monitoring the elongation of the mitotic spindle (Fig. S6 H and I).
Plasmid Transformation.
Transformation of strains FY15622 and KP167 with plasmids FYP2932 and FYP2934 (Table S1) was performed using the improved protocol for rapid transformation of fission yeast (44). Briefly, cells were grown overnight to log phase in low glucose EMM, pelleted, and washed with distilled water. The cells were then washed in a solution of lithium acetate/EDTA (100 mM LiAc, 1 mM EDTA, pH 4.9) and resuspended in the same solution. We added 1 µg of plasmid DNA to the suspension, followed by addition of lithium acetate/PEG [40% (wt/vol) PEG, 100 mM LiAc, 1 mM EDTA, pH 4.9]. This was then incubated at 30 °C for 30 min, followed by a heat shock of 15 min at 42 °C. Cells were then pelleted down, resuspended in TE solution (10 mM Tris⋅HCl, 1 mM EDTA, pH 7.5), and plated onto selective EMM plates with appropriate supplements.
Discussion
Our results indicate that the anchor proteins of dynein at the cortex in fission yeast are organized as distinct foci, about 30 in number per cell. Using TIRF microscopy, we identified that each of the Mcp5 foci in turn consists of around 10 molecules. The maximum number of dynein molecules that cluster into spots at the membrane during meiotic nuclear oscillations was roughly estimated to be around 30 per spot (11), which is the same order of magnitude as the number of Mcp5 molecules per cluster estimated here. This would imply a one-to-one interaction between dynein and Mcp5. In addition, we did not observe any significant dynamics or turnover of the Mcp5 clusters at time scales of ∼1 min and ∼10 min, similar to what was observed previously (7). However, we cannot rule out dynamics at longer time scales, as studies in budding yeast using Num1 tagged with photo-activatable GFP have demonstrated redistribution of Num1 among clusters in about 30 min (33).
We next identified and quantified the localization pattern of Mcp5 and PLC-PH on the membrane of fission yeast zygotes. We observed that the signals of both Mcp5 and PLC-PH showed spatial periodicity along the membrane, with the former appearing prominently at the poles and the latter appearing at the center of the cell. We discovered that the signal intensities of Mcp5 and PLC-PH surprisingly showed complementarity in their localizations, with a higher intensity of Mcp5 where PLC-PH intensity was low and vice versa. We demonstrated that this pattern was likely formed due to competition between Mcp5 and PLC-PH for PI(4,5)P2 on the membrane by quantification of the localization pattern of PLC-PH in the background of zygotes lacking Mcp5. Previous research in budding yeast has identified the homologous protein Num1’s PH domain to have the highest affinity for PI(4,5)P2 among all of the proteins containing PH domains in Saccharomyces cerevisiae (13). Therefore, the complementarity in Mcp5 and PLC-PH localizations at the membrane is likely due to Mcp5’s high affinity for PI(4,5)P2. In budding yeast, the formation of clusters was dependent on the N-terminal CC of Num1, which was identified to have a Bin–Amphiphysin–Rvs (BAR)-like domain, capable of homodimerization, similar to BAR domain-containing proteins (16). Accordingly, the formation of Num1 clusters is proposed to occur at regions of high curvature on the membrane via their BAR-like domains (16). Perhaps, Mcp5 could use a similar strategy for clustering at the membrane. To answer this, future experiments that identify whether such a domain exists in Mcp5 will have to be performed.
Further, we identified PI(4,5)P2 to be the likely binding partner of Mcp5 at the cortex. First, we expressed PLC-PH in a strain with a temperature-sensitive mutation of its3, the PI(4)P5K in fission yeast. By shifting zygotes to restrictive temperatures just before meiotic prophase, we depleted PI(4,5)P2 in the cells and consequently observed that the localization patterns of both PLC-PH and Mcp5 were perturbed. Second, we transformed its3-1 cells with Mcp5 and compared its localization at permissive and restrictive temperatures. Although at permissive temperature Mcp5 exhibited cortical localization, after 5.5 h at restrictive temperature, the cortical localization was abrogated. Third, its3-1 cells were transformed with the PH domain of Mcp5 tagged with GFP to visualize its specific interaction with the membrane. Indeed, growth at permissive temperature exhibited Mcp5-PH molecules on the membrane, whereas shift to restrictive temperature showed a dramatic relocalization of Mcp5-PH to the cytoplasm. Taken together, these results indicated that Mcp5 depends on PI(4,5)P2 for cortical localization in fission yeast. In HeLa cells during anaphase, dynein has been observed to interact with phosphatidylinositol 4-phosphate and PI(4,5)P2 on the membrane via the ternary complex protein NuMA (34). As discussed previously, Num1’s PH domain also depends on PI(4,5)P2 for membrane localization (13, 14, 16). In all these cases, a stable interaction between the motor protein and the membrane is essential for nuclear movement and positioning. In other systems that use an association between the membrane and dynein for nuclear organization, such as in Drosophila neuroblasts, Caenorhabditis elegans one-celled embryo, and metaphase of mammalian cells, myristoylation of the Gαi protein in the ternary complex is essential for membrane localization of dynein (35–38). Recently, it was discovered that dynein clusters on cholesterol-rich microdomains on late phagosomes, which enables them to move in a persistent minus-end–directed fashion toward lysosomes (39). However, it is unknown whether the localization of dynein to these microdomains is mediated by PI(4,5)P2.
We identified the myosin I motor in fission yeast, Myo1, to be indispensable for the organization of Mcp5 and consequently that of cytoplasmic dynein at distinct locations on the cortex. At present, reports of interaction between actin-based motors and microtubule-based motors have been restricted to their roles in cargo transport, such as the melanophore transport in fish by coordination of myosin V, kinesin, and cytoplasmic dynein (40). Here, we have discovered an interplay between the two motor groups, wherein the force-generating function of cytoplasmic dynein at the cortex is facilitated by the activity of Myo1 that serves to organize the membrane. Although it is not yet clear how Myo1 brings about membrane organization, we discovered that the ATP-driven motor activity of Myo1 is not required for its membrane organization function and hence for localization of Mcp5 and dynein. The sterol organization by Myo1 could effect preferential enrichment of PI(4,5)P2 at the poles, which in turn would increase Mcp5’s association with the poles via its PH domain. Moreover, local enrichment of PI(4,5)P2 in microdomains has been proposed to be capable of inducing positive curvature in the membrane (41). If Mcp5 does indeed contain a BAR-like domain at its N terminus, clustering of Mcp5 could be further enabled by its targeting to regions of high curvature on the membrane. In our experiments, we observed only a slight increase in PLC-PH intensity at the poles in the absence of Mcp5 (Fig. 3), likely due to restrictions imposed by using PLC-PH as a proxy for PI(4,5)P2 localization (42). Future experiments with improved probes for PI(4,5)P2 will provide better insight into the Myo1–PI(4,5)P2–Mcp5–dynein axis.
Finally, we demonstrated that either depletion of PI(4,5)P2 or deletion of Myo1 essentially renders dynein inactive and leads to cessation of nuclear oscillations, much like the phenotype observed in cells lacking dynein or Mcp5 (2, 6, 7).
Conclusions
In conclusion, using advanced light microscopy and image analysis, we quantified the dynamics and organization of both Mcp5 and PLC-PH at the membrane. We discovered that the anchor protein Mcp5 is dependent on the phospholipid PI(4,5)P2 and the myosin motor Myo1 for proper cortical localization. Cortical localization of cytoplasmic dynein, which is required for force production, is abolished in a Myo1 deletion background. Perturbation of PI(4,5)P2 levels or deletion of Myo1 leads to aberrant nuclear oscillations and, in effect, perturbed dynein activity.
Materials and Methods
Strains and Media.
The fission yeast strains used in the study are listed in Table S1. Cells were grown on Yeast Extract (YE) medium or Edinburgh Minimal Medium (EMM) (43) with the appropriate supplements. Unless otherwise indicated, cells were grown at a temperature of 27 °C in an incubator (Ascension Innovations).
Construction of Strains.
Strain VA024 was constructed by crossing strain AJC-D40 (h+ leu1-padh1-PHP-GFP-leu1-32 ura4-D18; Table S1) with strain FY16831 (h− ade6-M26 ura4- D18 mcp5::ura4+; Table S1) following the Random Spore Analysis (RSA) protocol (43). Similarly, strain VA026 was constructed by crossing strain AJC-D40 (Table S1) with strain IF960 (h90 num1-3mCherry-hphR ade6-M216 leu1; Table S1), strains VA044 and VA045 were constructed by crossing strain FY13570 (h− myo1::kanr ade6-M216 leu1; Table S1) with strain AY277 (h90 num1-3mCherry-hphR ade6-M216 leu1 ura4-D18; Table S1); strain VA046 was constructed by crossing strain FY13579 (h− myo1+-GFP<<kanr ade6-M210 leu1; Table S1) with AY277; strain VA049 was constructed by crossing strain SV111 (h90 dhc1-mCherry-nat r leu1-32 lys1 ura4-D18; Table S1) with strain FY13570; strain VA050 was constructed by crossing strain AJC-D40 with strain FY13570 (Table S1); strain VA051 was constructed by crossing strain SV91 (h90 mcp5-mCherry-kan r dhc1-GFP-Leu2 leu1-32 lys1 ura4-D18) with strain FY12794 (h90 leu1-32 ura4-D18 ade6-M210 cam2::ura4+); and strain VA053 was constructed by crossing strain AY277 with strain FC1261 [h− myo1(H/TH1)-kanMX leu1-32 ura4-D18 ade6] and selecting the appropriate strain using RSA.
Induction of Meiosis and Preparation of Cells for Imaging.
Meiosis was induced in h90 strains by suspending a loopful of cells in 100 µL of 0.85% NaCl and spotting on to malt extract agar (MEA) plates (43). For a cross between h+ and h−, equal amounts of both strains were taken and resuspended in NaCl before spotting onto a MEA plate. The plate was incubated for 8 h and 15 h at room temperature for h90 and h+/h− cross, respectively, to obtain zygotes. In experiments involving temperature-sensitive mutations, the cross was maintained at specific temperatures for specific times as mentioned in Results. For imaging, a toothpick full of cells was resuspended in 200 µL of EMM-N and aspirated onto a 2 mg/mL lectin (Sigma-Aldrich, cat. no. L2380)-coated, 0.17-mm glass-bottom dish (SPL, cat. no. 100350). Cells were allowed to adhere to the glass bottom for 15–20 min. Unattached cells were washed out, and cells were imaged in EMM-N.
Staining of Nuclei with Hoechst.
The nuclei of fission yeast zygotes were stained with Hoechst 33342 (Sigma-Aldrich, cat. no. B2261). Cells that were induced to undergo meiosis on MEA were first washed with water and then resuspended in 1–2 µg/mL Hoechst for 20 min at room temperature. Cells were washed again after Hoechst staining and resuspended in EMM-N for imaging.
Microscopy.
TIRF imaging was carried out on a custom-built TIRF microscope with stage body and controller from Applied Scientific Instrumentation, with an Olympus (Tokyo, Japan) UASPlanApo 100×/1.49 N.A. TIRF objective with a correction collar. Images were captured on an Andor iXon Ultra DU-897 BV back-illuminated EMCCD. The pixel separation was 160 nm. GFP excitation was carried out with a 488-nm Sapphire laser (Coherent), and emission was filtered with a 536/40-nm bandpass filter. The system was controlled using Micro Manager 1.420 software. For counting the number of Mcp5 in each cluster on the membrane, 30 mW of the 488-nm laser excitation was used. The cells were focused in TIRF mode so as to visualize the Mcp5 foci, and a stream of 5,000 images was obtained with an exposure time of 20 ms for each frame. The intensities over each five frames of the movie were averaged to obtain a higher signal-to-noise ratio, and the resulting 1,000-frame movie was used for tracking.
Confocal microscopy was performed on an INCell Analyzer 6000 (GE Healthcare) with 60×/0.7 N.A. objective, fitted with an sCMOS 5.5 Mp camera with an x–y pixel separation of 108 nm. In addition, fluorescence imaging was carried out using an inverted epifluorescence microscope (Olympus IX83) with stage body and controller from Applied Scientific Instrumentation and 100×/1.4 N.A. objective. Excitation wavelength was selected through Spectra X light engine (Lumencor Inc.), and band pass filters in a high-speed filter wheel (ASI Inc.) were used for emission wavelength. The images were acquired using Evolve 512 EMCCD camera (Photometrics). The system was controlled using Slide Book6 (ver.6.0.3) software. For Hoechst, GFP, and mCherry imaging, the 405-, 488-, and 561-nm laser lines and bandpass emission filters 455/50, 525/20, and 605/52nm, respectively, were used. For obtaining the intensity profiles, fission yeast zygotes were selected, and a z-stack spanning the entire cell (9–11 slices, with a step size of 0.5 µm) was obtained. The summed intensity projection of the stack was then used for analysis. For visualizing the nuclear oscillations in Fig. 7, a three-slice z-stack with 0.5-µm step size was obtained for a total of 25 time frames, with a 25-s interval between each time frame.
Image Analysis and Plotting.
Tracking of Mcp5 clusters in TIRF and intensity measurements were performed using the Low Light Tracking Tool plugin for Fiji/ImageJ (23). Bleaching step identification was performed using STEPFINDER software (24). Intensity profiles of Mcp5, PLC-PH, Myo1, and dynein were obtained using Fiji/ImageJ software. MSD analysis was performed using custom functions written in Matlab (Mathworks). All plots were created using Matlab.
Supplementary Material
Acknowledgments
We thank Leeba Ann Chacko and Milind Singh for help with pilot experiments; the High Content Imaging Facility at the Centre for BioSystems Science and Engineering, Indian Institute of Science, Rahul Roy, and Deepak Saini for the use of the confocal, total internal reflection fluorescence, and fluorescence microscopes, respectively; John Callegari, Fred Chang, Mithilesh Mishra, Akira Yamashita, Kuno Takayoshi, and National BioResource Project (Japan) for yeast strains; Dr. Jacob Kerssemakers and Dr. Marileen Dogterom for STEPFINDER software; Iva Tolić, Nenad Pavin, Sandhya S. Visweswariah, and Siddharth Jhunjhunwala for constructive comments on the manuscript; and Department of Science and Technology (India)-INSPIRE Faculty Award, Department of Biotechnology (India) Innovative Young Biotechnologist Award, and Science and Engineering Research Board (India) Early Career Research Award for funding.
Footnotes
The authors declare no conflict of interest.
This article is a PNAS Direct Submission.
This article contains supporting information online at www.pnas.org/lookup/suppl/doi:10.1073/pnas.1615883114/-/DCSupplemental.
References
- 1.Yamamoto A, Tsutsumi C, Kojima H, Oiwa K, Hiraoka Y. Dynamic behavior of microtubules during dynein-dependent nuclear migrations of meiotic prophase in fission yeast. Mol Biol Cell. 2001;12(12):3933–3946. doi: 10.1091/mbc.12.12.3933. [DOI] [PMC free article] [PubMed] [Google Scholar]
- 2.Yamamoto A, West RR, McIntosh JR, Hiraoka Y. A cytoplasmic dynein heavy chain is required for oscillatory nuclear movement of meiotic prophase and efficient meiotic recombination in fission yeast. J Cell Biol. 1999;145(6):1233–1249. doi: 10.1083/jcb.145.6.1233. [DOI] [PMC free article] [PubMed] [Google Scholar]
- 3.Ding DQ, Chikashige Y, Haraguchi T, Hiraoka Y. Oscillatory nuclear movement in fission yeast meiotic prophase is driven by astral microtubules, as revealed by continuous observation of chromosomes and microtubules in living cells. J Cell Sci. 1998;111(Pt 6):701–712. doi: 10.1242/jcs.111.6.701. [DOI] [PubMed] [Google Scholar]
- 4.Chikashige Y, et al. Telomere-led premeiotic chromosome movement in fission yeast. Science. 1994;264(5156):270–273. doi: 10.1126/science.8146661. [DOI] [PubMed] [Google Scholar]
- 5.Vogel SK, Pavin N, Maghelli N, Jülicher F, Tolić-Nørrelykke IM. Self-organization of dynein motors generates meiotic nuclear oscillations. PLoS Biol. 2009;7(4):0918–0928. doi: 10.1371/journal.pbio.1000087. [DOI] [PMC free article] [PubMed] [Google Scholar]
- 6.Saito TT, Okuzaki D, Nojima H. Mcp5, a meiotic cell cortex protein, is required for nuclear movement mediated by dynein and microtubules in fission yeast. J Cell Biol. 2006;173(1):27–33. doi: 10.1083/jcb.200512129. [DOI] [PMC free article] [PubMed] [Google Scholar]
- 7.Yamashita A, Yamamoto M. Fission yeast Num1p is a cortical factor anchoring dynein and is essential for the horse-tail nuclear movement during meiotic prophase. Genetics. 2006;173(3):1187–1196. doi: 10.1534/genetics.105.050062. [DOI] [PMC free article] [PubMed] [Google Scholar]
- 8.Fujita I, Yamashita A, Yamamoto M. Dynactin and Num1 cooperate to establish the cortical anchoring of cytoplasmic dynein in S. pombe. J Cell Sci. 2015;128(8):1555–1567. doi: 10.1242/jcs.163840. [DOI] [PubMed] [Google Scholar]
- 9.Vallee RB, Williams JC, Varma D, Barnhart LE. Dynein: An ancient motor protein involved in multiple modes of transport. J Neurobiol. 2004;58(2):189–200. doi: 10.1002/neu.10314. [DOI] [PubMed] [Google Scholar]
- 10.Martín-Castellanos C, et al. A large-scale screen in S. pombe identifies seven novel genes required for critical meiotic events. Curr Biol. 2005;15(22):2056–2062. doi: 10.1016/j.cub.2005.10.038. [DOI] [PMC free article] [PubMed] [Google Scholar]
- 11.Ananthanarayanan V, et al. Dynein motion switches from diffusive to directed upon cortical anchoring. Cell. 2013;153(7):1526–1536. doi: 10.1016/j.cell.2013.05.020. [DOI] [PubMed] [Google Scholar]
- 12.Lammers LG, Markus SM. The dynein cortical anchor Num1 activates dynein motility by relieving Pac1/LIS1-mediated inhibition. J Cell Biol. 2015;211(2):309–322. doi: 10.1083/jcb.201506119. [DOI] [PMC free article] [PubMed] [Google Scholar]
- 13.Yu JW, et al. Genome-wide analysis of membrane targeting by S. cerevisiae pleckstrin homology domains. Mol Cell. 2004;13(5):677–688. doi: 10.1016/s1097-2765(04)00083-8. [DOI] [PubMed] [Google Scholar]
- 14.Tang X, Punch JJ, Lee W-L. A CAAX motif can compensate for the PH domain of Num1 for cortical dynein attachment. Cell Cycle. 2009;8(19):3182–3190. doi: 10.4161/cc.8.19.9731. [DOI] [PMC free article] [PubMed] [Google Scholar]
- 15.Kotak S, Gönczy P. Mechanisms of spindle positioning: Cortical force generators in the limelight. Curr Opin Cell Biol. 2013;25(6):741–748. doi: 10.1016/j.ceb.2013.07.008. [DOI] [PubMed] [Google Scholar]
- 16.Tang X, Germain BS, Lee WL. A novel patch assembly domain in Num1 mediates dynein anchoring at the cortex during spindle positioning. J Cell Biol. 2012;196(6):743–756. doi: 10.1083/jcb.201112017. [DOI] [PMC free article] [PubMed] [Google Scholar]
- 17.Lee W-L, Bezanilla M, Pollard TD. Fission yeast myosin-I, Myo1p, stimulates actin assembly by Arp2/3 complex and shares functions with WASp. J Cell Biol. 2000;151(4):789–800. doi: 10.1083/jcb.151.4.789. [DOI] [PMC free article] [PubMed] [Google Scholar]
- 18.Sirotkin V, Beltzner CC, Marchand J-B, Pollard TD. Interactions of WASp, myosin-I, and verprolin with Arp2/3 complex during actin patch assembly in fission yeast. J Cell Biol. 2005;170(4):637–648. doi: 10.1083/jcb.200502053. [DOI] [PMC free article] [PubMed] [Google Scholar]
- 19.Takeda T, Chang F. Role of fission yeast myosin I in organization of sterol-rich membrane domains. Curr Biol. 2005;15(14):1331–1336. doi: 10.1016/j.cub.2005.07.009. [DOI] [PubMed] [Google Scholar]
- 20.Pike LJ, Casey L. Localization and turnover of phosphatidylinositol 4,5-bisphosphate in caveolin-enriched membrane domains. J Biol Chem. 1996;271(43):26453–26456. doi: 10.1074/jbc.271.43.26453. [DOI] [PubMed] [Google Scholar]
- 21.Pike LJ, Miller JM. Cholesterol depletion delocalizes phosphatidylinositol bisphosphate and inhibits hormone-stimulated phosphatidylinositol turnover. J Biol Chem. 1998;273(35):22298–22304. doi: 10.1074/jbc.273.35.22298. [DOI] [PubMed] [Google Scholar]
- 22.Johnson CM, Chichili GR, Rodgers W. Compartmentalization of phosphatidylinositol 4,5-bisphosphate signaling evidenced using targeted phosphatases. J Biol Chem. 2008;283(44):29920–29928. doi: 10.1074/jbc.M805921200. [DOI] [PMC free article] [PubMed] [Google Scholar]
- 23.Krull A, et al. A divide and conquer strategy for the maximum likelihood localization of low intensity objects. Opt Express. 2014;22(1):210–228. doi: 10.1364/OE.22.000210. [DOI] [PubMed] [Google Scholar]
- 24.Kerssemakers JWJ, et al. Assembly dynamics of microtubules at molecular resolution. Nature. 2006;442(7103):709–712. doi: 10.1038/nature04928. [DOI] [PubMed] [Google Scholar]
- 25.Coffman VC, Wu J-Q. Counting protein molecules using quantitative fluorescence microscopy. Trends Biochem Sci. 2012;37(11):499–506. doi: 10.1016/j.tibs.2012.08.002. [DOI] [PMC free article] [PubMed] [Google Scholar]
- 26.Garcia P, et al. The pleckstrin homology domain of phospholipase C-delta 1 binds with high affinity to phosphatidylinositol 4,5-bisphosphate in bilayer membranes. Biochemistry. 1995;34(49):16228–16234. doi: 10.1021/bi00049a039. [DOI] [PubMed] [Google Scholar]
- 27.Zhang Y, et al. Phosphatidylinositol 4-phosphate 5-kinase Its3 and calcineurin Ppb1 coordinately regulate cytokinesis in fission yeast. J Biol Chem. 2000;275(45):35600–35606. doi: 10.1074/jbc.M005575200. [DOI] [PubMed] [Google Scholar]
- 28.Martin SG, Arkowitz RA. Cell polarization in budding and fission yeasts. FEMS Microbiol Rev. 2014;38(2):228–253. doi: 10.1111/1574-6976.12055. [DOI] [PubMed] [Google Scholar]
- 29.Petersen J, Nielsen O, Egel R, Hagan IM. F-actin distribution and function during sexual differentiation in Schizosaccharomyces pombe. J Cell Sci. 1998;111(Pt 7):867–876. doi: 10.1242/jcs.111.7.867. [DOI] [PubMed] [Google Scholar]
- 30.Takeda T, Kawate T, Chang F. Organization of a sterol-rich membrane domain by cdc15p during cytokinesis in fission yeast. Nat Cell Biol. 2004;6(11):1142–1144. doi: 10.1038/ncb1189. [DOI] [PubMed] [Google Scholar]
- 31.Sammons MR, et al. A calmodulin-related light chain from fission yeast that functions with myosin-I and PI 4-kinase. J Cell Sci. 2011;124(Pt 14):2466–2477. doi: 10.1242/jcs.067850. [DOI] [PubMed] [Google Scholar]
- 32.Kalinina I, et al. Pivoting of microtubules around the spindle pole accelerates kinetochore capture. Nat Cell Biol. 2013;15(1):82–87. doi: 10.1038/ncb2640. [DOI] [PubMed] [Google Scholar]
- 33.Vorvis C, Markus SM, Lee W-L. Photoactivatable GFP tagging cassettes for protein-tracking studies in the budding yeast Saccharomyces cerevisiae. Yeast. 2008;25(9):651–659. doi: 10.1002/yea.1611. [DOI] [PMC free article] [PubMed] [Google Scholar]
- 34.Kotak S, Busso C, Gönczy P. NuMA interacts with phosphoinositides and links the mitotic spindle with the plasma membrane. EMBO J. 2014;33(16):1815–1830. doi: 10.15252/embj.201488147. [DOI] [PMC free article] [PubMed] [Google Scholar]
- 35.Nguyen-Ngoc T, Afshar K, Gönczy P. Coupling of cortical dynein and G alpha proteins mediates spindle positioning in Caenorhabditis elegans. Nat Cell Biol. 2007;9(11):1294–1302. doi: 10.1038/ncb1649. [DOI] [PubMed] [Google Scholar]
- 36.Du Q, Macara IG. Mammalian Pins is a conformational switch that links NuMA to heterotrimeric G proteins. Cell. 2004;119(4):503–516. doi: 10.1016/j.cell.2004.10.028. [DOI] [PubMed] [Google Scholar]
- 37.Woodard GE, et al. Ric-8A and Gi alpha recruit LGN, NuMA, and dynein to the cell cortex to help orient the mitotic spindle. Mol Cell Biol. 2010;30(14):3519–3530. doi: 10.1128/MCB.00394-10. [DOI] [PMC free article] [PubMed] [Google Scholar]
- 38.Ananthanarayanan V. Activation of the motor protein upon attachment: Anchors weigh in on cytoplasmic dynein regulation. BioEssays. 2016;38(6):514–525. doi: 10.1002/bies.201600002. [DOI] [PubMed] [Google Scholar]
- 39.Rai A, et al. Dynein clusters into lipid microdomains on phagosomes to drive rapid transport toward lysosomes. Cell. 2016;164(4):722–734. doi: 10.1016/j.cell.2015.12.054. [DOI] [PMC free article] [PubMed] [Google Scholar]
- 40.Rodionov V, Yi J, Kashina A, Oladipo A, Gross SP. Switching between microtubule- and actin-based transport systems in melanophores is controlled by cAMP levels. Curr Biol. 2003;13(21):1837–1847. doi: 10.1016/j.cub.2003.10.027. [DOI] [PubMed] [Google Scholar]
- 41.Martin TFJ. Role of PI(4,5)P2 in vesicle exocytosis and membrane fusion. Subcell Biochem. 2012;59:111–130. doi: 10.1007/978-94-007-3015-1_4. [DOI] [PMC free article] [PubMed] [Google Scholar]
- 42.McLaughlin S, Wang J, Gambhir A, Murray D. PIP2 and proteins: Interactions, organization, and information flow. Annu Rev Biophys Biomol Struct. 2002;31(1):151–175. doi: 10.1146/annurev.biophys.31.082901.134259. [DOI] [PubMed] [Google Scholar]
- 43.Forsburg SL, Rhind N. Basic methods for fission yeast. Yeast. 2006;23(3):173–183. doi: 10.1002/yea.1347. [DOI] [PMC free article] [PubMed] [Google Scholar]
- 44.Kanter-Smoler G, Dahlkvist A, Sunnerhagen P. Improved method for rapid transformation of intact Schizosaccharomyces pombe cells. Biotechniques. 1994;16(5):798–800. [PubMed] [Google Scholar]
Associated Data
This section collects any data citations, data availability statements, or supplementary materials included in this article.


