Significance
Cellulose is the most abundant biopolymer on Earth and is a critical component for plants to grow and develop. Cellulose is synthesized by large cellulose synthase complexes containing multiple cellulose synthase A (CESA) subunits; however, how cellulose synthesis is regulated remains unclear. In this study, we identify BRASSINOSTEROID INSENSITIVE2 (BIN2) as a protein kinase that directly phosphorylates Arabidopsis CESA1 and further demonstrate that this phosphorylation event negatively regulates CESA activity, and thus cellulose biosynthesis, in Arabidopsis. Therefore, this study provides a clear link between cell wall biosynthesis and hormonal signal transduction pathways that regulate plant growth and development.
Keywords: plant cell wall, brassinosteroid, cellulose synthase, protein kinase, regulation
Abstract
The deposition of cellulose is a defining aspect of plant growth and development, but regulation of this process is poorly understood. Here, we demonstrate that the protein kinase BRASSINOSTEROID INSENSITIVE2 (BIN2), a key negative regulator of brassinosteroid (BR) signaling, can phosphorylate Arabidopsis cellulose synthase A1 (CESA1), a subunit of the primary cell wall cellulose synthase complex, and thereby negatively regulate cellulose biosynthesis. Accordingly, point mutations of the BIN2-mediated CESA1 phosphorylation site abolished BIN2-dependent regulation of cellulose synthase activity. Hence, we have uncovered a mechanism for how BR signaling can modulate cellulose synthesis in plants.
Plant growth is controlled by a plethora of intra- and extracellular processes; however, the major driving force for plant cell growth stems from changes in vacuolar turgor pressure that modulate cell volume. Because all plant cells are encased in cell walls, plant cell expansion is also dependent on synthesis and remodeling of cell wall polysaccharides, including cellulose (1). Cellulose is the most abundant biopolymer on Earth and is a fundamental constituent of plant cell walls. This paracrystalline polysaccharide is synthesized at the plasma membrane by cellulose synthase A (CESA) complexes (CSCs) (2). Current models suggest that the CSC is a heterotrimeric complex in which CESA1-, CESA3-, and CESA6-like CESAs are involved in primary wall cellulose synthesis in Arabidopsis thaliana (3, 4). Nascent cellulose chains are incorporated into the cell wall matrix, and additional synthesis pushes the CSC through the plasma membrane (5), which was confirmed by motile fluorescently labeled CESA proteins at the plasma membrane (6). Nevertheless, the regulation of CSC activity remains largely ill defined.
Phytohormones control plant growth and development. Among these hormones, brassinosteroids (BRs) are particularly important for normal plant cell expansion. BRs are perceived at the plasma membrane by the receptor-like kinase BRASSINOSTEROID INSENSITIVE1 (BRI1), which activates a signal transduction cascade, leading to the transcriptional regulation of BR-responsive genes (7, 8). A key regulator in BR signaling is the glycogen synthase kinase 3 (GSK3)-like BRASSINOSTEROID INSENSITIVE2 (BIN2) (9). In the absence of BRs, BIN2 is active and phosphorylates the two homologous transcription factors, BRASSINAZOLE RESISTANT1 (BZR1) and BZR2/BES1 (10, 11), which results in their inactivation and degradation. In contrast, when BR is present, BIN2 is inactivated and degraded (12), which leads to activation of BZR1 and BZR2/BES1, and therefore to transcriptional activation of BR-responsive genes. Thus, BIN2 serves as a key negative regulator of BR-mediated transcriptional responses. However, additional targets of BIN2 kinase and their role in the regulation of cell expansion remain to be elucidated.
Considering the importance of cell wall synthesis and environmental signaling for plant growth, close links between these processes have been postulated (13). For example, live-cell imaging has revealed that CSC speed is regulated by the red light/far-red light ratio in a PHYTOCHROME B (PHYB)-dependent manner, and this regulation was proposed to be mediated through CESA5 phosphorylation (14). Additionally, the BR-regulated BZR1/BES1 transcriptional activators directly bind the promoters of CESA genes involved in cellulose biosynthesis of the primary and secondary cell walls (15). However, more direct associations between CSC activity and BR signaling remain tenuous. Here, we show that BIN2 can phosphorylate CESA1 and that this phosphorylation negatively regulates CSC activity.
Results
Defects in BR Synthesis and Signaling Impair Cellulose Synthesis.
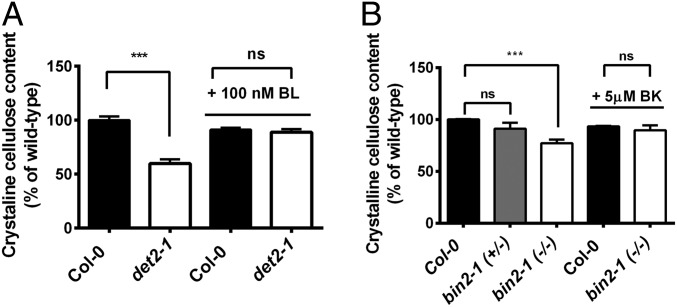
Previous work has demonstrated a potential relationship between BR signal transduction and the transcriptional regulation of CESA genes (15). To investigate the influence of BR signaling on cellulose synthesis in more detail, we first analyzed crystalline cellulose content in BR-deficient seedlings via the Updegraff assay. We found that mutations in DET2 (det2-1; a key enzyme in BR synthesis) (16) or a hypermorphic mutation in BIN2 that renders BIN2 constitutively active (bin2-1) (9) negatively impacted crystalline cellulose content in etiolated seedlings compared with wild-type seedlings (Fig. 1 A and B). Furthermore, etiolated det2-1 seedlings grown on media supplemented with epibrassinolide (eBL; 100 nM) restored the crystalline cellulose content to wild-type levels (Fig. 1A). Likewise, the crystalline cellulose content was restored to wild-type levels in bin2-1 seedlings grown on bikinin (5 μM; a potent BIN2 inhibitor) (17) (Fig. 1B). These data indicate that changes in BR synthesis and signaling impact the production of crystalline cellulose.
Fig. 1.
Cellulose biosynthesis depends on BR synthesis and signaling. The crystalline cellulose content of 5-d-old dark-grown seedlings was analyzed as described in Materials and Methods. (A) Crystalline cellulose content of wild-type Col-0 (black bars) and det2-1 (white bars) seedlings grown in the presence or absence of 100 nM eBL. (B) Similar analyses were performed for bin2-1 heterozygous (bin2-1+/−; gray bars) and homozygous (bin2-1−/−; white bars) mutants in the presence or absence of 5 μM bikinin (BK). Crystalline cellulose contents are reported as a percentage of the crystalline cellulose content of wild-type untreated controls. Error bars for both A and B represent SEM (n = 3 biological replicates per biological replicate, n = 2 technical replicates per biological replicate; ***P < 0.005 by Student’s t test). ns, not significant by Student’s t test.
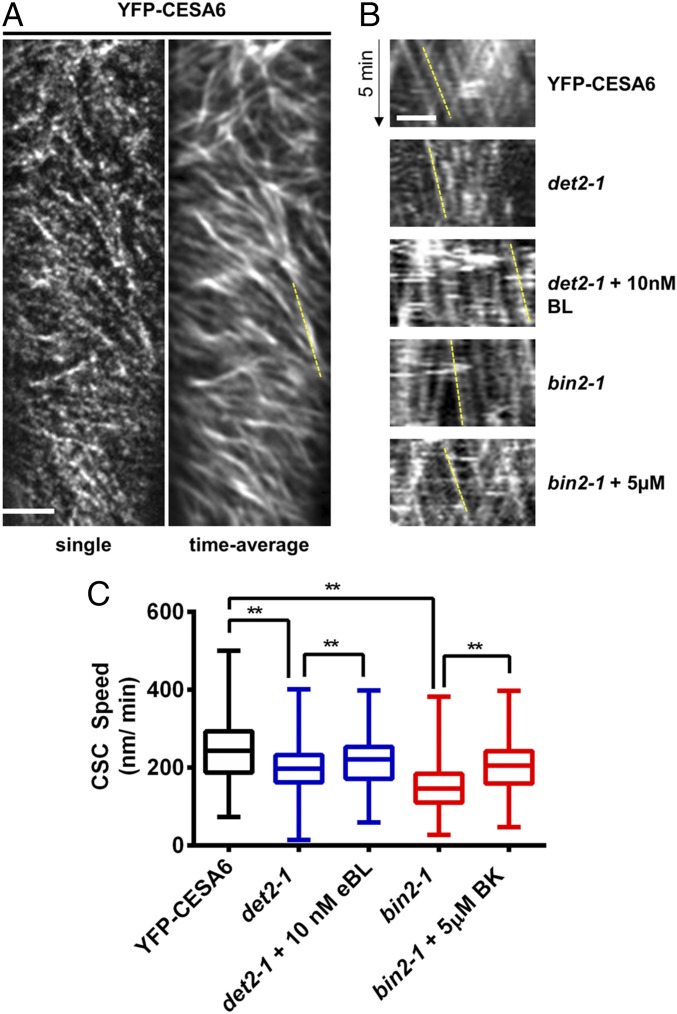
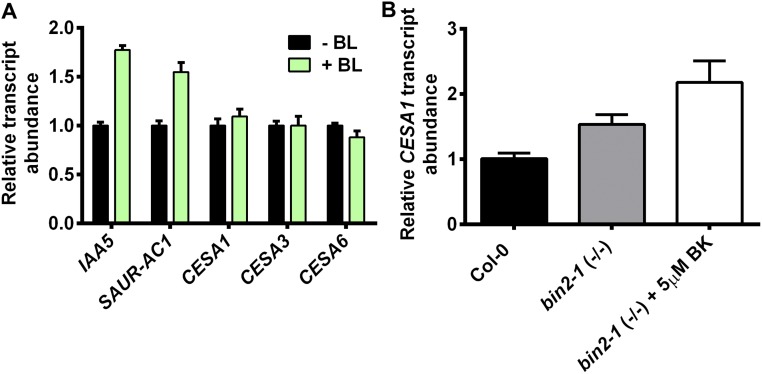
To investigate the relationship between cellulose synthesis and BR in more detail, we introgressed a transgenic YFP-CESA6 fluorescent reporter under the control of the CESA6 native promoter (6) into the det2-1 or bin2-1 mutant background. Previous studies have demonstrated that the speed of the CSC at the plasma membrane indicates cellulose synthase activity (6, 18–21). Hence, we investigated the CSC motility using time-averaged projections of CSC trajectories collected by spinning disk microscopy in det2-1 and bin2-1 and compared those trajectories with the trajectories of wild-type control (Fig. 2 A and B). The speeds of the CSCs were reduced by ∼20% in the det2-1 background (13 cells, seven seedlings, 790 particles), and treatment of exogenous eBL (10 nM for 30 min; 12 cells, six seedlings, 954 particles) significantly increased the CSC speeds in det2-1 (Fig. 2 B and C). Similarly, the CSC speeds were reduced by 40% in the bin2-1 mutant compared with wild-type control (YFP-CESA6: five cells, five seedlings, 330 particles; bin2-1: 14 cells, seven seedlings, 1,100 particles; Fig. 2 B and C). Furthermore, the speeds of the CSCs were significantly increased (eight cells, eight seedlings, 546 particles) in bin2-1 seedlings treated with bikinin (5 μM for 40 min) compared with control-treated bin2-1 seedlings (Fig. 2 B and C). Wild-type Col-0 plants treated with 10 nM eBL for 30 min did not exhibit increased CESA1 transcript levels (Fig. S1A). In contrast, both the bin2-1 mutant and the bin2-1 mutant treated with 5 μM BK had slightly higher transcript levels of CESA1 compared with control seedlings (Fig. S1B). Nevertheless, because CSC speeds were significantly reduced in bin2-1, it appears that the changes in CESA1 transcripts do not relate directly to CSC speeds. These data indicate that reduced BR synthesis in det2-1 or increased BIN2 activity in the constitutively active bin2-1 negatively impacts cellulose synthesis in Arabidopsis seedlings.
Fig. 2.
CSC speeds are altered in BR mutants. CSC speeds were examined in 4-d-old dark-grown seedlings by spinning disk microscopy. (A) Single-frame and time-averaged images of YFP-CESA6 control seedlings. (Scale bar: 5 μm.) (B) Kymographs of YFP-CESA6 are shown for the indicated genotype and treatment. The dashed yellow line indicates the slope of a representative YFP-CESA6–containing particle. (Scale bar: 5 μm.) (C) YFP-CESA6 speed distributions of det2-1 plus or minus 10 nM brassinolide (BL; blue boxes) and bin2-1 (red boxes) seedlings plus or minus 5 μM BK are shown compared with YFP-CESA6 control seedlings. Treatments were performed at the indicated concentration for 30 min before imaging. Error bars represent minimum and maximum values (n = 324–1,100 particles). One-way ANOVA indicated a significant difference: F(4, 3,681) = 249.5 (**P < 0.01 by Tukey post hoc analysis between the indicated conditions).
Fig. S1.
Quantification of CESA1 transcript abundance after brassinolide (BL) and bikinin (BK) treatment. (A) Total RNA was extracted from 4-d-old dark-grown seedlings with (green bars) or without (black bars) 30 min of treatment with 10 nM BL. RNA was converted to cDNA as described in SI Materials and Methods, and the transcript levels of CESA1, CESA3, and CESA6 were quantified by quantitative RT-PCR. The BL-induced genes IAA5 (At1g15580) and SAUR-AC1 (At4g38850) were used as positive controls. Error bars represent SEM (n = 3 biological replicates). (B) Total RNA was extracted from 7-d-old dark-grown hypocotyls of wild-type Col-0 (black bar) or homozygous bin2-1 (gray bar) mutant plants either untreated (gray bar) or treated with 5 μM BK for 30 min. RNA was converted to cDNA as described in SI Materials and Methods, and the CESA1 transcript level was determined using quantitative RT-PCR. Error bars represent SEM (n = 4).
The BIN2 Protein Kinase Can Phosphorylate Arabidopsis CESA1.
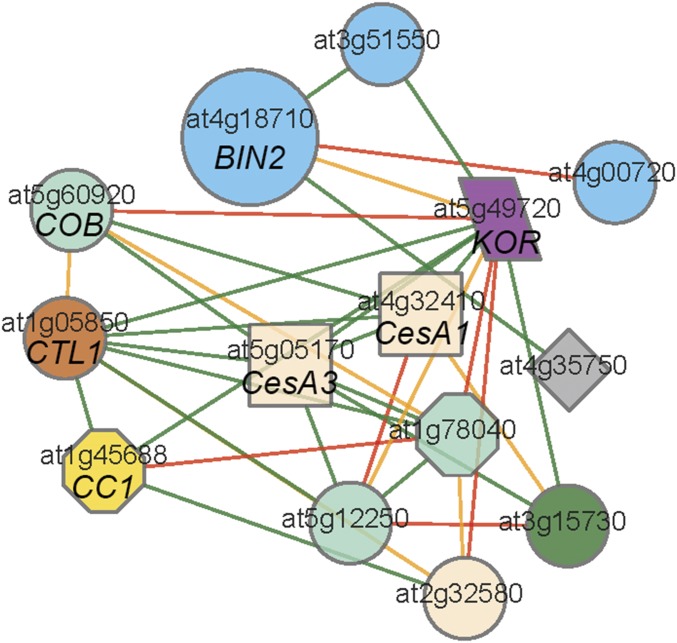
Genes that are transcriptionally coexpressed with the CESAs typically impact cellulose biosynthesis (22). To assess if any BR-related genes that could potentially influence cellulose biosynthesis were coexpressed with the CESAs, we used the recently developed FamNet (23) with several primary wall cellulose-related genes as queries, including CESA1, CESA6, the CSC-associated KORRIGAN 1 (KOR1) endoglucanase (24, 25), the GPI-anchored COBRA (26, 27), and the companion of cellulose synthase 1 (CC1) (28). Interestingly, we found that BIN2 was coexpressed with many of the primary wall cellulose-related genes (Fig. S2), suggesting that BIN2 might influence cellulose production, potentially through its protein kinase activity. Many CSC subunits can become phosphorylated at multiple positions (29–32), and some of these phosphorylation events have been demonstrated to regulate the CSC functionally (14, 33, 34). However, the corresponding protein kinases have remained unidentified.
Fig. S2.
Transcriptional coexpression network of BIN2 and primary cell wall CESAs. A coexpression network of primary wall CESAs and BIN2 (At4g18710) is shown. Nodes represent genes, and edges represent coexpression relationships. Different node shapes and colors and different edge colors, respectively, are explained at PlaNet (aranet.mpimp-golm.mpg.de/) and FamNet (www.gene2function.de/famnet.html).
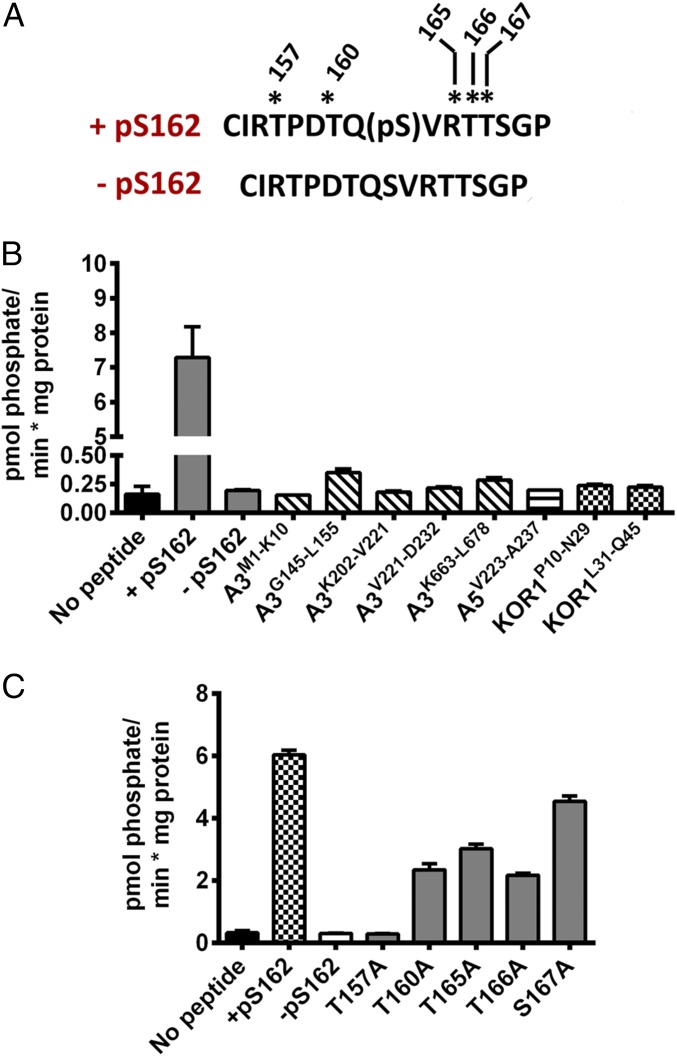
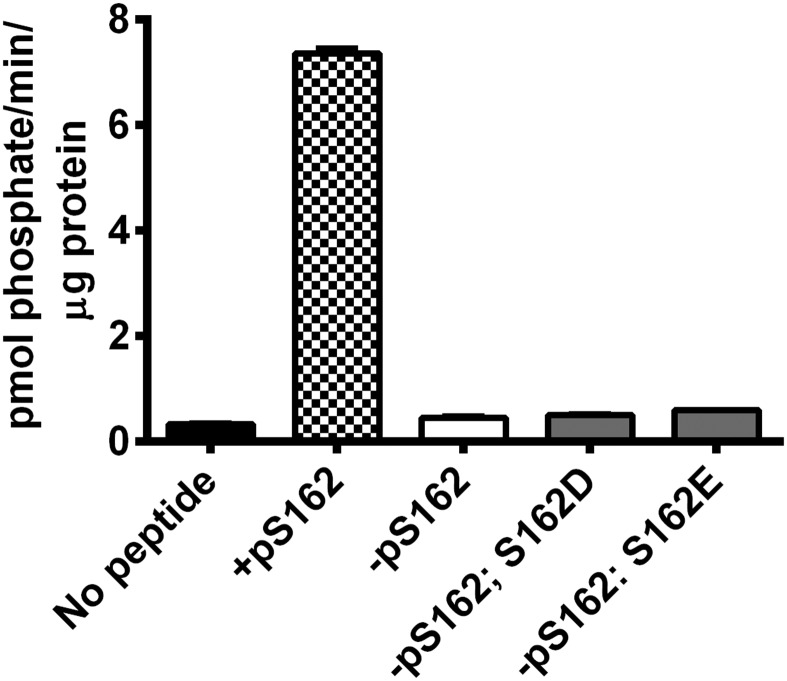
To test the hypothesis that BIN2 directly phosphorylates a component of the CSC, we produced synthetic peptides (Table S1) that corresponded to all reported phosphorylation sites in several cellulose-related proteins in Arabidopsis, including CESA1, CESA3, and CESA5, as well as KOR1 (29–32). BIN2 is a member of the GSK3-like kinase family, whose members can recognize substrates by either forming a stable protein complex with them or recognizing substrate epitopes that have been previously phosphorylated by an alternative protein kinase in a process known as priming phosphorylation. Because GSK3-related kinases may need phospho-primed substrates (35), we also generated several phospho-primed versions of the above peptides. We expressed and purified Arabidopsis BIN2 in Escherichia coli and performed in vitro protein kinase assays against the peptide substrates listed in Table S1. BIN2 phosphorylated a peptide with a phospho-primed serine residue corresponding to phosphorylated CESA1S162 (referred to as +pS162; Fig. 3A), but none of the other tested peptides (Fig. 3B). Interestingly, an identical peptide sequence with no phosphate (−pS162; Fig. 3A) was not phosphorylated by BIN2, suggesting that phosphorylation at CESA1S162 was required for substrate identification. To map the BIN2 phosphorylation site in the +pS162 peptide, we synthesized +pS162 peptides in which serine and threonine residues were systematically mutated to alanine, a residue that cannot be phosphorylated (Fig. 3C). We then retested whether BIN2 could phosphorylate these peptides by in vitro kinase assays. These assays revealed that BIN2 was unable to phosphorylate the +pS162 T157A variant, but could phosphorylate all other alanine substitution peptides to varying degrees (Fig. 3C). We further tested whether acidic amino acid substitutions could mimic the effect of the phosphoserine at CESA1S162, but these peptides were not BIN2 substrates (Fig. S3). These results indicate that BIN2 can phosphorylate a threonine residue corresponding to CESA1T157 in CESA1 if it is primed by CESA1S162 phosphorylation in vitro.
Table S1.
Protein kinase substrate peptides used in this study
| Substrate name | Peptide sequence | Region of the CSC |
| CP-16p; +pS162 | CIRTPDTQ(pS)VRTTSGP | CESA1 I155-P169, S162 phosphorylated |
| CP-16; −pS162 | CIRTPDTQSVRTTSGP | CESA1 I155-P169 |
| CD-25 | CKKKKIRTPDTQSVRTTSGPLGPSD | CESA1 I155-D174 |
| MC-14 | MESEGETAGKKKKC | CESA3 M1-K10 |
| CL-16 | CKKKKGEFSAASPERL | CESA3 G145-L155 |
| CV-24 | CKKKKQEKNTGPVSTQAASERGGV | CESA3 K202-V221 |
| CD-17 | CKKKKVDIDASTDILAD | CESA3 V221-D232 |
| CL-17 | CKKSGRHTDSTVPVFNL | CESA3 K663-L678 |
| CA-20 | CKKKKVKHDGDSSLGDGDDA | CESA5 V223-A237 |
| CN-25 | CKKKKPLEINTADSATDDDRSRNLN | KOR1 P10-N29 |
| CQ-18 | CKKLDRAALSRPLDETQQ | KOR1 L31-Q45 |
| CP-16 S162D | CIRTPDTQDVRTTSGP | CESA1 I155-P169, S162 mutated to D |
| CP-16 S162E | CIRTPDTQEVRTTSGP | CESA1 I155-P169, S162 mutated to E |
The name and amino acid sequence of each substrate peptide used in this study are shown with potential phosphorylated residues based on Arabidopsis phosphoproteomic data underlined and in bold. These residues were identified in aggregate phosphoproteomic data in PhosPhAt4.0 (phosphat.uni-hohenheim.de). The CSC component amino acid residues that these peptide substrates represent are also indicated. Additional lysine residues (indicated in italics) were added to certain peptides to increase phosphocellulose filter binding.
Fig. 3.
BIN2 can phosphorylate CESA1 in vitro. Recombinant Arabidopsis BIN2 was assayed using a series of peptides by in vitro kinase assays. (A) Region of Arabidopsis CESA1 that is phosphorylated is shown with the position of the +pS162 and its unphosphorylated counterpart (−pS162) indicated. Asterisks indicate potential phosphorylation sites in the +pS162 peptide. (B) Recombinant BIN2 was screened for activity against synthetic peptides representing experimentally supported phosphorylation sites in Arabidopsis CESA1 (gray bars), CESA3 (hatched bars), CESA5 (lined bar), and KOR1 (checked bars). (C) Synthetic peptides containing alanine substitutions at all possible S/T residues in the +pS162 peptide were assayed as substrates for recombinant BIN2. All assays were repeated at least two times in triplicates. Error bars represent SEM (n = 3).
Fig. S3.
Analysis of acidic substitutions at the S162 priming site. Arabidopsis BIN2 was expressed in Escherichia coli as described in SI Materials and Methods and assayed against peptide substrates based on the +pS162 peptide by in vitro kinase assays. The −pS162 peptides containing S162D or S162E substitutions (gray bars) were assayed compared with the +pS162 (checked bar) and −pS162 (white bar) native peptides. BIN2 samples incubated with no peptide served as a negative control (black bar). Error bars represent SEM (n = 4).
Point Mutations in CESA1 Render It Insensitive to BIN2 Phosphorylation and Enhance Cell Expansion.
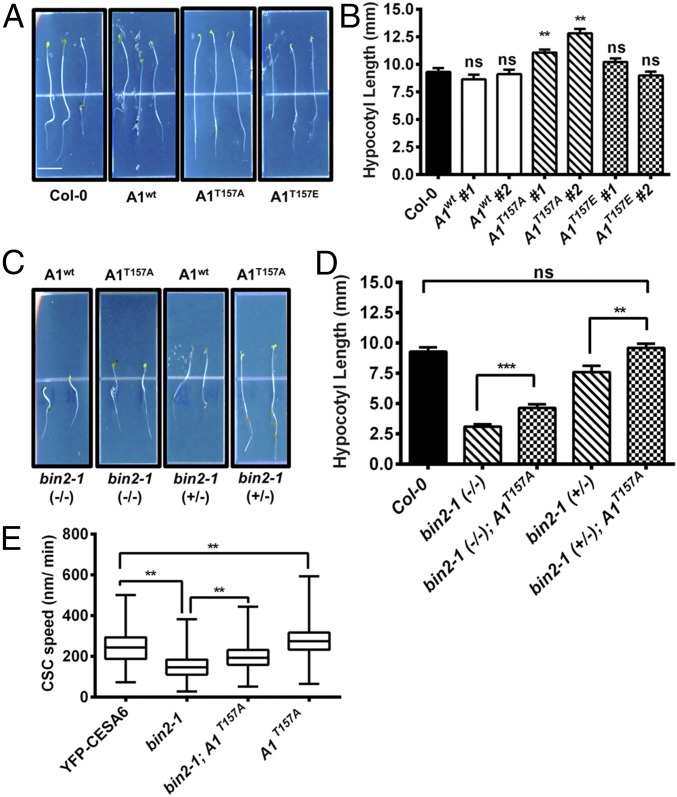
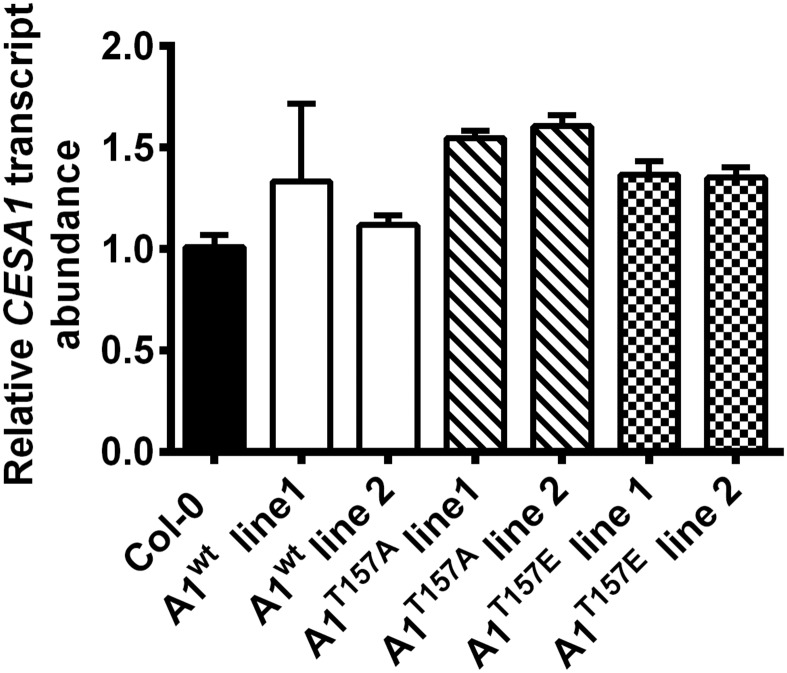
To examine the physiological function of the CESA1T157 BIN2 phosphorylation site, we generated transgenic Arabidopsis lines expressing the CESA1wt (A1wt), CESA1T157A (A1T157A), or CESA1T157E (A1T157E) gene under the control of the native CESA1 promoter in cesa1-null background (Materials and Methods). Because cesa1 null mutants are gametophytic-lethal (4), we transformed segregating heterozygous cesa1+/− plants and monitored cesa1 homozygosity via PCR genotyping. Transgenic lines expressing A1wt in the cesa1-null background were phenotypically indistinguishable from wild-type seedlings in a hypocotyl growth assay (Fig. 4 A and B). Similarly, cesa1 seedlings expressing A1T157E also did not show any phenotypes that deviated from wild-type seedlings (Fig. 4 A and B). In contrast, cesa1 mutant seedlings expressing A1T157A were 20–40% longer than A1wt-complemented cesa1 control lines or Col-0 controls (Fig. 4 A and B). Transcript levels of CESA1 in all lines were assayed to ensure that the phenotypes were not due to overexpression as a consequence of positional genomic effects (Fig. S4). All CESA1 transcript levels in the transgenic lines were within 1.5-fold levels of the expression in wild-type seedlings (Fig. S4), indicating that the growth differences between the lines are likely not due to differences in CESA1 expression (as discussed in the previous section). These results indicate that the inability of BIN2 to phosphorylate A1T157A could enhance cell expansion. To test this hypothesis, we introgressed bin2-1 into the A1T157A-expressing cesa1 mutants. Indeed, we found that both homozygous and heterozygous bin2-1 mutants containing the A1T157A mutant in the cesa1-null background produced significantly longer hypocotyls than the bin2-1 control seedlings (Fig. 4 C and D), suggesting that A1T157A partially complements the bin2-1 mutant hypocotyl growth phenotype.
Fig. 4.
Mutations of BIN2-targeted CESA1 phosphorylation sites restore growth and CSC velocity in bin2-1. Arabidopsis cesa1-null mutants were transformed with CESA1wt or CESA1T157 phosphorylation site mutants, and the growth behavior of these mutants was examined in 5-d-old dark-grown hypocotyls compared with wild-type Col-0 controls. (A) Representative images of CESA1T157A and CESA1T157E phosphorylation site mutants compared with wild-type Col-0 seedlings or cesa1-null mutants transformed with CESA1wt. (B) Quantification of hypocotyl lengths in seedlings from A. The means and SEM are presented as in Fig. 1B. One-way ANOVA revealed a significant difference: F(6, 518) = 16.32 (**P < 0.01; n = 58–103). ns, not significant from wild-type control by Tukey post hoc analysis. The CESA1T157A mutant was introgressed into a segregating population of the bin2-1 mutant to determine if CESA1T157A could partially complement bin2-1. (C) Representative images of bin2-1 (+/−) or bin2-1 (−/−) plants with or without CESA1T157A. (D) Quantification of hypocotyl lengths from C. Error bars represent SEM (n = 19–30). One-way ANOVA revealed a significant difference: F(4, 198) = 34.26. Multiple Student’s t tests were performed against the indicated conditions (**P < 0.01, ***P < 0.005). ns, not significant. (E) CSC velocities were measured in the bin2-1 background with or without CESA1T157A and in the CESA1T157A mutant by spinning disk microscopy. These results were compared with YFP-CESA6 control CSC velocities. Error bars represent minimum and maximum values (n = 320–1,784 complexes). One-way ANOVA revealed a significant difference: F(3, 4,379) = 1057 (**P < 0.01 by Tukey post hoc analysis between the indicated conditions).
Fig. S4.
CESA1 transcript quantification in CESA complement lines. RNA was extracted from 7-d-old dark-grown seedlings, converted to cDNA, and probed for CesA1 transcript by quantitative PCR as described in Materials and Methods. Relative CesA1 transcript levels are shown for CesA1wt (white bars), CesA1T157A (hatched bars), and CesA1T157E (checked bars) complemented lines compared with wild-type Col-0 as a reference (black bar). Error bars represent SEM (n = 4).
BIN2-Insensitive CESA1 Mutants Exhibit Increased CSC Activity.
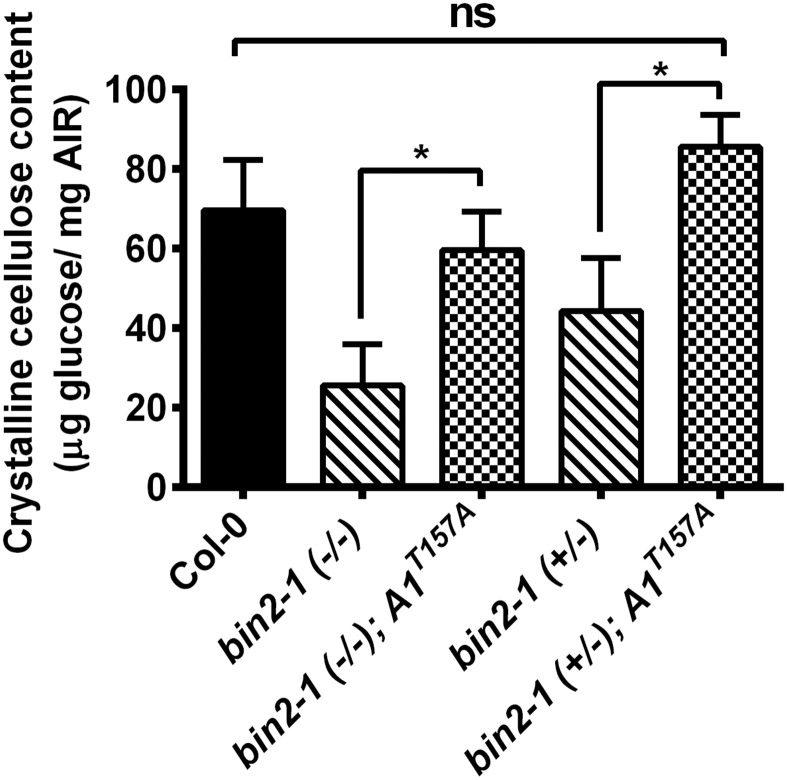
To assess further whether the increased seedling growth of A1T157A mutants corresponded to enhanced CSC activity, we introgressed YFP-CESA6 into the A1T157A-expressing cesa1 bin2-1 double mutant. Due to the fact that bin2-1 homozygotes display a drastically reduced seed set, seedlings were genotyped after imaging to verify the bin2-1 genotype. As demonstrated in Fig. 4E, the CSCs (YFP-CESA6) moved significantly faster in bin2-1 cesa1 seedlings that expressed A1T157A compared with the CSC speeds in the bin2-1 cesa1 seedlings that expressed A1wt. These results indicate that the A1T157A mutant is not susceptible to the enhanced BIN2-mediated phosphorylation in bin2-1, corroborating the hypothesis that BIN2 phosphorylates CESA1, decreases CSC activity, and thus reduces cellulose biosynthesis. Additionally, transgenic plants expressing only the A1T157A mutant exhibited faster CSC speeds than wild-type controls (Fig. 4E). Defects in secretion of the CSCs also affect cellulose synthesis (36). To assess whether the inability of BIN2 to phosphorylate CESA1 also resulted in trafficking defects, we performed fluorescence recovery after photobleaching experiments (19). We did not find any differences in YFP-CESA6 fluorescence recovery rates between the bin2-1 A1wt (1.85 ± 0.75 insertions per hour and square micrometer; five seedlings, 17 cells) and the bin2-1 A1T157A mutant (1.80 ± 0.78 insertions per hour and square micrometer; three seedlings, nine cells), indicating that the BIN2 is not having any major effects on the secretion of CESAs to the plasma membrane. To determine whether these alterations in CSC speed paralleled changes in cellulose deposition, we measured the crystalline cellulose contents of bin2-1 dark-grown seedlings with or without the expression of A1T157A. This experiment revealed that in both homozygous and heterozygous bin2-1 mutants, crystalline cellulose content was increased in genetic backgrounds that contained A1T157A (Fig. S5). These observations are again consistent with the hypothesis that BIN2 phosphorylates residue T157 in CESAl to regulate cellulose biosynthesis negatively in Arabidopsis.
Fig. S5.
Crystalline cellulose content analysis of bin2-1 mutants with or without CESA1 T157A. Cellulose contents of 7-d-old seedlings of the indicated genotype were measured via Saeman hydrolysis. Wild-type Col-0 controls (black bar) were compared with bin2-1 homozygous or heterozygous seedlings (hatched bars) and bin2-1 seedlings containing the CESA1 T157A mutant (checked bars). Error bars represent SEM (n = 3). Student’s t tests were performed against the indicated conditions (*P < 0.05). ns, not significant.
Discussion
Although many recent genetic and cell biological studies continue to define the components of the CSC (e.g., ref. 28), regulatory aspects of the complex are largely unresolved. In this study, we demonstrate that BIN2 kinase, which is transcriptionally coregulated with genes known to encode components of the CSC, can directly and uniquely phosphorylate Arabidopsis CESA1 in a priming phosphorylation-dependent manner.
Phosphoproteomic surveys in Arabidopsis (29–32), as well as in other plant species (37), indicate that CESA proteins are highly phosphorylated at a number of sites clustered in the N terminus and catalytic loop regions, and that these modifications might functionally regulate CSC activity. Indeed, mutations of CESA1 and CESA3 phosphorylation sites can influence the bidirectional motility of CSCs in Arabidopsis (33, 34). Similarly, phosphorylation of CESA5 regulates CSC speed in response to red light/far-red light in a phytochrome-dependent manner (14), suggesting that light quality influences CSC activity. Finally, studies of Arabidopsis CesA7 phosphorylation suggest that phosphorylation within the CesA7 N terminus potentially regulates the stability of CesA7 during development (38). Although these studies corroborated that CESA phosphorylation influences CSC activity, the identities of the corresponding kinases have remained unknown.
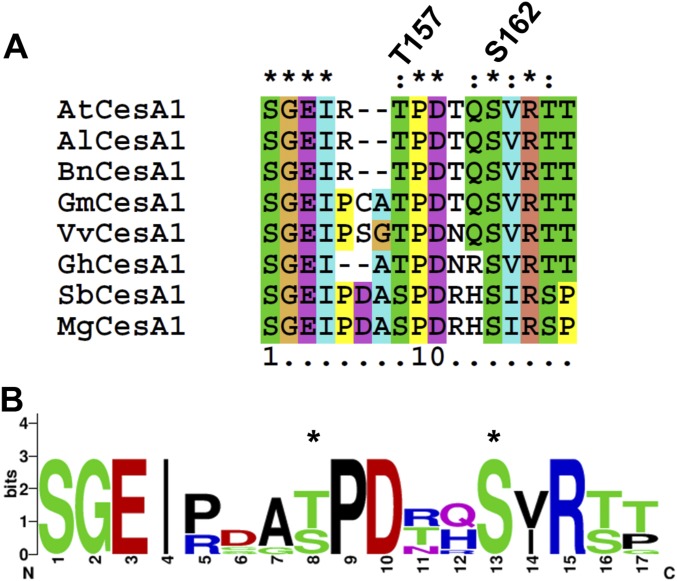
Priming phosphorylation has been described previously in metazoan and fungal systems by GSK3-like kinases (39–41). Typically, these phosphorylation events occur in the consensus phosphorylation sequence S/T-X-X-X-pS/pT-P, and this sequence is present around the T157 CESA1 in Arabidopsis and conserved across CESA1 orthologs in many plant species (Fig. S6). Although several BIN2 substrates have been identified in Arabidopsis (42–51), further analyses have revealed that these substrates associate with BIN2 in stable complexes during phosphorylation events and do not require priming phosphorylation. Hence, the CESA1 BIN2 phosphorylation represents a pioneering example of priming phosphorylation in plant systems. Nevertheless, it will be important to identify the protein kinase that catalyzes CesA1 phosphorylation at S162. Additionally, it is important to emphasize that the in vivo T157 phosphorylation event was not specifically observed by biochemical means in this study. The T157 phosphorylation site has been observed in a previous large-scale phosphoproteomic survey (52), suggesting that this phosphorylation site can be phosphorylated in vivo. It will be important in the future to develop methods that allow for the specific in vivo investigation of this and other CSC-related phosphorylation sites, but we would also highlight that genetic experiments presented here support a role of the BIN2 phosphorylated T157 site in the regulation of CSC speed and cell expansion. Such in vivo studies will help us to understand more fully the regulatory controls that influence cellulose biosynthesis.
Fig. S6.
Sequence analysis of CESA1 T157 and S162 phosphorylation site conservation. (A) Amino acid sequences of CesA1 homologs from various plants species were aligned in ClustalX2, and the amino acid sequence regions surrounding the T157 and S162 phosphorylation sites in CesA1 are presented. The residues corresponding to these positions are labeled above the alignment. (B) This alignment was used to generate a sequence logo (weblogo.berkeley.edu/logo.cgi) illustrating the conservation of each amino acid surrounding the T157 and S162 phosphorylation sites (indicated with asterisks). The number of letters at each position indicates the types of amino acids found in each position of the alignment, whereas the height of each letter indicates increasing conservation of a particular residue.
Plant growth is essentially mediated by two basic processes: cell division and cell expansion. Both phytohormones and cell wall polysaccharide biosynthesis have been demonstrated to participate in these basic developmental processes (3, 4, 13, 53, 54). For example, BR biosynthesis or signaling defects lead to decreased cell expansion, which also may be seen in cellulose biosynthesis mutants (3, 4, 9, 53, 55, 56). However, direct links between these processes have remained scarce. In this paper, we outline a mechanism by which BR signaling can modulate CSC activity, and thus plant biomass production. In the absence of BR, BIN2 is active and phosphorylates CESA1, thereby reducing CSC activity (Fig. 5). When BIN2 is inhibited, or when BR is added, BIN2 becomes inactive and degraded, the CSC is activated, and cellulose synthesis increases (Fig. 5). Our finding that BIN2 directly phosphorylates CESA1, and that this phosphorylation event changes the CSC activity, reveals a prominent protein kinase as a key regulator of cellulose synthesis and directly connects an important hormone signal transduction pathway with a fundamental process in plant growth and development.
Fig. 5.
BIN2 regulates cellulose synthesis activity in Arabidopsis. (A) Without BRs (−BL), BIN2 is phosphorylated, and thus active. (B) Under these conditions, BIN2 phosphorylates CESA1, which, in turn, changes the speed, and thus the activity, of the CSC. (C) When BL is added (+BL), BIN2 becomes dephosphorylated by BSU1, which leads to CSC activation. (D and E) BIN2 activation may be inhibited by BK (GSK3 inhibitor), which leads to reduced BIN2 activity and activation of the CSC.
Materials and Methods
Growth Conditions.
A. thaliana (Col-0) plants were germinated and grown as described by Persson et al. (22). Dark-grown seedlings were grown on Murashige and Skoog (MS) agar without sucrose in darkness at 22 °C for 7 d. For small-molecule treatments, Col-0, det2-1, and bin2-1 seedlings were grown on 1/2× MS media in the dark for 5 d. Hypocotyls were collected and placed in 1/2× MS liquid media with 10 nM brassinolide or 5 μM bikinin and incubated on a rotating table for 30 min. Treated hypocotyls were filtered to remove media, immediately frozen in liquid nitrogen, and stored at −80 °C until further use. For cellulose quantification experiments, the seed coats were removed.
Recombinant Purification of BIN2 Kinase.
The BIN2 gene was amplified by PCR from Arabidopsis inflorescence cDNA using gene-specific primers [BIN2 forward (F) and BIN2 reverse (R); Table S2] and Phusion DNA polymerase (ThermoFisher Scientific), and were cloned into the pENTR-d-TOPO vector (Life Technologies). The BIN2 ORF was transferred from pENTR-d-TOPO to the pET60-DEST plasmid (Novagen) using LR Clonase II Enzyme Mix (Life Technologies), and then transformed into E. coli BL21* cells (Life Technologies). Cell were grown at 37 °C to an OD600 of 0.6–0.8 and then induced with 0.5 mM isopropyl-β-d-thiogalactopyranoside for 4 h at 37 °C, and the cells were collected by centrifugation and stored at −80 °C until further use.
Table S2.
Oligonucleotide primers used in this study
| Primer name | Primer sequence (5′→3′) | Purpose |
| CESA1 F | caccatggaggccagtgccggcttg | CESA1 CDS cloning |
| CESA1 R | ctaaaagacacctcctttgcc | CESA1 CDS cloning |
| pCESA1 AttB4 F | ggggacaactttgtatagaaaagttgaggagaagagatggtaaagagag | CESA1 promoter cloning |
| pCESA1 AttB1r R | ggggactgcttttttgtacaaacttggcgcagccaccgacacacagag | CESA1 promoter cloning |
| CESA1 T157A F | ggagagattcgcgcgcctgatacacaa | CESA1 site-directed mutagenesis |
| CESA1 T157A R | ttgtgtatcaggcgcgcgaatctctcc | CESA1 site-directed mutagenesis |
| CESA1 T157E F | ggagagattcgcgagcctgatacacaa | CESA1 site-directed mutagenesis |
| CESA1 T157E R | ttgtgtatcaggctcgcgaatctctcc | CESA1 site-directed mutagenesis |
| BIN2 F | caccatggctgatgataaggagatg | BIN2 CDS cloning |
| BIN2 R | agttccagattgattcaagaa | BIN2 CDS cloning |
| SALK_092266 LP | ttgaaccaagttcttcgatgg | cesa1 genotyping |
| SALK_092266 RP | accttctctggctactcggag | cesa1 genotyping |
| LBb1.3 | attttgccgatttcggac | cesa1 genotyping |
| CESA1 intron 13 F | ctgaccacactgctatttact | cesa1 genotyping |
| CESA1 3’UTR R | atttggaattcccattgcgcg | cesa1 genotyping |
| Hph F | cgggtaaatagctgcgccgat | Complement construct genotyping |
| Hph R | gagtacttctacacagccatc | Complement construct genotyping |
| pCESA1 sequencer F | gcagcttgagatatcaaatag | CESA1 complement construct sequencing |
| YFP F | ccgccacaacatcgaggacgg | YFP-CESA6 genotyping |
| CESA6 R | acgtcctcgtcgccgtaagtc | YFP-CESA6 genotyping |
| BIN2 XhoI F | tgtgatcttgtcattta | bin2-1 genotyping |
| BIN2 XhoI R | tgaagaaacctcaagacc | bin2-1 genotyping |
| GAPDH F | aggtggaagagctgcttccttc | GAPDH qPCR reference amplification |
| GAPDH R | gcaacactttcccaacagcct | GAPDH qPCR reference amplification |
| IAA5 F | aagagtcaagttgtgggttggc | IAA5 qPCR amplification |
| IAA5 R | aatgcagctccatctacactcact | IAA5 qPCR amplification |
| SAUR-AC1 F | gaggattcatggcggtctatg | SAUR-AC1 qPCR amplification |
| SAUR-AC1 R | gttaagccgcccattggat | SAUR-AC1 qPCR amplification |
| CESA1 qPCR F | gagctgagatggagcggtgt | CESA1 qPCR amplification |
| CESA1 qPCR R | ctgctcgttcctccaccaat | CESA1 qPCR amplification |
| CESA3 qPCR F | ggagttgaaggtgctggttttg | CESA3 qPCR amplification |
| CESA3 qPCR R | ccaggctcatttgcgacatt | CESA3 qPCR amplification |
| CESA6 qPCR F | ggaaaattcatcgttcccgag | CESA6 qPCR amplification |
| CESA6 qPCR R | agaagagcgccatgaagagg | CESA6 qPCR amplification |
| ACTIN qPCR F | ggatttgcaggagatgatgc | ACTIN qPCR reference amplification |
| ACTIN qPCR R | tccttctggttcatcccaac | ACTIN qPCR reference amplification |
| UBC21 qPCR F | agaatgcttggagtcctgc | UBC21 qPCR reference amplification |
| UBC21 qPCR R | gaaccctctcacatcaccag | UBC21 qPCR reference amplification |
The name of each primer discussed in Materials and Methods, along with the primer sequence (all 5'→3'), and the purpose of each primer, is listed. CDS, cDNAs.
Bacterial cells were suspended in buffer A [20 mM Tris⋅HCl (pH 7.5), 300 mM NaCl, 10 mM MgCl2, and 20 mM imidazole] containing Roche EDTA-free protease inhibitors and lysed with an Avestin Emulsiflex C3 homogenizer (Avestin) at 20,000 psi. The insoluble material was removed by centrifugation at 120,000 × g for 1 h at 4 °C, and the supernatant was applied to a 1-mL nickel-nitrilotriacetic acid (Ni-NTA) agarose column equilibrated in buffer A. The column was washed with 500 mL of buffer A and eluted with 10 mL of 20 mM Tris⋅HCl (pH 7.0), 300 mM NaCl, 10 mM MgCl2, and 350 mM imidazole. The Ni-NTA eluate fraction was then applied to 0.5 mL of glutathione-Sepharose 4B (GE Healthcare) and incubated on a rocker table at 4 °C for 1 h. The resin was loaded into a column, washed with 250 mL of wash buffer, and then eluted in 8 × 1-mL fractions with buffer A containing 10 mM reduced glutathione and adjusted to pH 7.0. Purity of the purified recombinant protein was assessed by SDS/PAGE analysis.
Protein Kinase Assays.
In vitro kinase assays were conducted in 50-μL reactions containing kinase buffer [25 mM 3-(N-morpholino)propanesulfonic acid–NaOH (pH 7.0), 10 mM MgCl2, and 100 μM ATP containing 1,000 dpm/pmol γ-[32P]-ATP]. Peptide substrates were included in the assays at a concentration of 100 μM, and the assays were initiated by the addition of recombinant protein kinase. Samples were incubated at 37 °C for 30 min; then, a 25-μL aliquot was removed from each reaction, spotted on P81 phosphocellulose paper, dried for 2 min, and placed in 75 mM phosphoric acid. The filters were washed three times for 5 min in 75 mM phosphoric acid and 5 min in 95% (vol/vol) EtOH, and then dried. Incorporation of 32P was monitored by scintillation counting using a PerkinElmer TriCarb 2810TR scintillation counter.
Confocal Microscopy.
Transgenic lines expressing pCESA6::YFP-CESA6 in the prc1-1 mutant background have been described previously (6). Seedlings for image analysis were grown in the dark on MS-agar media at 22 °C for 4 d. Seedlings were imaged using a CSU-W1 spinning disk head (Yokogawa) mounted to an inverted Nikon Ti-E microscope equipped with a 100× oil-immersion objective (Apo total internal reflection fluorescence, N.A. = 1.49) and a deep-cooled iXon Ultra 888 EM-CCD camera (Andor Technology) controlled by Metamorph software. Photobleaching was achieved using an Andor FRAPPA scanning instrument attached to the system above (36). For CSC motility assays, seedlings were imaged with an 800-ms exposure every 10 s for 5–8 min.
The recorded time-lapse movies were corrected for drift and bleaching using the ImageJ (NIH) plug-ins “stackreg,” “subtract background,” and “bleach correction” with default settings. In cases of weak intensity, we further applied the “walking average” plug-in. Velocities were analyzed using the “kymograph evaluation” plug-in of the free tracking software FIESTA (57). More than 100 kymographs were analyzed per cell, and the velocities of CESAs were determined by approximating the slopes of their trajectories with a straight line.
Complementation Experiments.
To generate plant transformation vectors containing CESA1 or phosphorylation site mutants under the native CESA1 promoter, the pCESA1/pDONR P4-P1r vector, the respective CESA1 entry clone, and a Nos-terminator/pDONR P2r-P3 vector (58) were combined in the presence of the pH7m34GW multisite gateway vector (59) and LR Clonase II Plus (Invitrogen). Constructs were transformed into a heterozygous cesa1 T-DNA insertional mutant line (SALK_092266) by the standard floral dip method (60).
An Arabidopsis mutant harboring a T-DNA insertion in CESA1 exon 14 was obtained from the Arabidopsis Biological Resource Center (https://abrc.osu.edu/), and individual seedlings were genotyped by PCR using the primers SALK_092266 LP, SALK_092266 RP, and LBb1.3 shown in Table S2. As expected, no homozygous plants were obtained due to the previously described lethality of cesa1-null mutations (3, 4). To circumvent this issue, primary transformants containing the appropriate pCESA1::CESA1 cDNA construct were identified by PCR genotyping using the Hph F and Hph R primers listed in Table S2, which amplify the hygromycin resistance cassette associated with the pH7m34GW transformation vector. A second set of genotyping primers was designed to amplify selectively the genomic CESA1 sequences surrounding the SALK_092266 T-DNA insertion site (CESA1 intron 13 F and CESA1 3′UTR R; Table S2). These primers were used in conjunction with the LBb1.3 primer to identify primary pCESA1::CESA1 cDNA transformants that were heterozygous for the SALK_092266 T-DNA insertion. These plants were allowed to self-fertilize, and the progeny of subsequent generations were analyzed by PCR genotyping in a similar manner to identify plants containing a copy of the pCESA1::CESA1 cDNA complement construct as well as a homozygous T-DNA insertion in the endogenous copy of CESA1. These transgenic lines were subsequently crossed to the previously described YFP-CESA6 reporter line (6) and/or the bin2-1 mutant (9) to generate the appropriate transgenic lines. Arabidopsis mutants harboring YFP-CESA6 in the prc1-1 background were genotyped using YFP genotyping F and CESA6 genotyping R primers. Arabidopsis bin2-1 lines were genotyped using BIN2 XhoI F and BIN2 XhoI R (Table S2), and subsequent restriction digest of amplified products with XhoI was required to identify heterozygous and homozygous mutants for the bin2-1 point mutation (9).
RNA Isolation, cDNA Synthesis, and Quantitative RT-PCR.
RNA was isolated using the PureLink Plant RNA Kit according to the manufacturer’s instructions (ThermoFisher Scientific). First-strand cDNA was synthesized using the Invitrogen SuperScript III First-Strand Synthesis System according to the manufacturer’s protocol (ThermoFisher Scientific). Real-time quantitative PCR was performed using BioRad iTaq Universal SYBR Green Supermix. PCR reactions were performed on a BioRad CFX 96 Real-Time System using suggested Universal SYBR Green Supermix conditions, and data analysis was performed using Prism software (GraphPad). The following genes were used as amplification references: GLYCERALDEHYDE-3-PHOSPHATE DEHYDROGENASE (GAPDH; At1g13440; Fig. S1A), ACTIN2 (ACT2; At3g18780; Fig. S4), UBIQUITIN CONJUGATING ENZYME 21 (UBC21; At5g25760; Fig. S1B). The primer sequences for these reference genes and all transcripts assayed in this study are included in Table S2.
Cellulose Measurement.
Crystalline cellulose content was measured by previously described methods (61), with minor modifications (62). More detailed materials and methods are available in SI Materials and Methods.
SI Materials and Methods
Detailed Growth Conditions.
Arabidopsis seeds were surface-sterilized in 30% (vol/vol) sodium hypochlorite and 0.1% (wt/vol) SDS for 20 min at 25 °C, washed four times with sterile deionized water, and stratified for 48 h at 4 °C. For analysis of light-grown seedlings, the seeds were sown on MS-agar media [one-half-strength MS salts, 10 mM MES-KOH (pH 5.7), and 1% (wt/vol) phytoagar] containing 1% (wt/vol) sucrose. Plates were grown vertically at 22 °C in constant light. When necessary, 14-d-old seedlings were transplanted from MS-agar plates to soil and grown under long-day conditions (16 h of light/8 h of dark) at 22 °C.
Complementation Experiments.
The Arabidopsis CESA1 cDNA was amplified by PCR from an inflorescence cDNA library using gene-specific primers (CESA1 F and CESA1 R; Table S2) and Phusion polymerase. The resulting PCR product was cloned into pENTR-d-TOPO as described above. The CESA1 T157A and T157E mutants were generated by Quickchange mutagenesis using CESA1/pENTR-d-TOPO as a template and the mutagenesis primers (CESA1 T157A F and R or CESA1 T157E F and R) described in Table S2. A 1,100-bp promoter CESA1 promoter fragment was amplified by PCR from Arabidopsis genomic DNA using Phusion polymerase and promoter-specific primers (pCESA1 AttB4 F and pCESA1 AttB1r R; Table S2). The resulting DNA fragment was gel-purified as described previously and cloned into the pDONR P4-P1r multisite gateway DONR vector using BP clonase II (Invitrogen) according to the manufacturer’s instructions. The sequences of CESA constructs were verified by DNA sequencing using the pCESA1 sequencer primer described in Table S2. After the vectors were sequenced, they were transformed into Agrobacterium tumefaciens GV3101 and subsequently transformed into a heterozygous cesa1 T-DNA insertional mutant line (SALK_092266, described below) by the standard floral dip method (60). Primary transformants were identified by selection on MS-agar media supplemented with 25 μg/mL hygromycin B and 50 μg/mL cefotaxime.
Cellulose Measurement.
Crystalline cellulose content was measured by previously described methods (61), with minor modifications. Briefly, 5-d-old dark-grown Arabidopsis seedlings of the indicated genotype were transferred to a 2-mL screw-cap Sarstedt tube and serially washed two times with 70% (vol/vol) ethanol and once with 1:1 chloroform/methanol for 6 h on a rocker table at 25 °C. The final incubation liquid was removed, and seedlings were ball-milled in a Retsch Mill for 2 min at 25 Hz after the addition of three steel balls. The ball-milled material was dried and weighed. Ten milligrams of material was transferred to a new tube. This material was incubated in the presence of 1 mL of Updegraff reagent [80% (vol/vol) acetic acid and 10% (vol/vol) nitric acid] for 30 min at 100 °C. The remaining insoluble material was recovered by centrifugation at 10,000 × g for 10 min, and the supernatant was discarded. The pellet was sequentially washed with 1.5 mL of water, followed by 3 × 1.5 mL of acetone. After each wash, the pellet was recovered by centrifugation at 10,000 × g for 10 min. After the final acetone wash, the pellet was dried overnight. The pellet was resuspended in 175 μL of 72% (vol/vol) sulfuric acid and incubated at 25 °C for 30 min with occasional vortexing. Water (825 μL) was added to the tube, followed by centrifugation at 10,000 × g for 10 min. Various amounts of supernatant were assayed for glucose content by the anthrone assay, using free glucose as a standard. Glucose contents were standardized to total alcohol insoluble residue weight and reported as a percentage of the wild-type untreated crystalline cellulose content.
For Saeman hydrolysis assays, 7-d-old seedlings were extracted with 70% (vol/vol) ethanol and 1:1 chloroform/methanol as well as being ball-milled as described above. Ball-milled tissue masses were recorded, and 2 mg of tissue samples was subjected to Saeman hydrolysis. Ten micrograms of inositol was added to each sample, followed by concentrated sulfuric acid to a final concentration of 72% (vol/vol). Samples were incubated for 1 h at 25°C with intermittent vortexing. Sulfuric acid was diluted to 1 M by the addition of 690 μL of water, and the samples were incubated at 100 °C for 3 h. After this incubation, the samples were cooled on ice and 1 mL of neutralization solution [20% (vol/vol) dioctlyamine in chloroform] was added. The samples were vortexed and centrifuged at 300 × g in capped glass test tubes. The lower chloroform layer was removed, and 1 mL of neutralization solution was added. This wash and centrifugation process was repeated a total of four times, and the pH of the aqueous phase was evaluated with pH paper until the aqueous phase exhibited a neutral pH. Excess amine was removed by washing the aqueous fraction with 4 mL of chloroform. One hundred microliters of the resulting aqueous supernatant was transferred to a new capped glass test tube and evaporated to dryness under a stream of nitrogen. The resulting monosaccharides were reduced, acetylated, and analyzed by gas chromatography as previously described (62).
Phosphorylation Site Sequence Analysis.
The amino acid sequence of Arabidopsis CESA1 (At4g32410) was used as a BLAST search query to identify CESA1 homologs in Brassica napus (CDX72357), Oryza sativa (XP_015639380), Arabidopsis lyrata (XP_002867245), Glycine max (XP_003522623), Zea mays (AFW81388), Sorghum bicolor (XP_002440694), Gossypium hirsutum (XP_016750013), and Miscanthus giganteus (ALB78129). The full-length amino acid sequences were aligned using ClustalX2, and trimmed using BioEdit. The trimmed sequence alignment was used to construct a sequence logo of amino acids surrounding the BIN2 phosphorylation site using WebLogo (weblogo.berkeley.edu/logo.cgi).
Acknowledgments
We thank Dr. Christopher Kesten and Dr. Edwin Lampugnani for experimental assistance and critical evaluation of this manuscript. C.S.-R. and S.P. were financially supported by the Max-Planck Gesellschaft. S.P. was supported by a R@MAP Professorship at the University of Melbourne. K.K. and I.S.W. are supported by startup funds from the Biochemistry and Molecular Biology Department at the University of Nevada, Reno as well as the National Science Foundation (Grant IOS 1449068) and a Nevada Agricultural Experiment Station Award (NEV00382). Support was also received from the Energy Biosciences Institute at the University of California, Berkeley and the Philomathia Foundation.
Footnotes
The authors declare no conflict of interest.
This article contains supporting information online at www.pnas.org/lookup/suppl/doi:10.1073/pnas.1615005114/-/DCSupplemental.
References
- 1.Somerville C, et al. Toward a systems approach to understanding plant cell walls. Science. 2004;306(5705):2206–2211. doi: 10.1126/science.1102765. [DOI] [PubMed] [Google Scholar]
- 2.Schneider R, Hanak T, Persson S, Voigt CA. Cellulose and callose synthesis and organization in focus, what’s new? Curr Opin Plant Biol. 2016;34:9–16. doi: 10.1016/j.pbi.2016.07.007. [DOI] [PubMed] [Google Scholar]
- 3.Desprez T, et al. Organization of cellulose synthase complexes involved in primary cell wall synthesis in Arabidopsis thaliana. Proc Natl Acad Sci USA. 2007;104(39):15572–15577. doi: 10.1073/pnas.0706569104. [DOI] [PMC free article] [PubMed] [Google Scholar]
- 4.Persson S, et al. Genetic evidence for three unique components in primary cell-wall cellulose synthase complexes in Arabidopsis. Proc Natl Acad Sci USA. 2007;104(39):15566–15571. doi: 10.1073/pnas.0706592104. [DOI] [PMC free article] [PubMed] [Google Scholar]
- 5.Diotallevi F, Mulder B. The cellulose synthase complex: A polymerization driven supramolecular motor. Biophys J. 2007;92(8):2666–2673. doi: 10.1529/biophysj.106.099473. [DOI] [PMC free article] [PubMed] [Google Scholar]
- 6.Paredez AR, Somerville CR, Ehrhardt DW. Visualization of cellulose synthase demonstrates functional association with microtubules. Science. 2006;312(5779):1491–1495. doi: 10.1126/science.1126551. [DOI] [PubMed] [Google Scholar]
- 7.Kim TW, Wang ZY. Brassinosteroid signal transduction from receptor kinases to transcription factors. Annu Rev Plant Biol. 2010;61:681–704. doi: 10.1146/annurev.arplant.043008.092057. [DOI] [PubMed] [Google Scholar]
- 8.Wang ZY, Bai MY, Oh E, Zhu JY. Brassinosteroid signaling network and regulation of photomorphogenesis. Annu Rev Genet. 2012;46:701–724. doi: 10.1146/annurev-genet-102209-163450. [DOI] [PubMed] [Google Scholar]
- 9.Li J, Nam KH. Regulation of brassinosteroid signaling by a GSK3/SHAGGY-like kinase. Science. 2002;295(5558):1299–1301. doi: 10.1126/science.1065769. [DOI] [PubMed] [Google Scholar]
- 10.He JX, Gendron JM, Yang Y, Li J, Wang ZY. The GSK3-like kinase BIN2 phosphorylates and destabilizes BZR1, a positive regulator of the brassinosteroid signaling pathway in Arabidopsis. Proc Natl Acad Sci USA. 2002;99(15):10185–10190. doi: 10.1073/pnas.152342599. [DOI] [PMC free article] [PubMed] [Google Scholar]
- 11.Wang ZY, et al. Nuclear-localized BZR1 mediates brassinosteroid-induced growth and feedback suppression of brassinosteroid biosynthesis. Dev Cell. 2002;2(4):505–513. doi: 10.1016/s1534-5807(02)00153-3. [DOI] [PubMed] [Google Scholar]
- 12.Peng P, Yan Z, Zhu Y, Li J. Regulation of the Arabidopsis GSK3-like kinase BRASSINOSTEROID-INSENSITIVE 2 through proteasome-mediated protein degradation. Mol Plant. 2008;1(2):338–346. doi: 10.1093/mp/ssn001. [DOI] [PMC free article] [PubMed] [Google Scholar]
- 13.Sánchez-Rodríguez C, Rubio-Somoza I, Sibout R, Persson S. Phytohormones and the cell wall in Arabidopsis during seedling growth. Trends Plant Sci. 2010;15(5):291–301. doi: 10.1016/j.tplants.2010.03.002. [DOI] [PubMed] [Google Scholar]
- 14.Bischoff V, et al. Phytochrome regulation of cellulose synthesis in Arabidopsis. Curr Biol. 2011;21(21):1822–1827. doi: 10.1016/j.cub.2011.09.026. [DOI] [PubMed] [Google Scholar]
- 15.Xie L, Yang C, Wang X. Brassinosteroids can regulate cellulose biosynthesis by controlling the expression of CESA genes in Arabidopsis. J Exp Bot. 2011;62(13):4495–4506. doi: 10.1093/jxb/err164. [DOI] [PMC free article] [PubMed] [Google Scholar]
- 16.Li J, Nagpal P, Vitart V, McMorris TC, Chory J. A role for brassinosteroids in light-dependent development of Arabidopsis. Science. 1996;272(5260):398–401. doi: 10.1126/science.272.5260.398. [DOI] [PubMed] [Google Scholar]
- 17.De Rybel B, et al. Chemical inhibition of a subset of Arabidopsis thaliana GSK3-like kinases activates brassinosteroid signaling. Chem Biol. 2009;16(6):594–604. doi: 10.1016/j.chembiol.2009.04.008. [DOI] [PMC free article] [PubMed] [Google Scholar]
- 18.DeBolt S, Gutierrez R, Ehrhardt DW, Somerville C. Nonmotile cellulose synthase subunits repeatedly accumulate within localized regions at the plasma membrane in Arabidopsis hypocotyl cells following 2,6-dichlorobenzonitrile treatment. Plant Physiol. 2007;145(2):334–338. doi: 10.1104/pp.107.104703. [DOI] [PMC free article] [PubMed] [Google Scholar]
- 19.Gutierrez R, Lindeboom JJ, Paredez AR, Emons AM, Ehrhardt DW. Arabidopsis cortical microtubules position cellulose synthase delivery to the plasma membrane and interact with cellulose synthase trafficking compartments. Nat Cell Biol. 2009;11(7):797–806. doi: 10.1038/ncb1886. [DOI] [PubMed] [Google Scholar]
- 20.Gu Y, et al. Identification of a cellulose synthase-associated protein required for cellulose biosynthesis. Proc Natl Acad Sci USA. 2010;107(29):12866–12871. doi: 10.1073/pnas.1007092107. [DOI] [PMC free article] [PubMed] [Google Scholar]
- 21.Bringmann M, et al. POM-POM2/cellulose synthase interacting1 is essential for the functional association of cellulose synthase and microtubules in Arabidopsis. Plant Cell. 2012;24(1):163–177. doi: 10.1105/tpc.111.093575. [DOI] [PMC free article] [PubMed] [Google Scholar]
- 22.Persson S, Wei H, Milne J, Page GP, Somerville CR. Identification of genes required for cellulose synthesis by regression analysis of public microarray data sets. Proc Natl Acad Sci USA. 2005;102(24):8633–8638. doi: 10.1073/pnas.0503392102. [DOI] [PMC free article] [PubMed] [Google Scholar]
- 23.Ruprecht C, et al. FamNet: A framework to identify multiplied modules driving pathway expansion in plants. Plant Physiol. 2016;170(3):1878–1894. doi: 10.1104/pp.15.01281. [DOI] [PMC free article] [PubMed] [Google Scholar]
- 24.Vain T, et al. The cellulase KORRIGAN is part of the cellulose synthase complex. Plant Physiol. 2014;165(4):1521–1532. doi: 10.1104/pp.114.241216. [DOI] [PMC free article] [PubMed] [Google Scholar]
- 25.Mansoori N, et al. KORRIGAN1 interacts specifically with integral components of the cellulose synthase machinery. PLoS One. 2014;9(11):e112387. doi: 10.1371/journal.pone.0112387. [DOI] [PMC free article] [PubMed] [Google Scholar]
- 26.Roudier F, et al. COBRA, an Arabidopsis extracellular glycosyl-phosphatidyl inositol-anchored protein, specifically controls highly anisotropic expansion through its involvement in cellulose microfibril orientation. Plant Cell. 2005;17(6):1749–1763. doi: 10.1105/tpc.105.031732. [DOI] [PMC free article] [PubMed] [Google Scholar]
- 27.Liu L, et al. Brittle Culm1, a COBRA-like protein, functions in cellulose assembly through binding cellulose microfibrils. PLoS Genet. 2013;9(8):e1003704. doi: 10.1371/journal.pgen.1003704. [DOI] [PMC free article] [PubMed] [Google Scholar]
- 28.Endler A, et al. A mechanism for sustained cellulose synthesis during salt stress. Cell. 2015;162(6):1353–1364. doi: 10.1016/j.cell.2015.08.028. [DOI] [PubMed] [Google Scholar]
- 29.Nühse TS, Stensballe A, Jensen ON, Peck SC. Phosphoproteomics of the Arabidopsis plasma membrane and a new phosphorylation site database. Plant Cell. 2004;16(9):2394–2405. doi: 10.1105/tpc.104.023150. [DOI] [PMC free article] [PubMed] [Google Scholar]
- 30.Nühse TS, Bottrill AR, Jones AM, Peck SC. Quantitative phosphoproteomic analysis of plasma membrane proteins reveals regulatory mechanisms of plant innate immune responses. Plant J. 2007;51(5):931–940. doi: 10.1111/j.1365-313X.2007.03192.x. [DOI] [PMC free article] [PubMed] [Google Scholar]
- 31.Nakagami H, et al. Large-scale comparative phosphoproteomics identifies conserved phosphorylation sites in plants. Plant Physiol. 2010;153(3):1161–1174. doi: 10.1104/pp.110.157347. [DOI] [PMC free article] [PubMed] [Google Scholar]
- 32.Jones DM, et al. The emerging role of protein phosphorylation as a critical regulatory mechanism controlling cellulose biosynthesis. Front Plant Sci. 2016;7:684. doi: 10.3389/fpls.2016.00684. [DOI] [PMC free article] [PubMed] [Google Scholar]
- 33.Chen S, Ehrhardt DW, Somerville CR. Mutations of cellulose synthase (CESA1) phosphorylation sites modulate anisotropic cell expansion and bidirectional mobility of cellulose synthase. Proc Natl Acad Sci USA. 2010;107(40):17188–17193. doi: 10.1073/pnas.1012348107. [DOI] [PMC free article] [PubMed] [Google Scholar]
- 34.Chen S, et al. Anisotropic cell expansion is affected through the bidirectional mobility of cellulose synthase complexes and phosphorylation at two critical residues on CESA3. Plant Physiol. 2016;171(1):242–250. doi: 10.1104/pp.15.01874. [DOI] [PMC free article] [PubMed] [Google Scholar]
- 35.Chu B, Soncin F, Price BD, Stevenson MA, Calderwood SK. Sequential phosphorylation by mitogen-activated protein kinase and glycogen synthase kinase 3 represses transcriptional activation by heat shock factor-1. J Biol Chem. 1996;271(48):30847–30857. doi: 10.1074/jbc.271.48.30847. [DOI] [PubMed] [Google Scholar]
- 36.Luo Y, et al. V-ATPase activity in the TGN/EE is required for exocytosis and recycling in Arabidopsis. Nat Plants. 2015;1:15094. doi: 10.1038/nplants.2015.94. [DOI] [PMC free article] [PubMed] [Google Scholar]
- 37.Facette MR, Shen Z, Björnsdóttir FR, Briggs SP, Smith LG. Parallel proteomic and phosphoproteomic analyses of successive stages of maize leaf development. Plant Cell. 2013;25(8):2798–2812. doi: 10.1105/tpc.113.112227. [DOI] [PMC free article] [PubMed] [Google Scholar]
- 38.Taylor NG. Identification of cellulose synthase AtCesA7 (IRX3) in vivo phosphorylation sites--a potential role in regulating protein degradation. Plant Mol Biol. 2007;64(1-2):161–171. doi: 10.1007/s11103-007-9142-2. [DOI] [PubMed] [Google Scholar]
- 39.Millet C, et al. A negative feedback control of transforming growth factor-beta signaling by glycogen synthase kinase 3-mediated Smad3 linker phosphorylation at Ser-204. J Biol Chem. 2009;284(30):19808–19816. doi: 10.1074/jbc.M109.016667. [DOI] [PMC free article] [PubMed] [Google Scholar]
- 40.Takeo S, et al. Shaggy/glycogen synthase kinase 3β and phosphorylation of Sarah/regulator of calcineurin are essential for completion of Drosophila female meiosis. Proc Natl Acad Sci USA. 2012;109(17):6382–6389. doi: 10.1073/pnas.1120367109. [DOI] [PMC free article] [PubMed] [Google Scholar]
- 41.Al-Zain A, Schroeder L, Sheglov A, Ikui AE. Cdc6 degradation requires phosphodegron created by GSK-3 and Cdk1 for SCFCdc4 recognition in Saccharomyces cerevisiae. Mol Biol Cell. 2015;26(14):2609–2619. doi: 10.1091/mbc.E14-07-1213. [DOI] [PMC free article] [PubMed] [Google Scholar]
- 42.Peng P, Zhao J, Zhu Y, Asami T, Li J. A direct docking mechanism for a plant GSK3-like kinase to phosphorylate its substrates. J Biol Chem. 2010;285(32):24646–24653. doi: 10.1074/jbc.M110.142547. [DOI] [PMC free article] [PubMed] [Google Scholar]
- 43.Kim TW, Michniewicz M, Bergmann DC, Wang ZY. Brassinosteroid regulates stomatal development by GSK3-mediated inhibition of a MAPK pathway. Nature. 2012;482(7385):419–422. doi: 10.1038/nature10794. [DOI] [PMC free article] [PubMed] [Google Scholar]
- 44.Gudesblat GE, et al. SPEECHLESS integrates brassinosteroid and stomata signalling pathways. Nat Cell Biol. 2012;14(5):548–554. doi: 10.1038/ncb2471. [DOI] [PubMed] [Google Scholar]
- 45.Tong H, et al. DWARF AND LOW-TILLERING acts as a direct downstream target of a GSK3/SHAGGY-like kinase to mediate brassinosteroid responses in rice. Plant Cell. 2012;24(6):2562–2577. doi: 10.1105/tpc.112.097394. [DOI] [PMC free article] [PubMed] [Google Scholar]
- 46.Ye H, Li L, Guo H, Yin Y. MYBL2 is a substrate of GSK3-like kinase BIN2 and acts as a corepressor of BES1 in brassinosteroid signaling pathway in Arabidopsis. Proc Natl Acad Sci USA. 2012;109(49):20142–20147. doi: 10.1073/pnas.1205232109. [DOI] [PMC free article] [PubMed] [Google Scholar]
- 47.Zhang D, et al. Transcription factor HAT1 is phosphorylated by BIN2 kinase and mediates brassinosteroid repressed gene expression in Arabidopsis. Plant J. 2014;77(1):59–70. doi: 10.1111/tpj.12368. [DOI] [PubMed] [Google Scholar]
- 48.Cho H, et al. A secreted peptide acts on BIN2-mediated phosphorylation of ARFs to potentiate auxin response during lateral root development. Nat Cell Biol. 2014;16(1):66–76. doi: 10.1038/ncb2893. [DOI] [PubMed] [Google Scholar]
- 49.Cai Z, et al. GSK3-like kinases positively modulate abscisic acid signaling through phosphorylating subgroup III SnRK2s in Arabidopsis. Proc Natl Acad Sci USA. 2014;111(26):9651–9656. doi: 10.1073/pnas.1316717111. [DOI] [PMC free article] [PubMed] [Google Scholar]
- 50.Bernardo-García S, et al. BR-dependent phosphorylation modulates PIF4 transcriptional activity and shapes diurnal hypocotyl growth. Genes Dev. 2014;28(15):1681–1694. doi: 10.1101/gad.243675.114. [DOI] [PMC free article] [PubMed] [Google Scholar]
- 51.Hu Y, Yu D. BRASSINOSTEROID INSENSITIVE2 interacts with ABSCISIC ACID INSENSITIVE5 to mediate the antagonism of brassinosteroids to abscisic acid during seed germination in Arabidopsis. Plant Cell. 2014;26(11):4394–4408. doi: 10.1105/tpc.114.130849. [DOI] [PMC free article] [PubMed] [Google Scholar]
- 52.Mattei B, Spinelli F, Pontiggia D, De Lorenzo G. Comprehensive analysis of the membrane phosphoproteome regulated by oligogalacturonides in Arabidopsis thaliana. Front Plant Sci. 2016;7:1107. doi: 10.3389/fpls.2016.01107. [DOI] [PMC free article] [PubMed] [Google Scholar]
- 53.Arioli T, et al. Molecular analysis of cellulose biosynthesis in Arabidopsis. Science. 1998;279(5351):717–720. doi: 10.1126/science.279.5351.717. [DOI] [PubMed] [Google Scholar]
- 54.Miart F, et al. Spatio-temporal analysis of cellulose synthesis during cell plate formation in Arabidopsis. Plant J. 2014;77(1):71–84. doi: 10.1111/tpj.12362. [DOI] [PubMed] [Google Scholar]
- 55.Li J, Chory J. A putative leucine-rich repeat receptor kinase involved in brassinosteroid signal transduction. Cell. 1997;90(5):929–938. doi: 10.1016/s0092-8674(00)80357-8. [DOI] [PubMed] [Google Scholar]
- 56.Clouse SD, Langford M, McMorris TC. A brassinosteroid-insensitive mutant in Arabidopsis thaliana exhibits multiple defects in growth and development. Plant Physiol. 1996;111(3):671–678. doi: 10.1104/pp.111.3.671. [DOI] [PMC free article] [PubMed] [Google Scholar]
- 57.Ruhnow F, Zwicker D, Diez S. Tracking single particles and elongated filaments with nanometer precision. Biophys J. 2011;100(11):2820–2828. doi: 10.1016/j.bpj.2011.04.023. [DOI] [PMC free article] [PubMed] [Google Scholar]
- 58.Karimi M, Depicker A, Hilson P. Recombinational cloning with plant gateway vectors. Plant Physiol. 2007;145(4):1144–1154. doi: 10.1104/pp.107.106989. [DOI] [PMC free article] [PubMed] [Google Scholar]
- 59.Karimi M, De Meyer B, Hilson P. Modular cloning in plant cells. Trends Plant Sci. 2005;10(3):103–105. doi: 10.1016/j.tplants.2005.01.008. [DOI] [PubMed] [Google Scholar]
- 60.Clough SJ, Bent AF. Floral dip: A simplified method for Agrobacterium-mediated transformation of Arabidopsis thaliana. Plant J. 1998;16(6):735–743. doi: 10.1046/j.1365-313x.1998.00343.x. [DOI] [PubMed] [Google Scholar]
- 61.Updegraff DM. Semimicro determination of cellulose in biological materials. Anal Biochem. 1969;32(3):420–424. doi: 10.1016/s0003-2697(69)80009-6. [DOI] [PubMed] [Google Scholar]
- 62.Villalobos JA, Yi BR, Wallace IS. 2-Fluoro-L-fucose is a metabolically incorporated inhibitor of plant cell wall polysaccharide fucosylation. PLoS One. 2015;10(9):e0139091. doi: 10.1371/journal.pone.0139091. [DOI] [PMC free article] [PubMed] [Google Scholar]


