Significance
Heme is a critical source of iron for Pseudomonas aeruginosa on infection of the host. The flux of heme into the cell is driven by the catalytic action of heme oxygenase (HemO) and regulated by the heme binding protein (PhuS). Despite advances in structural characterization of bacterial heme uptake proteins, the mechanism of heme transfer is poorly defined. In this study, we determined structural elements within PhuS that undergo conformational rearrangement on heme binding and further show that allosteric linkage between the N- and C-terminal domains of PhuS is critical for triggering heme release to HemO. These studies provide a first step in defining the role of protein conformation and allosteric contributions in heme transfer within bacterial heme uptake systems.
Keywords: heme binding, allostery, protein–protein interaction, Pseudomonas aeruginosa, heme transfer
Abstract
A heme-dependent conformational rearrangement of the C-terminal domain of heme binding protein (PhuS) is required for interaction with the iron-regulated heme oxygenase (HemO). Herein, we further investigate the underlying mechanism of this conformational rearrangement and its implications for heme transfer via site-directed mutagenesis, resonance Raman (RR), hydrogen–deuterium exchange MS (HDX-MS) methods, and molecular dynamics (MD). HDX-MS revealed that the apo-PhuS C-terminal α6/α7/α8-helices are largely unstructured, whereas the apo-PhuS H212R variant showed an increase in structure within these regions. The increased rate of heme association with apo-PhuS H212R compared with the WT and lack of a detectable five-coordinate high-spin (5cHS) heme intermediate are consistent with a more folded and less dynamic C-terminal domain. HDX-MS and MD of holo-PhuS indicate an overall reduction in molecular flexibility throughout the protein, with significant structural rearrangement and protection of the heme binding pocket. We observed slow cooperative unfolding/folding events within the C-terminal helices of holo-PhuS and the N-terminal α1/α2-helices that are dampened or eliminated in the holo-PhuS H212R variant. Chemical cross-linking and MALDI-TOF MS mapped these same regions to the PhuS:HemO protein–protein interface. We previously proposed that the protein–protein interaction induces conformational rearrangement, promoting a ligand switch from His-209 to His-212 and triggering heme release to HemO. The reduced conformational freedom of holo-PhuS H212R combined with the increase in entropy and decrease in heme transfer on interaction with HemO further support this model. This study provides significant insight into the role of protein dynamics in heme binding and release in bacterial heme transport proteins.
Iron is an essential micronutrient required for the survival and virulence of most bacterial pathogens. Furthermore, iron sequestration by the host’s defense systems drives the diversity of iron acquisition mechanisms deployed by pathogens (1). To combat iron limitations, many pathogens use several iron acquisition strategies, including utilization of host heme-containing proteins (2). The opportunistic pathogen Pseudomonas aeruginosa encodes two distinct heme uptake systems: the Pseudomonas heme uptake (phu) and the heme assimilation system (has) (3). We have recently shown the Has and Phu systems perform nonredundant roles in the sensing and transport of heme, respectively (4). The Phu system comprises a TonB-dependent outer membrane receptor (PhuR) and a soluble heme binding protein (PhuT) that acts as the receptor for an ATP-dependent permease (ABC transporter), which then translocates heme to the cytoplasm. In the cytoplasm, the cytoplasmic heme binding protein (PhuS) sequesters and chaperones heme to the iron-regulated heme oxygenase (HemO) (5, 6). In the cytoplasm, heme is oxidatively cleaved by HemO to biliverdin IXδ (BVIXδ) and BVIXβ with the release of iron and CO (7). It was recently determined that the Phu system is the primary iron acquisition system in P. aeruginosa chronic infection of the cystic fibrosis lung and up-regulated coincident with a decrease in the levels of the major secreted siderophore pyoverdine (8, 9). This increase is in large part caused by point mutations within the promoter region of the phu operon leading to increased expression of PhuR (8). Therefore, understanding the molecular mechanisms by which P. aeruginosa acquires and uses heme may provide a therapeutic strategy in the treatment of P. aeruginosa chronic infections.
Previous studies from our laboratory have shown the interaction of PhuS with HemO is driven by a conformational change on ligand binding (6, 10). Furthermore, the previously reported kinetics of heme transfer from PhuS to HemO are slow: on the second timescale at 34 °C (11). Based on these data, we proposed that a His-ligand switch from His-209 to His-212 within holo-PhuS occurs before heme transfer to HemO. In this report, we further show that (i) heme binding to the C-terminal proximal α6/α7/α8-helices (residues 207–233) drives a conformational change required for protein–protein interaction, (ii) cooperative folding and unfolding events in the N- and C-terminal domains at the protein–protein interface trigger heme release to HemO, and (iii) these studies support a heme translocation pathway or “exit from the side” mechanism that requires a ligand switch from His-209 to His-212 before release of heme to HemO.
Results
Conformational Rearrangement on Heme Binding to PhuS.
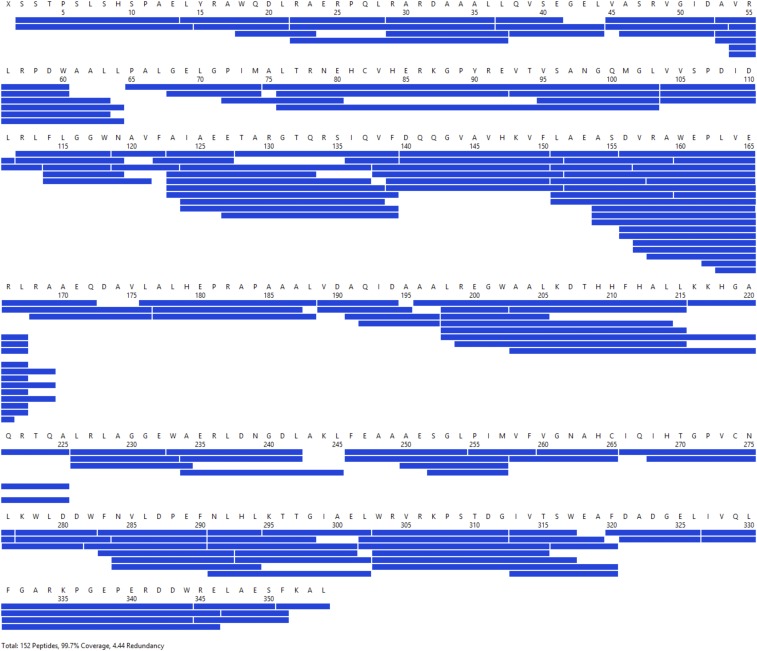
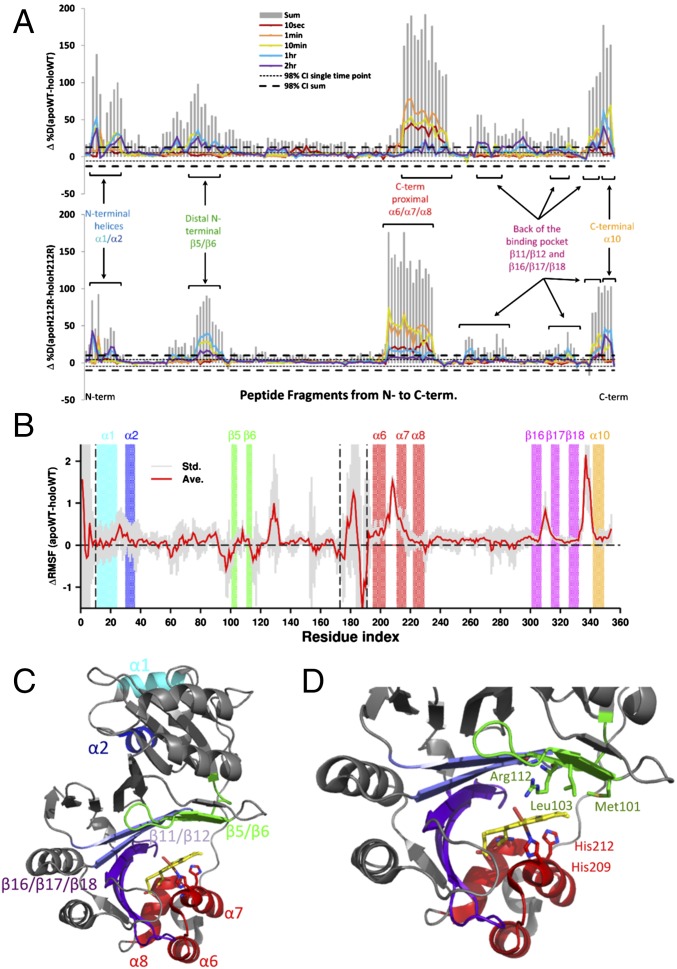
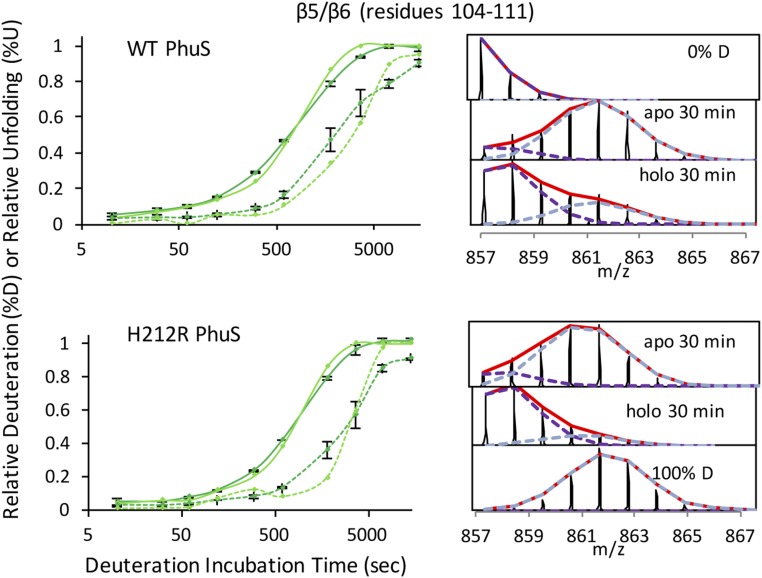
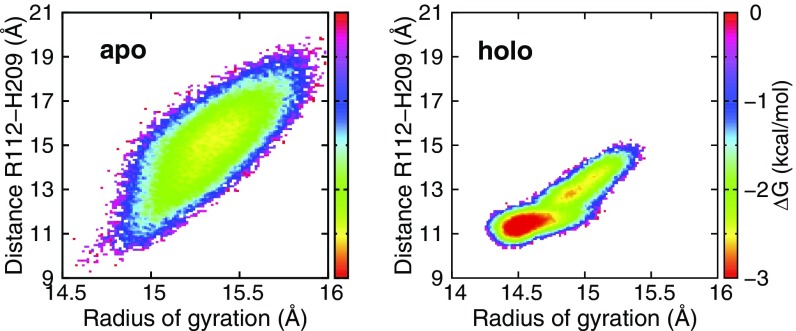
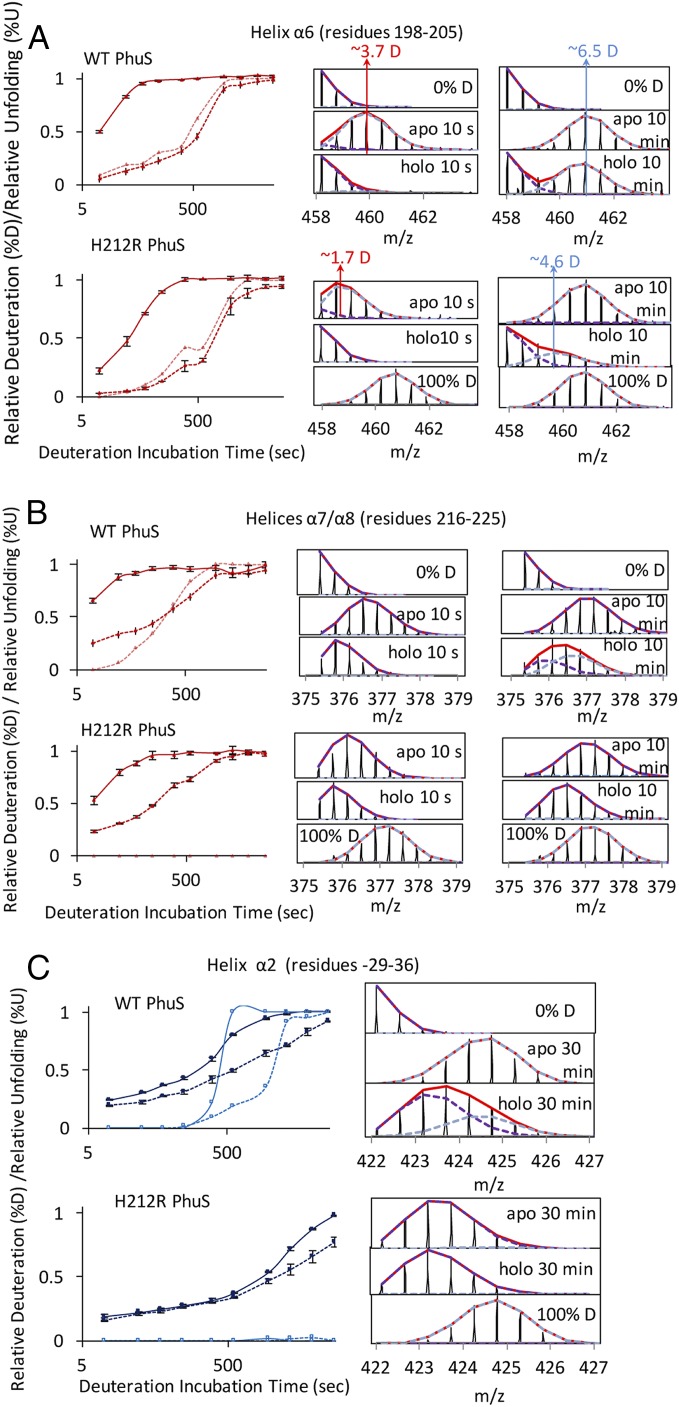
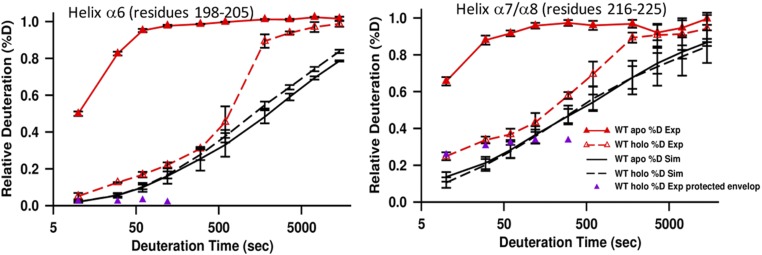
Comparison of deuterium uptake between apo- and holo-PhuS was monitored after dilution into D2O. Samples were removed at various time points, and the exchange was quenched. Regions of the protein that undergo extensive exchange at the earliest time points reflect regions that are exposed to solvent and intrinsically unstructured or regions undergoing rapid equilibrium favoring the unstructured form. In contrast, exchange times on the scale of minutes to hours are more indicative of the flexibility of the secondary and tertiary structures of the protein. The peptide fragments provided 99% coverage for both the WT and H212R PhuS apo and holo forms (Fig. S1). Global examination at all time points for deuterium exchange in apo- vs. holo-PhuS shows significant protection on heme binding, indicative of an overall decrease in the flexibility and dynamics of the protein (gray bars in Fig. 1A). The PhuS heme binding site is between the proximal C-terminal helices (α6/α7/α8), the distal N-terminal domain β-sheets (β5–β6), and β-sheets (β16/β17/β18) on the backside of the pocket (Fig. 1 C and D). Hydrogen–deuterium exchange MS (HDX-MS) methods and molecular dynamics (MD) studies comparing the apo and holo forms of WT PhuS point to structural and conformational effects of heme binding on these structural elements. HDX-MS reveals particularly strong losses in deuterium incorporation for all three structural motifs, including those that are involved in secondary structure in both the apo and holo crystal structures (Fig. 1A). Consistent with HDX-MS, MD shows a decrease in fluctuation of two of these three structural motifs in the holo form as evidenced by the decrease in the rms fluctuation (Fig. 1B). In particular, the loop regions between the C-terminal helices α6 and α7, between the β-sheets β16 and β17, and between β18 and α10 on the backside of the pocket show the greatest loss in fluctuations. The lack of difference in fluctuation in the helices and β-sheets of these motifs can be attributed to the significantly shorter simulation timescale (500 ns) compared with that of HDX-MS and the limitation of the current force field (energy function) that tends to overstabilize secondary structure elements. Additionally, in contrast to HDX-MS, the MD data suggest that the third structural motifs, the distal N-terminal domain β-sheets (β5–β6), are not affected by heme binding. Additional analysis of the extent of deuteration over time for β-sheets β5 and β6 reveals comparable levels of protection in the early time points for both apo- and holo-PhuS (Fig. S2). However, EX1 kinetics are observed within the first 10 min in apo-PhuS and are clearly slowed in holo-PhuS (∼1 h), indicating an increased stability in these secondary structures on ligand binding (Fig. S2). Such kinetics are usually indicative of slow conformational changes that are outside of the timescale probed by MD. In the crystal structure of holo-PhuS, Leu-103 and Phe-114 of the β-sheets (β5–β6) engage in nonpolar contacts with the heme, whereas Arg-112 is hydrogen-bonded through its guanidinium group to a distal solvent molecule coordinated to the heme iron (Fig. 1D) (12). Interestingly, although secondary structures remained stable in MD simulations of apo- and holo-PhuS, the heme binding cleft of apo-PhuS exhibited significant breathing motion, whereas it remained closed in holo-PhuS. To characterize the binding cleft dynamics, the free energy surface with respect to the radius of gyration of the heme binding cleft (Rg) and the Cα distance between Arg-112 and His-209 (DR112-H209) was calculated from the MD trajectories (Fig. S3). Rg represents the volume of the binding cleft, and Arg-112 and His-209 are two conserved residues above and below the heme, respectively. Remarkably, the free energy minimum for apo-PhuS is located at Rg of 15.4 Å and DR112-H209 of 15 Å, whereas the minimum for holo-PhuS remains at the position close to the crystal structure (Rg of 14.5 Å and DR112-H209 of 11 Å). These data indicate that heme binding rigidifies the initially open and flexible binding cleft to adopt the closed conformation seen in the crystal structure. In solution, the full extent of opening and flexibility of the binding cleft in apo-PhuS is further revealed by a more detailed analysis of the HDX-MS. At the earliest time point probed (10 s), peptides comprising the C-terminal proximal helices α6/α7/α8 display deuterium exchange levels greater than 50% (>80% within 1 min), indicating that the proximal heme binding helices are largely unstructured (solid lines in Fig. 2 A, Upper and B, Upper). On heme binding, significant protection within the C-terminal helices is observed within 10 s, indicating that heme binding drives a large structural and conformational rearrangement of the C-terminal domain (dashed red lines in Fig. 2 A, Upper and B, Upper). These data are consistent with previous solution studies showing that heme binding shifts the sedimentation coefficient distribution for holo-PhuS and further protects the C-terminal domain from proteolysis (10). Interestingly, the HDX-MS data are not consistent with the recent apo-PhuS crystal structures, where the overall structural fold is almost identical to that of holo-PhuS, suggesting that the apo-PhuS crystal structures are more representative of the ligand-bound state (12, 13). The latter is supported by MD-based calculations of deuterium uptake. Indeed, for all peptides spanning the C-terminal helices, the calculated deuterium uptakes of apo and holo forms are identical and display uptake traces that are largely similar to the experimental deuterium uptake curves of the holo-PhuS (Fig. S4). Taken together, the MD and HDX-MS data support our previous “induced fit” hypothesis that heme binding drives conformational rearrangement of the C-terminal domain and subsequent ligand coordination.
Fig. S1.
HDX-MS peptide coverage map for PhuS resulting from pepsin digestion and peptide identification as described in Experimental Procedures and SI Experimental Procedures.
Fig. 1.
(A) Difference plot of percentage deuteration (Δ%D) apo- minus holo-PhuS for (Upper) the WT and (Lower) H212R mutant. Individual peptides are plotted on the x axis from N to C terminus based on the first residue number. For each peptide, differences in percentage deuteration at the various deuterium incubation times are color-coded according to the legend, and the sums of all differences integrated over all incubation time points are represented in gray bars. Respective 98% confidence intervals (98% CIs) are represented as horizontal dashed lines. (B) Differences in Cα atom rms fluctuations (ΔRMSFs) between WT apo and holo simulations (solid red curve) plotted along the protein sequence. Positive values indicate increased rigidity on heme binding. Shaded gray area indicates statistical uncertainty. The regions that exhibit the most significant changes in deuterium uptake in A are marked by color-coded boxes. Vertical dashed black lines highlight the loops. (C) Regions displaying the most significant changes in deuterium uptake have been labeled in color and mapped onto the crystal structure of holo-PhuS (PDB ID code 4MF9). (D) Binding site of holo-PhuS with key residues shown in stick format. Structural domains are colored as in A and B.
Fig. S2.
HDX-MS reveals heme-induced effects on conformational dynamics of WT (Upper) and H212R (Lower) PhuS. Deuterium incorporation kinetic traces are color-coded for the regions mapped on the PhuS structure in Fig. 1. Deuterium kinetic traces for the distal β5/β6-sheets: %D apo (solid line; dark green), %U apo (solid line; light green), %D holo (dashed line; dark green), and %U holo (dashed line; light green). Kinetic traces include the percentage deuteration (%D) and the percentage unfolded (%U) as a function of deuterium incubation time; %D is determined as the centroid of the isotopic envelope normalized to undeuterated and fully deuterated controls. Stacked mass spectra at 30 min for peptides 104–111 displaying instances of double-isotopic envelopes typical of EX1 kinetics are shown in Right. %U represents the relative proportion of the unprotected envelope (light blue dashed distribution in stacked spectra) as a function of deuterium incubation time as determined by HX-express.
Fig. S3.
Heme binding cleft free energy with respect to the radius of gyration of the heme binding cleft and the Cα distance between Arg-112 and His-209. Radius of gyration represents the volume of the binding cleft and was calculated using residues 92–115, 195–229, 255–272, and 300–340. The free energy was calculated based on the corresponding 2D histogram using RTlnPij, where Pij denotes the probability for the snapshot to be within the bin ij, R is universal gas constant, and T is temperature (298 K). The bin size is 0.1 Å for both coordinates. Note that, in the crystal structure of apo-PhuS, the radius of gyration of the heme binding cleft is 14.8 Å and the Cα distance between Arg-112 and His-209 is 12.4–13.0 Å (depending on the particular monomer unit used). These values are very similar to those in the holo-PhuS crystal structure.
Fig. 2.
HDX-MS reveals heme-induced effects on conformational dynamics of WT and H212R PhuS. Deuterium kinetic traces for the C-terminal (A) α6-helix and (B) α7/α8-helices and (C) N-terminal α2-helix are color-coded as in Fig. 1C. In A and B, the traces are as follows: %D apo (solid line; dark red), %D holo (dashed line; dark red), and %U holo (dashed line; pink), and in C, the traces are as follows: %D apo (solid line; dark blue), %U apo (solid line; light blue), %D holo (dashed line; dark blue), and %U holo (dashed line; light blue). Kinetic traces include the percentage deuteration (%D) and the percentage unfolded (%U) as a function of deuterium incubation time; %D is determined as the centroid of the isotopic envelope normalized to undeuterated and fully deuterated controls. Stacked mass spectra at 10 s and 10 min for peptides 198–205 (A) and 216–225 (B), and 30 min for peptide 29–26 (C) displaying instances of double-isotopic envelopes typical of EX1 kinetics are shown in Right. %U represents the relative proportion of the unprotected envelope (light blue dashed distribution) as a function of deuterium incubation time as determined by HX-express2.
Fig. S4.
Comparison between experimental and predicted WT deuterium kinetic traces for (Left) the α6-helix and (Right) the α7/α8-helices. The traces are as follows: %D apo-Exp (red solid line with closed triangles), %D holo-Exp (red dashed line with open triangles), %D apo-Sim (black solid line), %D holo-Sim (black dashed line), and %D holo-Exp of protected envelop resulting from bimodal deconvolution (magenta closed triangles). Statistical uncertainties are indicated by black error bars.
Allosteric Contributions to Holo-PhuS Interaction with HemO.
Insight into the dynamic flexibility of the heme binding pocket can be gained from the differences in deuterium exchange profiles in the presence and absence of the ligand. The slower EX1 unfolding kinetics in the distal β5/β6-sheets on heme binding reveal increased rigidity within this region compared with the apo-PhuS, whereas the C-terminal proximal α6/α7/α8 helices, after initial structural rearrangement, undergo cooperative unfolding characterized by the EX1 double-isotopic envelope beyond the 5-min time point (dashed pink lines in Fig. 2 A, Upper and B, Upper). A similar rate of unfolding in the α1/α2-helices (dashed light blue lines in Fig. 2C, Upper) of the N-terminal domain distant from the heme binding pocket is consistent with long-range allosteric effects.
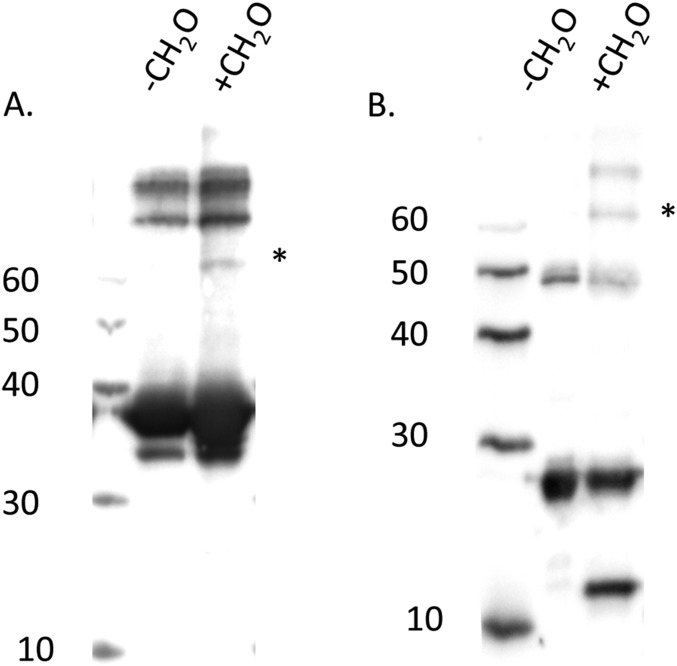
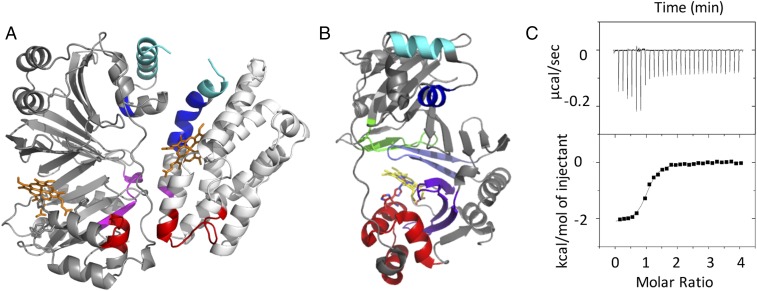
Based on the previously calculated slow rate of heme transfer from PhuS to HemO (0.1 s−1), it is reasonable to suggest the cooperative folding/unfolding motions may contribute to a His ligand switch from His-209 to His-212 that triggers heme release to HemO (11). Interestingly, the PhuS:HemO formaldehyde cross-linked complex detected by Western blot (Fig. S5) when subjected to tryptic digest and MALDI-TOF analysis revealed peptides within PhuS shown to undergo EX1 kinetics in the HDX-MS experiments. PhuS peptides 217–222, 218–222, and 223–227 from the C-terminal α7/α8-helices cross-link distal helix residues 124–132 and 133–145 of HemO, and PhuS peptides 228–236 and 296–304 from the β10- and β15-sheets flanking the binding pocket cross-link to proximal helix residues 35–42 of HemO (Fig. 3A). Furthermore, the PhuS N-terminal α1/α2-helices that are cooperatively linked to the motions of the C-terminal domain also map to the PhuS:HemO interface. The complete set of peptides from the in-gel tryptic digest of the formaldehyde-treated PhuS:HemO is listed in Table S1.
Fig. S5.
Western blots of (A) PhuS and (B) HemO after formaldehyde cross-linking. Equimolar mixture of PhuS and HemO (50 μM) in 100 μL. Reactions were allowed to proceed at 23 °C for 10 min and terminated by adding an equal volume of Laemmli buffer. Proteins were separated on 10% SDS/polyacrylamide gel, and the PhuS:HemO complex was confirmed by Western blotting with anti-PhuS and anti-HemO polyclonal antibodies. Mixtures of the noncross-linked proteins were electrophoresed and transferred as negative controls. *PhuS:HemO complex as identified with both anti-PhuS and -HemO antibodies.
Fig. 3.
Holo-PhuS H212R–HemO protein interaction. (A) The protein–protein interface as mapped by formaldehyde cross-linking and MALDI-TOF analysis. Cross-linking and MALDI-TOF analysis were performed as described in Experimental Procedures. Peptides identified at the protein interface that undergo EX1 kinetics in PhuS are color-coded as in Fig. 2. (B) Holo-PhuS structure displaying the proposed exit from the side pathway of heme release. His-209 (heme-bound) and His-212 are shown in stick form, and the regions displaying the most significant changes in deuterium uptake are color-coded as in Fig. 1. (C) ITC analysis of the holo-PhuS H212R interaction with apo-HemO. Titrations were performed in 20 mM sodium phosphate (pH 7.5) at 298 K. (Upper) Time-dependent release of heat during the titration. (Lower) Peak integrals as a function of the molar ratio of holo-PhuS to HemO. The data were fit to a single-site binding model with Origin software supplied by MicroCal Inc.
Table S1.
Intermolecular cross-linked peptides of the complex formed by holo-PhuS H212R and apo-HemO
| Observed monoisotopic peak* (m/z) | Experimental peptide mass (Da) | Theoretical peptide mass (Da) | Peptide mass matches to intermolecular cross-linked peptides† |
| 2,933.339‡ | 2,932.331‡ | 2,932.425‡ | (PhuS: 1MSSTPSLSHSPAELYRAWQDLR22)^(paHO: 15SQR17)‡ |
| 1,615.886‡ | 1,614.878‡ | 1,614.859‡ | (PhuS: 30AR31)^^^(paHO: 18LNLLTNEPHQR28)‡ |
| 1,615.869 | 1,614.861 | 1,614.863 | (PhuS: 207DTHHFHALLKK217)^^^(paHO: 35SK36) |
| 1,702.013‡ | 1,701.005‡ | 1,700.984‡ | (PhuS: 217KHGAQR222)^(paHO: 124LGAAFLFKK132)‡ |
| 1,875.970 | 1,874.962 | 1,874.906 | (PhuS: 217KHGAQR222)^^^^^(paHO: 1MDTLADESTR10) |
| 1,285.748 | 1,284.740 | 1,284.680 | (PhuS: 217KHGAQR222)^^^^^(paHO: 11QNLR14) |
| 1,133.649 | 1,132.641 | 1,132.585 | (PhuS: 218HGAQR222)^^^(paHO: 11QNLR14) |
| 1,702.855 | 1,701.847 | 1,701.913 | (PhuS: 218HGAQRTQALR227)^^^(paHO: 11QNLR14) |
| 1,726.989 | 1,725.981 | 1,725.913 | (PhuS: 218HGAQRTQALR227)^^^^^(paHO: 11QNLR14) |
| 2,167.239‡ | 2,166.231‡ | 2,166.217‡ | (PhuS: 218HGAQRTQALR227)^^^(paHO: 124LGAAFLFKK132)‡ |
| 1,956.041‡ | 1,955.033‡ | 1,954.961‡ | (PhuS: 218HGAQR222)^(paHO: 133AAALELDENFGAR145)‡ |
| 1,165.672 | 1,164.664 | 1,164.636 | (PhuS: 223TQALR227)^^^^(paHO: 11QNLR14) |
| 1,329.665‡ | 1,328.657‡ | 1,328.684‡ | (PhuS: 223TQALR227)^^^(paHO: 37EPFASR42)‡ |
| 1,303.724‡ | 1,302.716‡ | 1,302.693‡ | (PhuS: 296TTGIAELWR304)^^(paHO: 35SK36)‡ |
Peaks of interest were absent in the noncross-linked negative control.
Formaldehyde cross-linking and modification are indicated by ^.
Peptides correspond to regions shown to undergo EX1 kinetics.
Increased Structural Rigidity in the PhuS H212R Mutant Inhibits Heme Release to HemO.
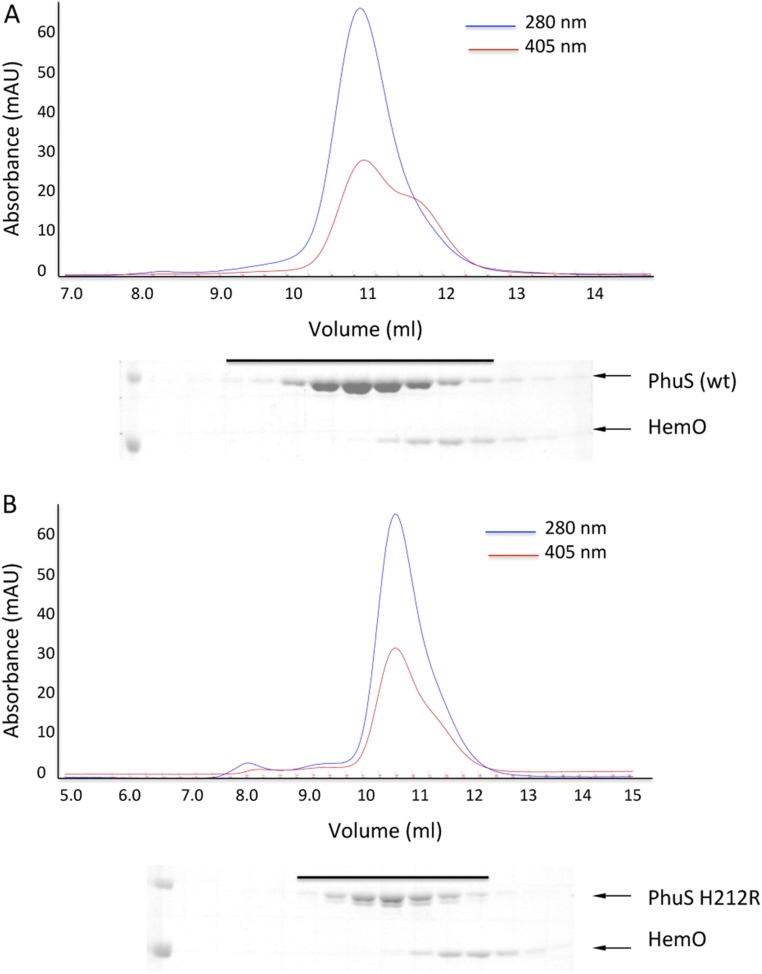
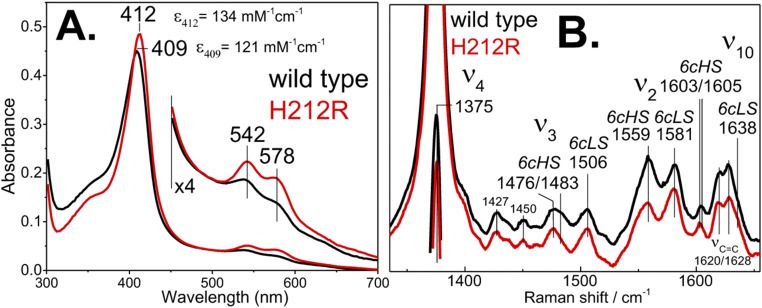
The role of the conformational dynamics and long-range coupling of the C-terminal α6/α7/α8-helices with the N-terminal α1/α2-helices is further supported in the PhuS H212R variant, which is impaired in its ability to release heme to HemO as judged by the heme distribution after separation of holo-PhuS and apo-HemO by size exclusion chromatography (Fig. S6). Isothermal titration calorimetry (ITC) analysis of the interaction of holo-PhuS H212R with HemO revealed an association constant Ka = 6.3 × 10⁶ M−1 and overall free energy of binding ΔG = −9.3 kcal mol−1 (Fig. 3C); these values are similar to those previously reported for holo-PhuS WT (Ka = 2.3 × 10⁶ M−1; ΔG = −8.3 kcal mol−1) (10). As for WT holo-PhuS, the interaction of H212R holo-PhuS with HemO is largely driven by enthalpic contributions; however, the moderate increase in entropy (∼3 kcal mol−1) suggests an increase in hydrophobic contributions and decreased conformational flexibility. The electronic absorption and resonance Raman (RR) spectra of holo-PhuS H212R reveal a heme coordination geometry that closely matches that of WT holo-PhuS (Fig. S7). The Soret absorption maximum of holo-PhuS H212R is observed at 412 nm, which corresponds to a 3-nm redshift compared with the Soret absorption of WT holo-PhuS (Fig. S7A), and in the Q bands, visible bands at 542 and 580 nm are slightly more intense in H212R, suggesting a marginal increase in the low-spin (LS) to high-spin (HS) heme conformer ratio in H212R relative to the WT protein. This interpretation of the ultraviolet-visible (UV-vis) absorption spectra is supported by the high-frequency RR spectra of H212R holo-PhuS, which are almost identical to that of the WT with porphyrin skeletal modes ν3, ν2, and ν10, indicative of a six-coordinate high-spin (6cHS)/six-coordinate low-spin (6cLS) equilibrium mixture, and a minor gain in relative intensity of the LS modes in the RR spectra of H212R (Fig. S7B). The vinyl stretching modes at 1,620 and 1,628 cm−1 are well-defined and unchanged by the H212R mutation (Fig. S7B).
Fig. S6.
Separation by size exclusion chromatography of (A) holo-PhuS WT or (B) holo-PhuS H212R and HemO after heme transfer; 100 μL PhuS (50 μM) mixed with HemO (10 μM) in 20 mM Tris⋅HCl (pH 7.4) containing 100 mM NaCl was separated on a Superdex S75 10/300GL column equilibrated with the same buffer. Protein elution was monitored at 405 (heme) and 280 nm (protein), and fractions (0.5 mL) with the peaks 405- and 280-nm absorbance were analyzed on a 10% SDS/PAGE gel. The solid black line represents peak fractions as analyzed by SDS/PAGE. (A) On incubation of holo-PhuS WT with HemO, the pronounced shoulder in the 405-nm trace (red line) corresponds with a significant heme content in fractions with peak HemO protein as judged by SDS/PAGE (fractions 11.5–13). (B) In contrast, on incubation with holo-PhuS H212R, the fractions containing HemO show significantly reduced heme content as judged by the 405-nm absorbance (fractions 11.5–13).
Fig. S7.
UV-vis absorption spectra and RR spectra of (A) holo-PhuS WT and (B) H212R variant. All spectra were recorded at room temperature. Concentrations are the same as in Fig. 4.
Analysis of the apo- and holo-PhuS H212R proteins by HDX-MS revealed a significant decrease in the rate of deuterium exchange within the regions previously shown to undergo cooperative folding/unfolding in WT PhuS. Specifically, the α6- and α7/α8-helices of the C-terminal domain that appear largely unstructured in the apo-PhuS WT at the earliest 10-s time point show 30 and 10% less deuterium exchange at the same time point in apo-PhuS H212R, respectively (Fig. 2 A and B). Furthermore, distinct EX1 kinetics at the C-terminal α6-helix (peptides 198–205) are reduced in holo-PhuS H212R relative to the WT protein (dashed pink lines in Fig. 2A, Lower) and completely suppressed in the α7/α8-helices of holo-PhuS H212R (dashed pink lines in Fig. 2B, Lower). Surprisingly, the H212R substitution also decreased the conformational flexibility observed at the N-terminal α1/α2-helices in the WT protein, with a complete loss of the EX1 kinetics in the α2-helix as observed for the α7/α8-helices (light blue lines in Fig. 2C, Lower). The suppression of the cooperative unfolding events in both the N- and C-terminal domains suggests that these motions are allosterically coupled in a heme-dependent manner.
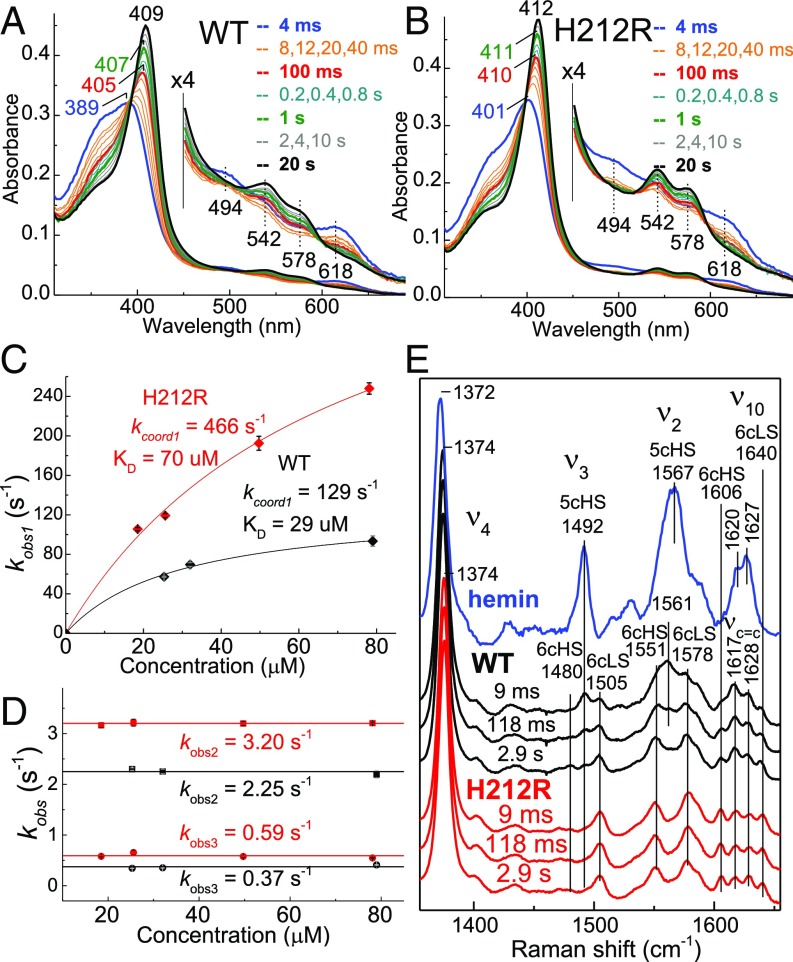
In keeping with a more structured C-terminal domain in apo-PhuS H212R, monitoring the process of heme binding to PhuS by stopped flow UV-vis spectroscopy at 4 °C revealed a significantly faster rate of heme binding to apo-PhuS H212R compared with the WT protein. Specifically, mixing hemin with apo-PhuS WT shows a gradual transition over 20 s from the spectrum of free hemin to that of holo-PhuS (Fig. 4A), whereas the first trace obtained after 4 ms with H212R apo-PhuS already shows a Soret maximum at 401 nm (Fig. 4B). Single-wavelength and global analyses of these kinetic data show triphasic processes for both proteins, with a first rate kobs1 with hyperbolic dependency on the apo-PhuS concentration and two slower phases, kobs2 and kobs3, unaffected by the apoprotein concentration (Fig. 4 C and D). As with previous studies (14, 15), the hyperbolic dependence of kobs1 can be modeled by a two-step process that includes the formation of a hemin–apoprotein reversible complex followed by an iron (III) coordination step:
where kobs1 = k1coord [apoprotein]/((k−1 + k1coord)/k1 + [apoprotein]) ∼ k1coord [apoprotein]/Kd + [apoprotein] assuming k1[apoprotein] and k−1 >> k1coord >> k−hemin.
Fig. 4.
Stopped flow absorption and RFQ-RR analysis of hemin binding to WT and H212R apo-PhuS. Stopped flow absorption spectra of the association of 3.5 μM hemin with ∼25 μM (A) WT or (B) H212R apo-PhuS at 4 °C. (C and D) Plots of observed rate constants vs. apoprotein concentrations. (E) RR spectra of RFQ samples of the reaction of 1 eq hemin with ∼150 μM WT (black), ∼150 μM apo-PhuS (red), and buffer control (blue).
We favor this model over that of a conformational rearrangement of apo-PhuS before heme binding based on the amphiphilic character of hemin that promotes rapid interaction with apoproteins, making a noninteracting apoconformer unlikely. Using this model with WT and H212R apo-PhuS leads to higher k1coord and Kd values and an overall increase in hemin association rates in the H212R variant. The rapid freeze quench (RFQ)-RR analysis of hemin binding to WT and H212R apo-PhuS further supports the stopped flow kinetics, showing the establishment of the proximal His-coordinated spectrum within the earliest RFQ time of 9 ms with the H212R mutant (Fig. 4E). In contrast, the 9-ms RFQ-RR spectrum for the WT protein shows evidence of a five-coordinate HS heme conformer with porphyrin modes ν3 and ν2 at 1,492 and 1,561 cm−1, respectively.
Overall, the higher Kd for the initial apoprotein•hemin complex but faster coordination steps in H212R relative to the WT protein are consistent with an initial apoprotein•hemin complex formation driven by noncoordinating π-stacking and hydrophobic interactions between the porphyrin and distal face β-sheets, triggering conformational rearrangement of the C-terminal domain and His-209 coordination to the heme iron. Increased folding of the C-terminal helices in apo-PhuS H212R may destabilize the apoprotein•hemin complex, while at the same time, prearrange H209 for heme iron coordination. The relatively slow first-order rates k2 and k3 revealed in the stopped flow traces would have been anticipated to result in different RR spectra for early RFQ samples relative to samples frozen a few seconds after mixing, but the RR spectra of H212R at 9 ms, 118 ms, and 2.9 s are nearly indistinguishable. This apparent discrepancy between stopped flow and RFQ data for H212R may reflect the impact of cryogenic temperatures on spin-state equilibrium in six-coordinate heme complexes with His/aqua axial ligands. Indeed, changing interactions between the heme iron (III) aqua ligand and residues lining the heme binding pocket can affect the HS to LS equilibrium ratio observed in the stopped flow measurements preformed at 4 °C but are unobserved in the RFQ-RR measurements performed at 110 K, because cryogenic temperatures depopulate the 6cHS species in favor of 6cLS conformers.
A Model for Heme Transfer.
Based on the cross-linking data, a model of the docked holo-PhuS:HemO complex was obtained by in silico methods (Fig. 3A). In this docking orientation, heme must be translocated over 20 Å from PhuS to the heme binding site of HemO. Based on previous crystallographic data, we proposed a ligand switch from His-209 to His-212, with His-212 adopting an alternate rotamer, placing the heme in a more solvent-exposed region of the pocket where Arg-222 and Lys-216 are in a position to interact with the heme propionates (13). This positioning of the heme is consistent with the cross-linking data and provides a path for translocation of heme to HemO. The alternate rotamer adopted through heme coordination on His-212 orients the heme propionates at the protein–protein interface in close proximity to Lys-132 of HemO. Interaction of the heme propionate with Lys-132 of HemO may aid in facilitating transfer from PhuS to HemO. Interestingly, Lys-132 is required for stabilizing heme in the HemO active site in an orientation selective for β/δ-oxidative cleavage (16). These HDX-MS studies are consistent with this model, whereby the conformational flexibility at the dimer interface coupled with the allosteric modulation between the N- and C-terminal domains provides the free energy to trigger the His switch, opening up a path for heme translocation to HemO via an exit from the side mechanism (Fig. 3B). The decrease in conformational flexibility at the protein interface and resulting increase in entropy on holo-PhuS H212 interaction with HemO correlate with the inability to transfer heme to HemO.
Conclusions
We previously showed by sedimentation and limited proteolysis that, on heme binding, a conformational rearrangement of the PhuS C-terminal domain was required for interaction with HemO (10). Furthermore, site-directed mutagenesis and spectroscopic studies showed that either His-209 or His-212 could provide the proximal ligand to the heme (5). This study combining HDX-MS, MD, and stopped flow/RFQ-RR spectroscopic studies has provided additional insight into the role of the conformational flexibility of PhuS in driving heme transfer to HemO. HDX-MS analysis of apo-PhuS indicates that the C-terminal domain is largely unstructured, consistent with earlier proteolysis studies. Interestingly, deuterium uptake calculated from MD simulations based on the crystal structures of apo- and holo-PhuS are similar and for the apo form, deviate significantly from the experimental data, suggesting that the apo-PhuS crystal structure is along the trajectory of the more structured holo-PhuS. We propose that the conformational rearrangement and dynamics of the C-terminal domain of PhuS on heme binding drive both the ligand switch and protein–protein interaction with HemO (Fig. 5). Previous studies showed that the holo-PhuS H209A variant (where heme is coordinated through His-212) interacts and transfers heme to HemO. However, in contrast, the holo-PhuS H212R variant, while retaining the ability to interact with HemO, was unable to transfer heme to HemO. Thus, in our model, holo-PhuS conformers coordinated through either His-209 or His-212 are competent to interact with HemO; however, the heme ligand switch from His-209 to His-212 is required for heme transfer (Fig. 5). Furthermore, the overall decrease in conformational flexibility of the apo-PhuS H212R that increased the rate of heme binding but decreased cooperative folding and unfolding within regions at the protein interface highlights the critical role of allostery between the N- and C-terminal domains of PhuS in driving the heme ligand switch. The increase in entropic contributions on binding HemO as a result of the decreased conformational flexibility provides additional support for a model where the conformational flexibility and free energy on protein interaction drive heme translocation to HemO. Detailed spectroscopic studies are underway to further investigate the heme-ligated intermediates along the heme translocation pathway from holo-PhuS to HemO.
Fig. 5.
Proposed mechanism for heme transfer from holo-PhuS to apo-HemO.
Experimental Procedures
Protein Expression and Purification.
All bacterial strains and plasmids used in these studies were as previously reported (5, 6). Site-directed mutagenesis to create the PhuS H212R variant together with protein purification of WT PhuS, H212R PhuS, and HemO were carried out as previously described (5–7). A more detailed description is provided in SI Experimental Procedures.
HDX-MS.
Liquid chromatography/MS workflow, coverage map and deuterium uptake determination, and deconvolution of biomodal isotopic envelops characteristic of EX1 kinetics were performed as described previously (17). A detailed description is provided in SI Experimental Procedures.
MD Simulations.
Based on the crystal structures of the apo [Protein Data Bank (PDB) ID code 4IMH] (13) and holo (PDB ID code 4MF9) (12) PhuS, hybrid solvent continuous constant pH MD simulations with pH replica exchange protocol (18) were carried out using the CHARMM package (version c37b1) (19). To compare with the HDX-MS experiments, the deuterium uptake traces were calculated using protocols described by Radou et al. (20). Details of the simulation protocol and HDX-MS calculations are given in SI Experimental Procedures.
Cross-Linking and in Silico Modeling of the PhuS:HemO Complex.
Holo-PhuS (50 μM) was mixed with an equimolar ratio of apo-HemO in 50 mM sodium phosphate buffer (pH 7.4), and the cross-linking reactions were initialized with a final concentration of 0.2% formaldehyde. The PhuS:HemO complex was modeled by using Cluspro 2.0 (21). Crystal structures of PhuS (PDB ID codes 4MF9 and 4IMH) and HemO (PDB ID code 1SK7) were used as template structures. A detailed description of the tryptic digest, peptide purification, and in silico modeling is provided in SI Experimental Procedures.
ITC.
Titrations of apo-HemO with holo-PhuS WT and H212R were performed on a MicroCal MCS Titration Calorimeter (MicroCal Inc.) as previously described (10). A detailed description is provided in SI Experimental Procedures.
RR Spectroscopy.
A custom McPherson 2061/207 spectrograph was used to obtain RR spectra. The spectrograph was equipped with a Princeton Instruments liquid N2-cooled CCD detector (LN-1100PB). A Krypton laser (Innova 302; Coherent) was used to provide excitation at 407 nm.
Stopped Flow UV-Vis Spectroscopy.
The apoprotein at varying concentrations in 200 mM Hepes (pH 7) and the hemin solution at 3.5 μM in 10 mM NaOH were loaded into an SX20 stopped flow UV-vis spectrometer (Applied Photophysics) and equilibrated to 4 °C. Excess solutions from each syringe were recovered from the apparatus after each experiment to confirm the concentrations of hemin and apoprotein by UV-vis spectroscopy; 1:1 mixtures of the hemin solution with Hepes buffer confirmed that the UV-vis spectrum of hemin alone was unchanged during the stopped flow experiments. RFQ samples after mixing of apo-PhuS with hemin were collected and analyzed by RR. A detailed description of the stopped flow experiments and RFQ methods is provided in SI Experimental Procedures.
SI Experimental Procedures
Bacterial Strains and Plasmids.
The cloning of the phuS gene in pET21α has previously been reported (6). Escherichia coli DH5α [F′ araD(lac-proAB) rpsL ϕ80dlacZDM15 hsd R17] was routinely used for DNA manipulation, and E. coli strain BL21 (DE3) plysS [F− ompT hsdSB (rB− mB−) gal dcm (DE3)] was used for protein expression. Bacteria were cultured in LB broth containing 100 μg/mL ampicillin. Site-directed mutagenesis was performed by PCR using the QuikChange mutagenesis kit (Agilent). The mutation was confirmed by DNA sequencing (Eurofins MWG Operon).
Protein Purification.
Expression and purification of WT PhuS, H212R PhuS, and HemO proteins were carried out as previously described (6, 7). Heme loading of the purified PhuS protein was carried out by addition of a 1.5:1 ratio of heme to protein. Heme solutions were prepared in 0.1 M NaOH, and the pH was adjusted with the identical buffer used to prepare the PhuS protein samples. All buffered heme solutions were used within 20 min of preparation. Heme stock solution concentrations and the stoichiometry of the final holo-PhuS complexes were determined by pyridine hemochrome as previously described (22). Before use, holo-PhuS proteins were further purified by FPLC over a Superdex S-200 PG (2.6 × 60 cm) to ensure that the protein was monomeric. Heme transfer from PhuS to HemO was performed by incubation of an equimolar ratio of holo-PhuS to HemO followed by partial separation by FPLC over a Superdex 75 10/300 GL column.
HDX-MS.
Immediately after quenching, the samples were injected on a Waters nanoACQUITY UPLC System with HDX Technology equipped with a Poroszyme Immobilized Pepsin Column, a VanGuard Pre-Column Acquity UPLC BEH C18 (1.7 µm; 2.1 × 5 mm), and a Acquity UPLC BEH C18 column (1.7 µm; 1.0 × 100 mm). The peptides were trapped for 2 min and eluted over a 7-min 5–35% (vol/vol) acetonitrile (containing 0.1% formic acid) gradient into a Waters Synapt G2 mass spectrometer. Data were acquired with a 20- to 30-V ramp trap collision energy for high-energy acquisition of product ions as well as continuous lock mass (Leu-Enk) for mass accuracy correction. The peptides were sequenced using ProteinLynx Global SERVER 2.5.1 (PLGS; Waters Corp.), and deuterium uptake by the identified peptides was tracked using Water DynamX 2.0 software. Additional normalization was performed to determine the percentage deuterium uptake of any peptide at any deuterium incubation time t as follows:
where mt is the centroid mass at incubation time t, m0 is the centroid mass of the undeuterated control, and mf is the centroid mass of the fully deuterated control. The normalized percentage deuterium uptake was structurally visualized on the apo-PhuS WT crystal structure (PDB ID code 4IMH) (13). The percentage deuteration difference plots Δ%D (apo–holo) were generated using the respective deuteration calculated. Confidence intervals were determined using the method outlined by Houde et al. (23) adjusted to percentage deuteration. Peptides displaying EX1-type cooperative folding/unfolding were analyzed using HX-express2 to determine the relative unfolding (%U; the relative proportion of unprotected envelope) (24).
Simulation Protocol and Hydrogen–Deuterium Exchange Calculations.
Structure preparation.
Chain A of the dimeric crystal structure of apo-PhuS (PDB ID code 4IMH) (13) or holo-PhuS (PDB ID code 4MF9) (12) was used as the starting structure for constant pH molecular dynamics (CpHMD) simulations. The missing residues (1–7 in apo-PhuS or 1–8 in holo-PhuS) were added by homology modeling using MODELER (25). The N terminus was acetylated, whereas the C terminus was N-methylamidated. Hydrogen atoms were added using the HBUILD facility in CHARMM (19). In preparation for CpHMD simulations, dummy hydrogen atoms were added to the titratable sites in the protein (Asp, Glu, and His side chains). All dummy hydrogens were placed in syn position (26). The protein was then placed in a truncated octahedral water box with a minimum distance of 10 Å between the solute and edges of the water box. Water molecules within 2.6 Å of any protein heavy atoms were deleted. The system was minimized by steepest descent followed by the adopted basis Newton–Raphson method with protein heavy atoms fixed and then harmonically restrained with a force constant of 5.0 kcal/mol⋅Å2 to relax hydrogen positions. In the minimization step, CpHMD was turned on a single pH: i.e., the crystallization pH condition [pH 7.5 for apo-PhuS (13) and pH 8.5 for holo-PhuS (12)].
Overview of the CpHMD method.
In CpHMD simulations (18, 26), the conformational state of the system is evolved simultaneously with titration coordinates of the solute at a specified pH condition. The hybrid solvent version of CpHMD (18) makes use of highly accurate conformational sampling in explicit solvent and efficient calculation of solvation energetics for propagating titration coordinates by the generalized Born with simple switching (GBSW) implicit solvent model (27). The pH replica exchange (pH-REX) protocol significantly accelerates sampling of protonation states coupled to conformational dynamics (18). Hybrid solvent CpHMD with pH-REX has been shown to offer rapid and accurate prediction of protein pKa values (18), including deeply buried sites (28), based on a sampling length of 1–5 ns per replica. More details of hybrid solvent CpHMD with pH-REX can be found elsewhere (18).
Simulation protocol.
pH-REX hybrid solvent CpHMD simulations (18) were performed using an in-house modified version of CHARMM program package (version c37a2) (19), which contains the hybrid solvent and other CpHMD methods [module PHMD (18, 27) as well as the pH-REX protocol in module REPDSTR (18)].
The all-atom CHARMM22/CMAP force field (29) was used to represent protein, and the CHARMM-modified TIP3P water model was used to represent water (29). MD was conducted with periodic boundary conditions at ambient temperature (300 K) and pressure (1 atm). The temperature and pressure were controlled by the Nóse–Hoover thermostat (30) and the Langevin piston pressure coupling algorithm (31), respectively. van der Waals energies were smoothly switched off in the range of 10–12 Å using a switching function. Electrostatics energies were calculated using the particle mesh Ewald method (32), with a real space cutoff of 12 Å and a sixth-order interpolation with ∼1-Å grid spacing. The SHAKE algorithm (33) was applied to bonds involving hydrogen atoms to allow for a 2-fs time step.
Unless otherwise noted, the defaulting setting of the PHMD module was used for CpHMD. The solvation forces for propagating titration coordinates were computed using the GBSW implicit solvent model (27) with the default atomic input radii (34). The atomic input radius for ferrous iron was taken from Babu and Lim (35). The ionic strength in the generalized Born (GB) calculation was set to 150 mM. The default setting in the GBSW module of CHARMM (33) was used for all other GB input options.
The system was heated and equilibrated at the crystallization pH condition [pH 7.5 for apo-PhuS (13) and pH 8.5 for holo-PhuS (12)]. In the heating stage, the temperature was raised from 0 to 300 K in 120 ps with the protein heavy atoms harmonically restrained with a force constant of 5.0 kcal/mol⋅Å2. In the equilibration stage, the force was gradually reduced to zero within 75 ps followed by a 25-ps unrestrained dynamics run.
In the pH-REX protocol, an exchange between adjacent pH replicas was attempted every 500 MD steps or 1 ps. To optimize the exchange frequency, a trial 1-ns pH-REX simulation was carried out using pH conditions 0–9.5 with 0.5-pH unit intervals. The exchange ratios were examined, and additional replicas were added at 0.25-pH unit intervals between replicas with exchange ratios below 20%. In the final simulation setting, there were 32 replicas at pH values of 0.5, 1.0, 1.5, 2.0, 2.25, 2.5, 2.75, 3.0, 3.25, 3.5, 3.75, 4.0, 4.25, 4.5, 4.75, 5.0, 5.25, 5.5, 5.75, 6.0, 6.25, 6.5, 6.75, 7.0, 7.25, 7.5, 7.75, 8.0, 8.25, 8.5, 9.0, and 9.5. The simulation lengths were 6 and 5 ns per replica for apo and holo simulations, respectively. During simulation, data were collected after each replica exchange attempt (500 MD steps or 1 ps).
To calculate the pKa of a titratable site, we first counted the populations of protonated (defined as those with λ < 0.1) and unprotonated (λ > 0.9) states, which gave the unprotonated fraction S at different pH values. The pKa values were then computed by fitting the S values to the Hill equation:
| [S1] |
where n is the Hill coefficient representing the slope of the transition region in the titration curve.
Conventional fixed protonation-state MD simulations.
After CpHMD simulations, conventional fixed protonation-state MD simulations were performed for the apo- and holo-PhuS with the protonation states (including the tautomeric states of histidines) assigned for the physiological pH condition (pH 7.4) using the pKa values predicted by the CpHMD simulations. The missing residues (1–7 for apo structure, 1–8 for holo structure chain A, and 1–13 for holo structure chain B) were added by homology modeling using MODELER (25). The missing side chain heavy atoms of Arg-130 in the apo structure of chain B were also added by MODELER (25). The N and C termini were kept charged. Hydrogen atoms were added using the pdb2gmx utility of GROMACS (36). The molecule was solvated in a triclinic water box with a minimum distance of 12 Å between the solute and edges of the water box. Explicit Na+ and Cl− ions were added to neutralize the excess charge and achieve a physiological ion concentration of 150 mM.
The simulations were performed using GROMACS (36) (version 4.5.5) with the all-atom CHARMM22/CMAP force field (29) and the CHARMM-modified TIP3P water model (29). In all simulations, the Linear constraints solver (LINCS) algorithm (37) was applied to bonds involving hydrogen atoms to allow a 2-fs time step. The system was simulated under periodic boundary conditions and in the constant number (N), pressure (P), and temperature (T) (NPT) ensemble. A temperature of 300 K was maintained by the Hoover thermostat (30) using a time constant of 0.1 ps. The Parrinello–Rahman barostat (38) was applied to maintain a pressure of 1 atm using isotropic pressure coupling with the time constant of 4.0 ps, reference pressure of 1 bar, and compressibility of 4.5 × 10⁻⁵ bar−1. van der Waals interactions were smoothly switched off from 10 to 12 Å using a switching function. Electrostatics were calculated using the particle mesh Ewald summation (32), with a real space cutoff of 14 Å and a sixth-order interpolation with 1.6-Å grid spacing.
Simulations were carried out in several steps. The system was first minimized by steepest descent until the maximum force was reduced to below 1,000 kJ/mol per nanometer. Then, the systems were equilibrated for 100 ps in the constant number (N), volume (V), and temperature (T) (NVT) ensemble followed by 200 ps in the NPT ensemble with protein heavy atoms restrained with a force constant of 1,000 kJ/mol⋅nm2. The unrestrained production runs were then performed in the NPT ensemble for 500 ns. During the simulation, data were recorded every 1,000 MD steps or 2 ps. Three heuristically independent simulations were performed. Chain A was used for the first and second runs using different random seeds, whereas chain B was used in the third run. Both apo- and holostructures were simulated.
Before analysis, original trajectories were manipulated by GROMACS toolset trjconv to remove solvent molecules, periodic boundary conditions, translocation, and rotation and align by least square fitting to the protein heavy atoms. The rmsd from the starting structure was computed using g-rms by least square fitting to the backbone atoms of nonloop residues (10–173 and 191–354). The rms fluctuation of Cα atoms was calculated using g-rmsf based on the 200- to 500-ns data.
Calculation of hydrogen–deuterium exchange data.
The hydrogen–deuterium exchange (HDX) of amide hydrogens within a folded protein requires local opening of the structure and can be thus described as a two-step process (21, 39):
| [S2] |
where the first step describes the interconversion between the amide in the closed and open states, whereas the second step describes the deuterium uptake in the open state. The kinetics of the first step is reported by the opening and closing rates ko and kc, respectively, whereas the rate of the second step is reported by the so-called intrinsic rate kint, which is related to the acidity of the amide hydrogen and dependent on temperature, pH, and primary structure (40). It follows that the observed deuterium uptake rate kobs is (20, 39)
| [S3] |
For a folded protein in the native condition, kc ≫ ko, two limiting regimes, referred to as EX1 and EX2, are of interest (39). In the EX1 regime, deuterium uptake occurs immediately on opening of the structure: kint ≫ kc. Thus, the observed deuterium uptake rate is approximately the same as the opening rate: kobs ∼ ko. This scenario is often associated with global unfolding.
In the EX2 regime, kc ≫ kint (i.e., the HDX may occur after several opening/closing cycles, which is a scenario physiologically more prevalent than EX1). In this case, the observed deuterium uptake rate can be calculated as
| [S4] |
where P, defined as kc/ko, is the so-called protection factor that describes the extent by which an amide hydrogen is protected from deuterium replacement.
According to Vendruscolo et al. (41), the protection factor for a residue (Pi) can be estimated based on the structure of the protein using the following phenomenological equation:
| [S5] |
where X refers to a particular conformation of the protein, Nic(X) is the number of contacts between residue i and other residues, Nih(X) is the number of hydrogen bonds formed by the amide hydrogen of residue i, and βc and βh are two empirical parameters.
Following Eq. S4, the deuterium fraction for residue i at time t is
| [S6] |
where Pi can be estimated using Eq. S5, and kint has been previously estimated by Englander and coworkers (40). The time trace of deuterium fraction of fragment j is taken as an average of the residue-based deuterium fractions:
| [S7] |
where nj is the number of amide hydrogens in fragment j.
Calculation protocol.
One hundred fifty peptide fragments used in either apo- or holo-HDX experiments were selected; 15 of 150 fragments were determined to be under pure EX1 mechanism and thus excluded from the calculations. For those fragments exhibiting mixed EX1 and EX2 behavior, the EX1 part was removed, and only EX2 measurements were used to compare with the calculations. Based on the 200- to 500-ns trajectories, we calculated the protection factor for all relevant residues using Eq. S5. Following the work by Best and Vendruscolo (42), Nic(X) was calculated as the number of heavy atoms with 6.5 Å from the amide nitrogen of residue i, a cutoff of 2.4 Å between the donor hydrogen and the acceptor was used to calculate Nih(X), and βc and βh were set to 0.35 and 2, respectively. The calculated Pi was averaged over three independent MD runs. Combined with the intrinsic rate estimated by Englander and coworkers (39), the time trace was obtained via Eqs. S6 and S7.
Cross-linking and mapping of the PhuS:HemO interface.
After formaldehyde cross-linking and SDS/PAGE separation as described in Experimental Procedures, the cross-linked proteins were transferred onto PVDF membranes using a semidry transblot system (Bio-Rad). Membranes were blocked with 5% (wt/vol) skim milk in Tris-buffered saline (TBS) with 0.05% Tween-20, incubated with rabbit primary antibodies against either PhuS or HemO (1:1,000), washed with 0.05% Tween-20 in TBS, and incubated with peroxidase-labeled goat anti-rabbit secondary antibody. After washing, bands of PhuS:HemO complex were visualized with the SuperSignal West Pico Chemiluminescent Substrate kit (Pierce). Noncross-linked proteins were electrophoresed and transferred as negative controls. Antibodies were obtained from Covance Custom Antibodies and generated from purified proteins supplied by our laboratory. Antibody specificity was checked against the respective purified proteins (10 ng), and all experimental Western blots were run with molecular weight markers as standards.
After separation of the cross-linked proteins on SDS/PAGE, gel slices were destained by acetonitrile (ACN), and the cysteines were reduced by Tris[2-carboxyethyl]phosphine and alkylated by iodoacetamide. Digestions were carried out at 37 °C overnight with mass spectrometric-grade trypsin (Pierce). Peptides were extracted in 1% TFA and purified by reverse-phase C18 tips (Pierce). C18 eluates in 50% (vol/vol) ACN with 0.1% TFA were mixed with equal volumes of 10 mg/mL α-cyano-4-hydroxycinamic acid in 70% (vol/vol) ACN containing 0.1% TFA. The peptide/matrix mixtures were analyzed on a Bruker AutoFlex MALDI-TOF mass spectrometer in the reflectron mode. Data were analyzed using an in-house peptide mass fingerprinting search engine developed in our laboratory (qpmf.rx.umaryland.edu). A mixture of noncross-linked PhuS and HemO was subjected to the same procedure as a negative control.
ITC.
Titrations of apo-HemO with holo-PhuS WT and H212R were performed on a MicroCal MCS titration calorimeter (MicroCal Inc.). All protein samples and hemin solutions were in 20 mM sodium phosphate (pH 7.5). Samples were thoroughly degassed before use by stirring under vacuum. All injections were carried out at 5-min intervals. Because of heme adsorption, the calorimeter cell and the microsyringe used for injections were extensively washed after each experiment. The heat of dilution of the ligand was measured by injecting the ligand into the buffer alone. The value obtained was subtracted from the heat of reaction to give the effective heat of binding. For all titration experiments, the concentration of the protein ranges from 10 to 20 μM, and the ligand (apo-HemO) was set to 10–20 times this value. The ITC data were fitted with the Origin software package provided by MicroCal Inc., which uses a nonlinear least squares algorithm (minimization of χ2) and the concentrations of the titrant and the sample to fit the heat flow per injection to the equation corresponding to an equilibrium binding model, providing best fit values for the stoichiometry (nITC), change in enthalpy (∆HITC), and binding constant (KITC). Kd and Gibbs free energy were calculated according to Kd = 1/Ka and ∆G = −RTlnKa. The thermodynamic relationship ∆G = ∆H − T∆S was used to find the entropic contribution to binding.
Preparation of RFQ-RR samples.
The apo-PhuS proteins (340 μM in 200 mM Hepes, pH 7, before mixing) and the hemin solutions (330 μM in 10 mM NaOH before mixing) were loaded into the System 100 Chemical/Freeze Quench Apparatus (Update Instruments) for 1:1 mixing. Throughout the experiments, the samples were maintained at ∼4 °C using a circulating water bath. Reaction times were controlled by varying the length of the reactor hose or the syringe displacement rate. After mixing, samples were ejected into funnels attached to NMR tubes and filled with liquid ethane at ≤−120 °C. The frozen samples were packed into the NMR tubes held within a Teflon block previously cooled to −150 °C with liquid nitrogen. The samples were subsequently kept at −80 °C for 2 h to remove residual ethane. Control NMR tubes with 1:1 mixing of hemin solution and buffer were also prepared.
Acknowledgments
This work was supported by NIH Grant AI102833 (to A.W.) and in part by University of Maryland Baltimore School of Pharmacy Mass Spectrometry Center Grant SOP1841-IQB2014.
Footnotes
The authors declare no conflict of interest.
This article is a PNAS Direct Submission.
This article contains supporting information online at www.pnas.org/lookup/suppl/doi:10.1073/pnas.1606931114/-/DCSupplemental.
References
- 1.Collins HL. Withholding iron as a cellular defence mechanism--friend or foe? Eur J Immunol. 2008;38(7):1803–1806. doi: 10.1002/eji.200838505. [DOI] [PubMed] [Google Scholar]
- 2.Wilks A, O’Neill MJ. 2014. Extracellular heme uptake and metabolism in bacterial pathogenesis. Handbook of Porphyrin Science, Heme Biochemistry, ed Ferreira GC (World Scientific, Singapore), 1st Ed, Vol 26, pp 268–306.
- 3.Ochsner UA, Johnson Z, Vasil ML. Genetics and regulation of two distinct haem-uptake systems, phu and has, in Pseudomonas aeruginosa. Microbiology. 2000;146(Pt 1):185–198. doi: 10.1099/00221287-146-1-185. [DOI] [PubMed] [Google Scholar]
- 4.Smith AD, Wilks A. Differential contributions of the outer membrane receptors PhuR and HasR to heme acquisition in Pseudomonas aeruginosa. J Biol Chem. 2015;290(12):7756–7766. doi: 10.1074/jbc.M114.633495. [DOI] [PMC free article] [PubMed] [Google Scholar]
- 5.Block DR, et al. Identification of two heme-binding sites in the cytoplasmic heme-trafficking protein PhuS from Pseudomonas aeruginosa and their relevance to function. Biochemistry. 2007;46(50):14391–14402. doi: 10.1021/bi701509n. [DOI] [PubMed] [Google Scholar]
- 6.Lansky IB, et al. The cytoplasmic heme-binding protein (PhuS) from the heme uptake system of Pseudomonas aeruginosa is an intracellular heme-trafficking protein to the delta-regioselective heme oxygenase. J Biol Chem. 2006;281(19):13652–13662. doi: 10.1074/jbc.M600824200. [DOI] [PubMed] [Google Scholar]
- 7.Ratliff M, Zhu W, Deshmukh R, Wilks A, Stojiljkovic I. Homologues of neisserial heme oxygenase in gram-negative bacteria: Degradation of heme by the product of the pigA gene of Pseudomonas aeruginosa. J Bacteriol. 2001;183(21):6394–6403. doi: 10.1128/JB.183.21.6394-6403.2001. [DOI] [PMC free article] [PubMed] [Google Scholar]
- 8.Marvig RL, et al. Within-host evolution of Pseudomonas aeruginosa reveals adaptation toward iron acquisition from hemoglobin. MBio. 2014;5(3):e00966–e14. doi: 10.1128/mBio.00966-14. [DOI] [PMC free article] [PubMed] [Google Scholar]
- 9.Nguyen AT, et al. Adaptation of iron homeostasis pathways by a Pseudomonas aeruginosa pyoverdine mutant in the cystic fibrosis lung. J Bacteriol. 2014;196(12):2265–2276. doi: 10.1128/JB.01491-14. [DOI] [PMC free article] [PubMed] [Google Scholar]
- 10.O’Neill MJ, Bhakta MN, Fleming KG, Wilks A. Induced fit on heme binding to the Pseudomonas aeruginosa cytoplasmic protein (PhuS) drives interaction with heme oxygenase (HemO) Proc Natl Acad Sci USA. 2012;109(15):5639–5644. doi: 10.1073/pnas.1121549109. [DOI] [PMC free article] [PubMed] [Google Scholar]
- 11.Bhakta MN, Wilks A. The mechanism of heme transfer from the cytoplasmic heme binding protein PhuS to the delta-regioselective heme oxygenase of Pseudomonas aeruginosa. Biochemistry. 2006;45(38):11642–11649. doi: 10.1021/bi060980l. [DOI] [PMC free article] [PubMed] [Google Scholar]
- 12.Lee MJ, Schep D, McLaughlin B, Kaufmann M, Jia Z. Structural analysis and identification of PhuS as a heme-degrading enzyme from Pseudomonas aeruginosa. J Mol Biol. 2014;426(9):1936–1946. doi: 10.1016/j.jmb.2014.02.013. [DOI] [PubMed] [Google Scholar]
- 13.Tripathi S, O’Neill MJ, Wilks A, Poulos TL. Crystal structure of the Pseudomonas aeruginosa cytoplasmic heme binding protein, Apo-PhuS. J Inorg Biochem. 2013;128:131–136. doi: 10.1016/j.jinorgbio.2013.07.030. [DOI] [PMC free article] [PubMed] [Google Scholar]
- 14.Kumar R, et al. Replacing the axial ligand tyrosine 75 or its hydrogen bond partner histidine 83 minimally affects hemin acquisition by the hemophore HasAp from Pseudomonas aeruginosa. Biochemistry. 2014;53(13):2112–2125. doi: 10.1021/bi500030p. [DOI] [PMC free article] [PubMed] [Google Scholar]
- 15.Yukl ET, et al. Kinetic and spectroscopic studies of hemin acquisition in the hemophore HasAp from Pseudomonas aeruginosa. Biochemistry. 2010;49(31):6646–6654. doi: 10.1021/bi100692f. [DOI] [PMC free article] [PubMed] [Google Scholar]
- 16.Friedman J, Lad L, Li H, Wilks A, Poulos TL. Structural basis for novel delta-regioselective heme oxygenation in the opportunistic pathogen Pseudomonas aeruginosa. Biochemistry. 2004;43(18):5239–5245. doi: 10.1021/bi049687g. [DOI] [PubMed] [Google Scholar]
- 17.Deredge D, Li J, Johnson KA, Wintrode PL. Hydrogen/deuterium exchange kinetics demonstrate long range allosteric effects of thumb site 2 inhibitors of hepatitis C viral RNA-dependent RNA polymerase. J Biol Chem. 2016;291(19):10078–10088. doi: 10.1074/jbc.M115.708370. [DOI] [PMC free article] [PubMed] [Google Scholar]
- 18.Wallace JA, Shen JK. Continuous constant pH molecular dynamics in explicit solvent with pH-based replica exchange. J Chem Theory Comput. 2011;7(8):2617–2629. doi: 10.1021/ct200146j. [DOI] [PMC free article] [PubMed] [Google Scholar]
- 19.Brooks BR, et al. CHARMM: The biomolecular simulation program. J Comput Chem. 2009;30(10):1545–1614. doi: 10.1002/jcc.21287. [DOI] [PMC free article] [PubMed] [Google Scholar]
- 20.Radou G, Dreyer FN, Tuma R, Paci E. Functional dynamics of hexameric helicase probed by hydrogen exchange and simulation. Biophys J. 2014;107(4):983–990. doi: 10.1016/j.bpj.2014.06.039. [DOI] [PMC free article] [PubMed] [Google Scholar]
- 21.Comeau SR, Gatchell DW, Vajda S, Camacho CJ. ClusPro: A fully automated algorithm for protein-protein docking. Nucleic Acids Res. 2004;32(Web Server issue):W96–W99. doi: 10.1093/nar/gkh354. [DOI] [PMC free article] [PubMed] [Google Scholar]
- 22.Fuhrop JH, Smith KM, editors. Porphyrins and Metalloporhyrins. Elsevier; Amsterdam: 1975. pp. 804–807. [Google Scholar]
- 23.Houde D, Berkowitz SA, Engen JR. The utility of hydrogen/deuterium exchange mass spectrometry in biopharmaceutical comparability studies. J Pharm Sci. 2011;100(6):2071–2086. doi: 10.1002/jps.22432. [DOI] [PMC free article] [PubMed] [Google Scholar]
- 24.Guttman M, Weis DD, Engen JR, Lee KK. Analysis of overlapped and noisy hydrogen/deuterium exchange mass spectra. J Am Soc Mass Spectrom. 2013;24(12):1906–1912. doi: 10.1007/s13361-013-0727-5. [DOI] [PMC free article] [PubMed] [Google Scholar]
- 25.Fiser A, Do RKG, Săli A. Modeling of loops in protein structures. Protein Sci. 2000;9(9):1753–1773. doi: 10.1110/ps.9.9.1753. [DOI] [PMC free article] [PubMed] [Google Scholar]
- 26.Khandogin J, Brooks CL., 3rd Constant pH molecular dynamics with proton tautomerism. Biophys J. 2005;89(1):141–157. doi: 10.1529/biophysj.105.061341. [DOI] [PMC free article] [PubMed] [Google Scholar]
- 27.Im W, Lee MS, Brooks CL., 3rd Generalized born model with a simple smoothing function. J Comput Chem. 2003;24(14):1691–1702. doi: 10.1002/jcc.10321. [DOI] [PubMed] [Google Scholar]
- 28.Ellis CR, Shen J. pH-dependent population shift regulates BACE1 activity and inhibition. J Am Chem Soc. 2015;137(30):9543–9546. doi: 10.1021/jacs.5b05891. [DOI] [PMC free article] [PubMed] [Google Scholar]
- 29.Mackerell AD, Jr, Feig M, Brooks CL., 3rd Extending the treatment of backbone energetics in protein force fields: Limitations of gas-phase quantum mechanics in reproducing protein conformational distributions in molecular dynamics simulations. J Comput Chem. 2004;25(11):1400–1415. doi: 10.1002/jcc.20065. [DOI] [PubMed] [Google Scholar]
- 30.Hoover WG. Canonical dynamics: Equilibrium phase-space distributions. Phys Rev A Gen Phys. 1985;31(3):1695–1697. doi: 10.1103/physreva.31.1695. [DOI] [PubMed] [Google Scholar]
- 31.Feller SE, Zhang Y, Pastor RW, Brook BR. Constant pressure molecular dynamics simulation: The Langevin piston method. J Chem Phys. 1995;103:4613–4621. [Google Scholar]
- 32.Essmann U, et al. A smooth particle mesh Ewald method. J Chem Phys. 1995;103:8577–8593. [Google Scholar]
- 33.Ryckaert JP, Ciccotti G, Berendsen HJC. Numerical integration of the cartesian equations of motion of a system with constraints: Molecular dynamics of n-alkanes. J Comput Phys. 1977;23:327–341. [Google Scholar]
- 34.Chen J, Im W, Brooks CL., 3rd Balancing solvation and intramolecular interactions: Toward a consistent generalized Born force field. J Am Chem Soc. 2006;128(11):3728–3736. doi: 10.1021/ja057216r. [DOI] [PMC free article] [PubMed] [Google Scholar]
- 35.Babu CS, Lim C. Theory of ionic hydration: Insights from molecular dynamics simulations and experiment. J Phys Chem B. 1999;103:7958–7968. [Google Scholar]
- 36.Pronk S, et al. GROMACS 4.5: A high-throughput and highly parallel open source molecular simulation toolkit. Bioinformatics. 2013;29(7):845–854. doi: 10.1093/bioinformatics/btt055. [DOI] [PMC free article] [PubMed] [Google Scholar]
- 37.Hess B, Bekker H, Berendsen HJC, Fraaije JGEM. LINCS: A linear constraint solver for molecular simulations. J Comput Chem. 1997;18:1463–1472. [Google Scholar]
- 38.Parrinello M, Rahman A. Polymorphic transitions in single crystals: A new molecular dynamics method. J Appl Phys. 1981;52:7182–7190. [Google Scholar]
- 39.Englander SW, Kallenbach NR. Hydrogen exchange and structural dynamics of proteins and nucleic acids. Q Rev Biophys. 1983;16(4):521–655. doi: 10.1017/s0033583500005217. [DOI] [PubMed] [Google Scholar]
- 40.Bai Y, Milne JS, Mayne L, Englander SW. Primary structure effects on peptide group hydrogen exchange. Proteins. 1993;17(1):75–86. doi: 10.1002/prot.340170110. [DOI] [PMC free article] [PubMed] [Google Scholar]
- 41.Vendruscolo M, Paci E, Dobson CM, Karplus M. Rare fluctuations of native proteins sampled by equilibrium hydrogen exchange. J Am Chem Soc. 2003;125(51):15686–15687. doi: 10.1021/ja036523z. [DOI] [PubMed] [Google Scholar]
- 42.Best RB, Vendruscolo M. Structural interpretation of hydrogen exchange protection factors in proteins: Characterization of the native state fluctuations of CI2. Structure. 2006;14(1):97–106. doi: 10.1016/j.str.2005.09.012. [DOI] [PubMed] [Google Scholar]


