Significance
Commanding the swimming of micrometric objects subjected to thermal agitation is always challenging for both artificial and living systems. Now, artificial swimmers can be designed with self-propelling force that can be tuned at will. However, orienting such small particles to an arbitrary direction requires counterbalancing the random rotational diffusion. Here, we introduce a simple concept to reorient artificial swimmers, granting them a motion similar to the run-and-tumbling behavior of Escherichia coli. We show it using Janus particles with asymmetric surface coating and moving under an ac electric field. Moreover, we determine the optimal strategy and compare it with biological swimmers. Our results encourage additional investigation into dynamical behavior of colloidal particles as well as application to microscopic devices.
Keywords: active suspensions, self-propelled particles, Janus particles, run and tumble, feedback control
Abstract
Although making artificial micrometric swimmers has been made possible by using various propulsion mechanisms, guiding their motion in the presence of thermal fluctuations still remains a great challenge. Such a task is essential in biological systems, which present a number of intriguing solutions that are robust against noisy environmental conditions as well as variability in individual genetic makeup. Using synthetic Janus particles driven by an electric field, we present a feedback-based particle-guiding method quite analogous to the “run-and-tumbling” behavior of Escherichia coli but with a deterministic steering in the tumbling phase: the particle is set to the run state when its orientation vector aligns with the target, whereas the transition to the “steering” state is triggered when it exceeds a tolerance angle . The active and deterministic reorientation of the particle is achieved by a characteristic rotational motion that can be switched on and off by modulating the ac frequency of the electric field, which is reported in this work. Relying on numerical simulations and analytical results, we show that this feedback algorithm can be optimized by tuning the tolerance angle . The optimal resetting angle depends on signal to noise ratio in the steering state, and it is shown in the experiment. The proposed method is simple and robust for targeting, despite variability in self-propelling speeds and angular velocities of individual particles.
The physics of active suspensions made significant progress during the past decades, and it is now possible to build artificial microscopic particles able to self-propel in a fluid. The range of possible applications of such swimmers is wide, with fascinating perspectives: targeted drug delivery (1), bottom-up assembly of very small structures (2), mixing or automatic pumping in microfluidic devices (3), and design of new microsensors and microactuators in microelectromechanical systems (4) or artificial chemotactic systems (5) to name a few. A lot of manmade microscopic swimmers fall into the category of “Janus” particles, which share the same property: an asymmetric structure inducing a breaking of symmetry of the interactions with the surrounding fluid, resulting in a self-propelling (SP) force. Several physical phenomena can be at the origin of this force: local temperature gradients induced by a defocused laser beam (6) (thermophoresis), enzymatic catalysis of chemical reactions by a coated surface (3, 5, 7–9), or electrostatic interactions between surface charges and the ions of the solution (10) [induced charge electrophoresis (ICEP)].
If several methods are known to generate SP forces for Janus particles, guiding their motion remains a challenge. The biggest difficulty consists in controlling their orientation, a particularly delicate task when working with microscopic objects subjected to thermal fluctuations. Swimmers need to resist rotational diffusion by fixing or steering their orientation to reach specified targets or follow given trajectories. Experimental works showed that it was possible to lock the orientation of catalytic nanorods made of ferromagnetic materials using magnetic fields (11). Another interesting method involves visualizing the orientation of the particle at every moment and turning on the SP force only when it is directed to the right direction (12). In that approach, the reorientation process is “passive” in a sense that the experimentalist waits for rotational diffusion to correct the orientation of the particle.
In this paper, we use Janus particles driven by ICEP and introduce a method to control their trajectory with an “active” reorientation process. This concept consists of switching between two distinct modes of motion exhibited by the particles: an SP state and a regular rotation state. Such rotations had already been observed experimentally with doublets of catalytic Janus particles (13) or L-shaped SP swimmers moving by thermophoresis (14), but the origin and characteristics of these rotations are very different here. The Janus particle under feedback control exhibits a motion quite similar to the “run-and-tumbling” behavior observed for the bacteria Escherichia coli (15). However, the reorientation is not random but deterministic, which might be compared with the adaptive steering found in evolved organisms [e.g., phototaxis in Volvox carteri (16)]. Such a “hybrid” strategy enables a high efficiency while minimizing the complexity of the implementation. In the first part of this article, we will describe in detail the two different behaviors exhibited by our Janus particles. Based on these properties, the second part will be devoted to the experimental implementation of the proposed particle-guiding method. Finally, in the third part, we will present numerical simulations and analytical calculations showing how it is possible to optimize the feedback process.
Individual Behavior of Janus Particles
Our experimental device is described in detail in Materials and Methods. It is very similar to the one first introduced by Gangwal et al. (10): the SP motion of the particles is obtained by applying an ac electric field to the solution (Fig. 1). We can control the peak to peak amplitude and the frequency of the electric field, so that we have two control parameters. Janus particles can exhibit very interesting individual and collective behaviors depending on the values of (refs. 17 and 18 have detailed descriptions). In this work, we will focus on two particular individual types of motion: “active Brownian motion” (ABM) and rotations.
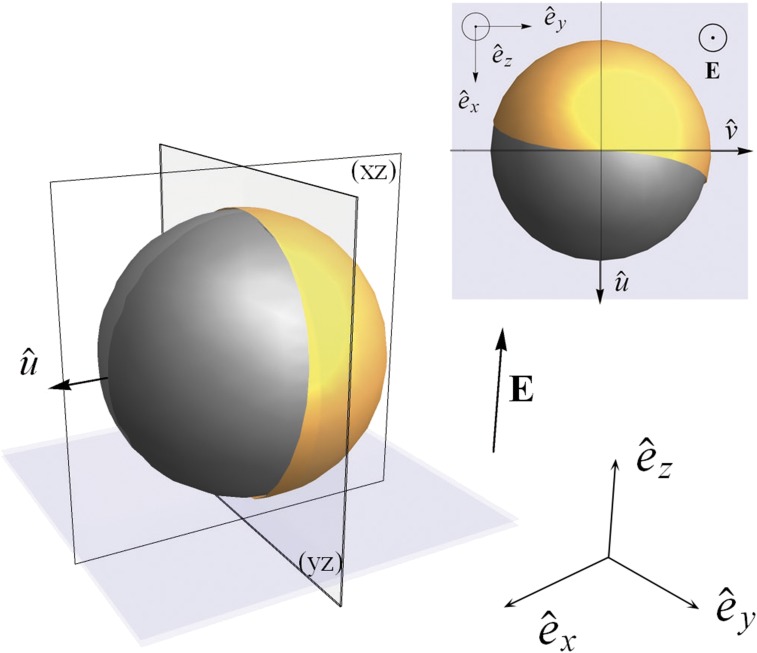
Fig. 1.
3D scheme of a Janus particle with an electric field E parallel to . (Inset) Top view of a chiral Janus particle slightly asymmetric with respect to the plane.
ABM.
As soon as E is applied to the solution, the particles are attracted by the electrodes, and restoring forces lock the cross-section across the equator between two hemispheres parallel to the electric field ( axis) (19). The combined effects of gravity and electric forces transport the particles close to the bottom electrode. For low frequencies (roughly between and ), Janus particles self-propel at a constant speed in the direction of the dielectric hemisphere (10): this range of parameters is the SP region. For higher frequencies (), the direction of propagation is reversed, and the particles move in the direction of the metal side: this range of parameters is the inverse self-propelling (ISP) region (18). In both cases, their motion is 2D in the plane (xy) perpendicular to the electric field (Fig. 1). The direction and amplitude of their velocity depend on the two control parameters . For lower frequencies, basically increases when increases or decreases.
The self-propulsion mechanism in the SP region is well-understood in the framework of ICEP (20, 21): the induced charge electroosmotic (ICEO) flow around the particle—resulting from the electroosmotic flow of counterions in double layers on the metal and dielectric hemispheres—is asymmetric because of the different polarizabilities of the hemispheres. ICEO fluid flow induces a constant SP force F acting on the particles in the direction of the dielectric hemisphere as well as restoring forces, preventing them from rotating around or . The ICEP theory predicts that . However, the origin of F in the ISP region still lacks a theoretical explanation. In the SP or ISP regions, the particles exhibit an ABM: because they are subjected to rotational diffusion around the axis, their motion will be diffusive at long times with short-time positive autocorrelation in velocity. The persistence length of their trajectories is given by , where is the rotational diffusion coefficient.
Rotations.
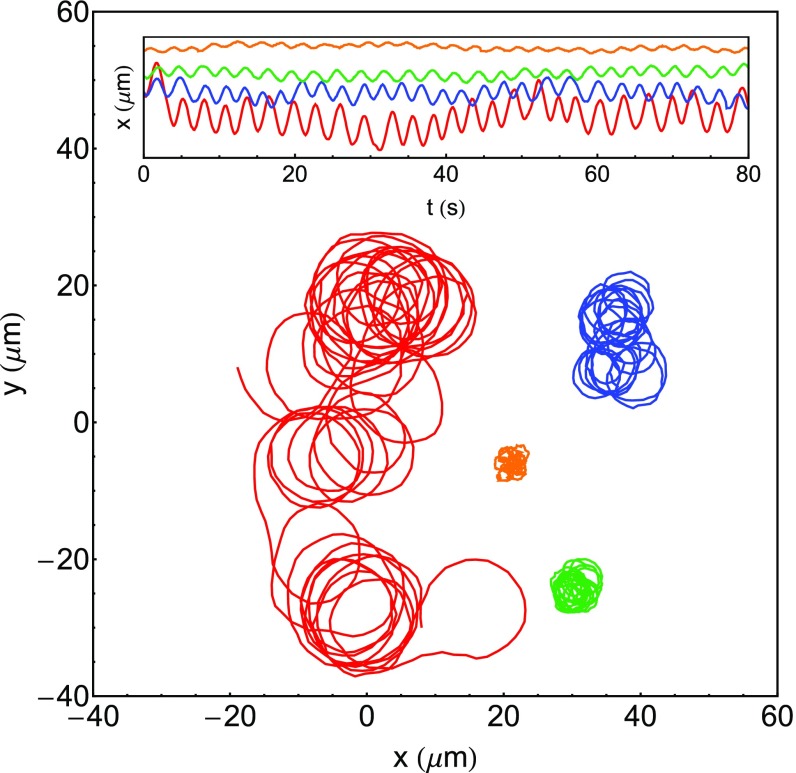
Instead of ABM, we found that some particles would rather exhibit noisy rotations, moving in circular trajectories at a constant frequency (Fig. 2). The direction of rotation (clockwise or counterclockwise) depends on the particle and never changes after the rotations have been initiated: a particle turning clockwise will keep turning clockwise as long as the electric field is on. Therefore, each particle has its own rotation axis. However, it also depends on the orientation of the particle at , when is applied: a particle turning clockwise might turn counterclockwise if we turn off the electric field, wait a few seconds, and then turn it on again. This change of direction might be caused by turning the particle upside down along the z axis. A given particle can often switch between ABM and rotations: typically, it will exhibit ABM at high frequencies and rotations at low . However, it should be noted that the transition frequency for which the switching occurs is slightly dependent on the particle.
Fig. 2.
Rotations of a Janus particle for and (red), (blue), (green), and (orange). Inset corresponds to the time evolution of the projection of these trajectories on the x axis.
How can we explain these rotations? It is clear that the Janus particles are subjected to not only an SP force F but also, a torque M inducing the rotations. If we look at the particles at very high magnification using an electron microscope, the frontier between the metal side and the polystyrene side does not appear perfectly straight (for example, figure 1 of ref. 22).
The two quadrants of metal-coated hemisphere separated by the plane can then be covered by different quantities of metal as shown in Fig. 1, Inset. Therefore, we can assume that each Janus particle has not only breaking front–back symmetry but also, breaking chiral symmetry, so that the ICEO flow will also be unbalanced with respect to the mirror plane. The strength of the resulting torque depends on how asymmetric a given particle is with respect to and its sign on the initial orientation of the particle. Note that the possibility of chiral Janus particle produced by coating imperfection has been mentioned in the literature (23).
The experimental values of and can be extracted from the trajectories of the particles. The motion of a Janus particle can be accurately described by the following system of coupled Langevin equations:
| [1] |
And are the translational and rotational noises, such that , , , and , where is the unit matrix. and are the translational and rotational diffusion coefficients, respectively, and is the angle of the orientation unit vector , such that . This system can be solved exactly to get the analytical expression of the velocity autocorrelation function (Langevin Description and Autocorrelation Function):
| [2] |
The average velocity and rotational frequency of the particles are directly proportional to the force and torque, respectively:
| [3] |
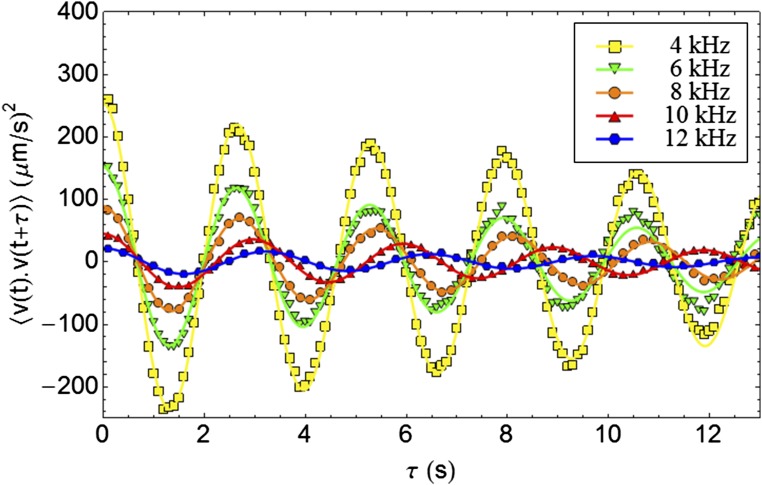
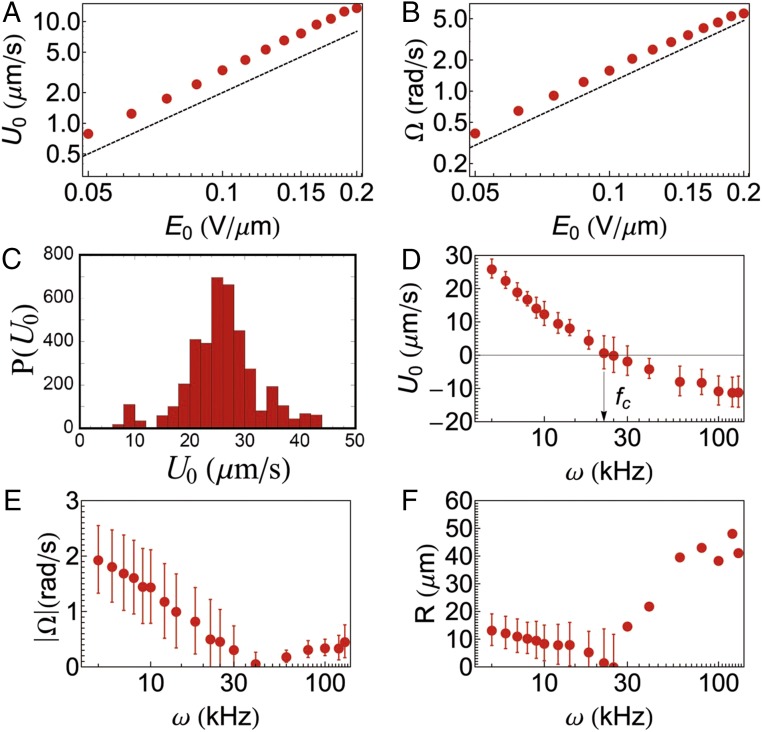
with and as the translational and rotational friction coefficients, respectively, which are related to and via the Einstein relation: and . Therefore, if F and M have the same origin, we should have and according to the ICEP theory. Eq. 2 can be used to fit the experimental curves of the autocorrelation function, thus extracting the values of and (see Fig. 9). The evolution of and with respect to is shown on Fig. 3 A and B. Both of them are proportional to , confirming that and have indeed the same origin.
Fig. 9.
Time evolution of the autocorrelation function of particles of diameter = 3 for different frequencies . The symbols are experimental measurements, and the lines of the same colors correspond to a fit using Eq. 2. We have three fitting parameters: , , and . Yellow squares indicate , , and . Green triangles indicate , , and . Orange circles indicate , , and . Red triangles indicate , , and . Blue hexagons indicate , , and . The averaged value of measured for 23 different frequencies is , which is in good agreement with the theoretical estimation. The large errors in estimated might be caused by inhomogeneity of coating at the surface of the electrode.
Fig. 3.
(A and B) Typical evolution of the velocity and rotational frequency with respect to the electric field in log–log plot for a frequency . The dashed lines are of the slopes , highlighting that and . (C) Velocity distribution for and . (D–F) Frequency dependencies of , , and the radius of rotation , respectively, in semilog plots for an electric field . Note that the direction of propagation of the particles is reversed at the cross-over frequency . The error bars are SDs at each frequency calculated for 13 different particles. was estimated by for and direct fitting of the trajectories to avoid large deviations for small at .
Fig. 3 D and E shows the evolution of and with respect to . The large relative error bars show that this evolution is, on average, more particle-dependent. In the SP region, and decrease with respect to this parameter, and one can note that decreases more quickly than . The type of motion of the particle can be characterized by its rotation radius ( does not depend on , because both and are proportional to ). When is about the size of the particle , the motion is considered rotational. However, if , the motion is dominated by SP force and equivalent to an ABM. The evolution of is nonmonotonic as shown in Fig. 3F: the radius of rotation first decreases when increases, because decreases more rapidly than in the SP region. When switching to the ISP region, increases again, and for high frequencies (typically ), the motion of the particles becomes similar to an ABM, so that it becomes difficult to measure or . For this reason, we are not showing the error bars in Fig. 3F for the highest values of .
Feedback Control of a Janus Particle
The two distinct behaviors that we have described so far—switching between ABM and rotations—remind us of the well-studied motion displayed by some bacteria: the run-and-tumbling chemotaxis. Inspired by this kind of motion, we present and show a method to transport an individual Janus particle to a given position in the 2D space. The key of this method is to control the direction of propagation of a given particle by switching between ABM and rotations by shifting the ac frequency of the applied electric field at the right moment (Fig. 4): when the orientation vector of the particle is directed to the target, is set to a high value, so that ABM is induced. As soon as the particle is misdirected because of the thermal noise, is set to low values, and the particle starts rotating. Its orientation vector then evolves continuously until it points once again to the target, at which moment the particle is set back to the ABM state.
Fig. 4.
Schematic picture representing the algorithm of feedback manipulation. The concentric red and white circles are the target. In each frame, we plot the trajectory of the particle (blue) and its instantaneous velocity vector (red arrow). We then compare it with the vector pointing at the target (black dotted arrow) given the tolerance angles that we have chosen: (yellow circular sector) and (green circular sector). If is included in the yellow circular sector, the particle exhibits ABM, and its direction of propagation is more or less correct. If is included in the green circular sector, the particle rotates, but its orientation still needs to be reoriented. Thus, the control parameters are only switched when gets out of two circular sectors. Note that, when this happens, the direction of propagation of the particle is reversed (which is the reason why we chose this value for ).
Based on this simple idea, we developed a computer program that tracks a particle in real time and automatically applies the right control parameter to the system (a detailed implementation is in Materials and Methods). Suppose that we wish to transport a particle to a certain target located at in the 2D plane. At each frame captured by the camera, our program does the following operations.
-
i)
Get the current position .
-
ii)Compute its smoothed instantaneous velocity:
-
1.
is the number of frames used to smooth the instantaneous velocity. We assume that is roughly parallel to the orientation vector of the particle .
-
iii)Compute the vector pointing at the target and calculate the angle between the two vectors:
-
iv, a)
If the particle is in ABM state, compare with the ABM tolerance angle . If , the particle stays in ABM state. Otherwise, the particle is switched to rotation state by setting the control parameter to .
-
iv, b)
If the particle is in rotation state, compare with the rotation tolerance angle . If , the particle stays in rotation state. Otherwise, the particle is switched to ABM state by setting the control parameter to .
-
v)
Repeat from i.
As we have seen in the previous section, the values of and are specific to each particle. However, just like biological chemotaxis is robust to variability to gene expression or fluctuating environmental conditions, this algorithm can be used to control most of the particles, regardless of their variability. To achieve the most efficient transportation of particles, one needs to choose the parameters and , so that they maximize the persistence length and minimize the rotation radius. In other words, we want and for and for . Considering the characterization of the motion described in the previous section, we will use high amplitudes for , high frequencies for , and small frequencies . The values of these parameters have to be determined before initiating the feedback control. has to be well above the cross-over frequency, and has to be low enough to have small . The cross-over frequency is 20–30 kHz in pure water for the 3- particles. Therefore, typically, values of and are adequate, and we chose . It is important to note that, because we switch from low to high frequencies, we go from the SP to the ISP region, and the direction of the motion is reversed. Regarding the tolerance angles, we typically used and . In an ideal case, should be equal to . However, because is averaged over frames, there is always a small delay between and the actual orientation of the particle . To take this delay into account, we use a slightly smaller value for . Using a smoothed instant velocity is important to decrease the sensitivity of the algorithm to translational noise.
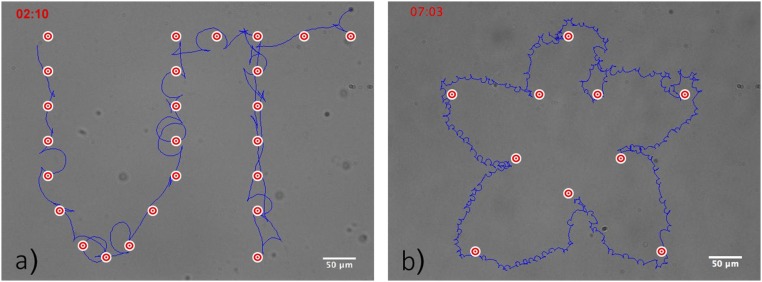
With this algorithm, we were successfully able to direct the motion of our Janus particles (Movies S1 and S2). The active reorientation process is particularly efficient: its typical timescale is less than 1 s, which is much faster than a passive reorientation by rotational diffusion determined by for a spherical particle of radius . Moreover, we do not have to be able to see the orientation of the particles to reorient them, because we can deduce from their instantaneous velocity. This method has an advantage if the orientation of a Janus particle is not easily accessible because of smallness of its size. The method enables us to not only send particles to a given target but also, design a trajectory of particles to a certain extent by giving a list of target coordinates sequentially. We were thus able to realize microtags as can be seen in Fig. 5. The control of the trajectory is, of course, not perfect, because the particle makes a turn with a small radius as visible as the trajectory having small loops in Fig. 5.
Fig. 5.
Examples of “microtag”: (A) the letters “UT” and (B) a cherry blossom flower. Both were obtained using the feedback control program and a list of target locations that appear as concentric red and white circles. The trajectory of the particle appears in blue.
Optimal Feedback Strategy
For this algorithm, the efficiency of the feedback depends on the tolerance angle . In principle, the feedback can be optimized by choosing the most appropriate value of . One way to quantify its efficiency is to measure the Péclet number, defined as the ratio between the time needed to diffuse a given distance and the time required to swim the same distance. To calculate it, we need to use the average velocity of a particle under feedback control given by
| [4] |
where and correspond to the average durations of one cycle of ABM and rotations, respectively, and is the average displacement during one cycle of ABM projected on the axis pointing to the target. The Péclet number is thus equal to
| [5] |
| [6] |
with as the initial distance between the particle and the target and as the mass Péclet number. Eq. 6 shows that Pe is directly proportional to , the chemotaxis index generally used to measure the accuracy of chemotaxis (24). To understand how the efficiency of the feedback control depends on , we ran numerical simulations by integrating the system of Eq. 1 using a standard Gillespie algorithm. We made several simplifying assumptions: we neglected the influence of the translational noise, did not consider the reversion of self-propulsion, and assumed that the radius of rotation is so small that the particle does not actually move translationally in the rotation state. When the control parameters are , the motion of the particle under feedback control is thus described by
| [7] |
However, when the control parameters are , the equations of motion become
| [8] |
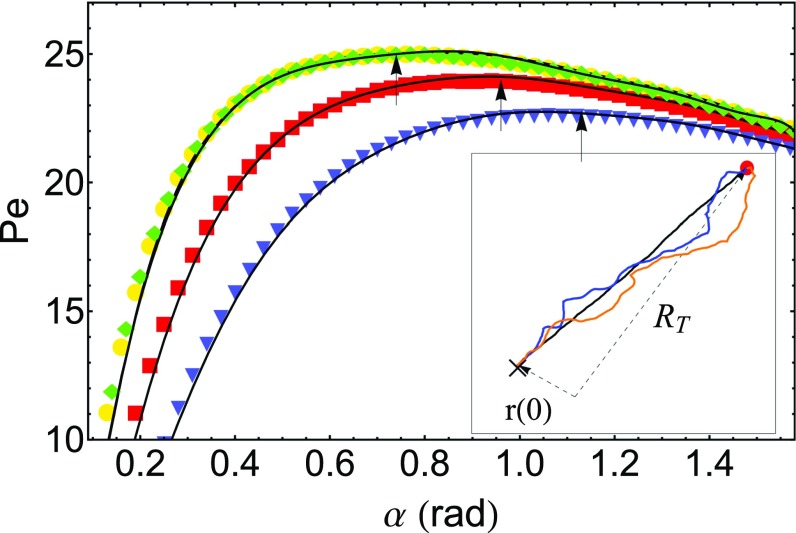
Integrating these two systems of equations, we obtained trajectories of particles for various tolerance angles and extracted the values of , , and . Typical trajectories of these simulations are shown in Fig. 6, Inset. At first glance, small tolerance angles seem to be optimum, because they correspond to the shortest path to the target. However, Fig. 6 shows that small values of actually correspond to small Péclet numbers. Indeed, there is a balance to be found between taking the shortest path to the target and wasting too much time in the reorientation process. Note that the optimum angle depends on the value of the angular frequency and the value of .
Fig. 6.
Evolution of the Péclet number with respect to obtained numerically for a target at distance and . Yellow shows and . Red shows and . Blue shows and . Green shows and . for all of the results shown here. The black curves correspond to the theoretical predictions given by Eq. 20, and the arrows indicate the maximum Péclet number. (Inset) Examples of numerical trajectories of a particle under feedback control for several values of tolerance angle: (black), (blue), and (orange). The red circle corresponds to the position of the target.
Obtaining a theoretical estimate of the Péclet number with respect to the tolerance angle is quite cumbersome; thus, we use a crude approximation: we assume that the particle is heading right to the target in the “run” state. In other words, we neglect the curvature of the trajectory, which is reasonable for small tolerance angles or if the particle is very far away from the target. This approximation is pertinent in our simulations, because the persistence length is much smaller than the initial distance to the target. Therefore, the angle between the particle and the target will only be modified by the rotational diffusion [which means that ]. If a particle initially has the right orientation [], it will thus need to be reoriented again after an average time given by
| [9] |
A simple integration of the first equation of Eq. 7 gives us
| [10] |
The average displacement is thus given by
| [11] |
where we have averaged using the first-passage time distribution and the probability density function of . is the normalized probability density function of a 1D variable only subjected to thermal fluctuations, with absorbing boundary conditions at . Therefore, we must have at all times
| [12] |
| [13] |
Using the mirror image method (25), it is easy to show that is equal to
| [14] |
where is a normalization function required to satisfy Eq. 13 and given by
| [15] |
As for the first-passage time distribution , it is given by the following equation for these boundary conditions (26):
| [16] |
Injecting Eqs. 14 and 16 into Eq. 11 and using the change of variable , we finally obtain
| [17] |
Note that the integral only depends on the value of the tolerance angle. We could not find an analytical expression for it, but it can be evaluated numerically.
Let us now focus on Eq. 8. Integrating the second equation gives us the evolution of the orientation angle with respect to the time
| [18] |
To correct the orientation of the particle, needs to be changed by either or , depending on the sign of . The average reorientation time is thus given by
| [19] |
Using all of the previous results, the equation for the Péclet number becomes
| [20] |
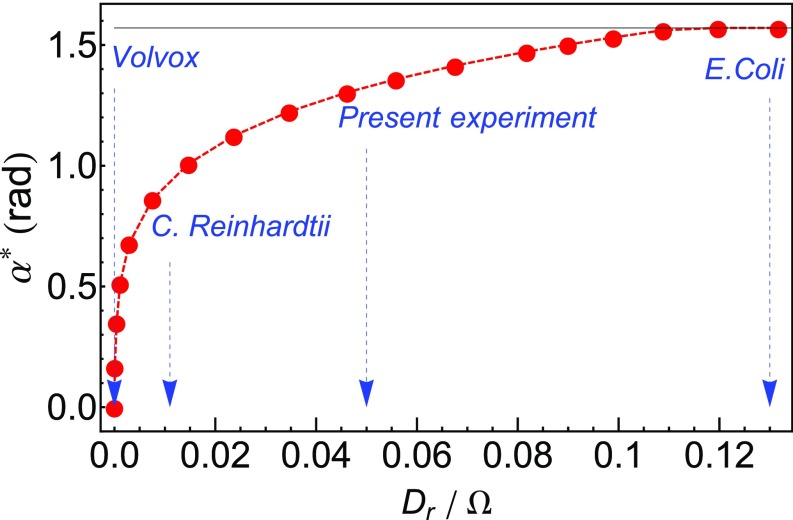
We have compared it with the results of simulations. As we can see in Fig. 6, the agreement is excellent. We can thus determine the optimum value of tolerance angle corresponding to the maximum Péclet number for a given set of control parameters. According to Eq. 20, Pe is linearly proportional to and depends on and the ratio (Fig. 6). Therefore, should be a function of this sole parameter (i.e., signal to noise ratio). This statement is in good agreement with analytical results obtained for the chemotaxis of the bacteria E. coli that showed that the optimum angle for their run-and-tumbling motion only depends on the ratio , where is the average time required to reorient the bacteria (27). In our case, this time is clearly determined by the strength of the torque , so that the efficiency depends instead on . Fig. 7 highlights that fast reorientations or weak noises (low ) are associated with small optimum angles . For very slow reorientations (), saturates at . Note that, for reasonable values of the parameters ( and ; thus, ), , which is larger than the empirical value used in the experiments; thus, in principle, the Péclet number could be improved further.
Fig. 7.
Evolution of the optimum tolerance angle with respect to for . The blue dashed arrows show typical values of for our Janus particles C. reinhardtii, Volvox, and E. coli.
In biology and biophysics, strategies of run-and-tumble and steering motion have been discussed for different sizes of swimming organisms, such as E. coli (27), Chlamydomonas reinhardtii (28), and Volvox (16). Therefore, it is interesting to compare them in regard to the signal to noise ratio depicted in Fig. 7. In the case of E. coli (, , and ), can be deduced from the estimate by assuming that average rotation angle of tumbling is about . However, E. coli does not have directional sensors or steering control, and its flagella can only reverse the direction of rotation. Thus, it takes a strategy of random reorientation. C. reinhardtii (, , , and ) is two times larger than our Janus particle and five times larger than E. coli; thus, it is 100 times less sensitive to rotational diffusion. It has a photoreceptor and could have steering strategy, but in fact, it also takes run-and-tumble strategy. It was discovered that C. reinhardtii can switch synchronized and nonsynchronized beating between two flagella for making straight and tumbling motions, respectively (28–30).
Volvox, however, is a large multicellular organism that carries photoreceptors and thousands of flagella (, , , and ). Our theory gives , implying that continuous steering is the optimal for phototaxis of Volvox. In fact, Volvox coordinates thousands of flagella to make steering motion and even has an adaptation mechanism.
Finally, we consider two limiting cases. First, in the limit of (i.e., if steering accompanies no time cost), we have checked that Pe monotonously decreases in , so that the optimal angle is always . This situation corresponds to a “perfect” steering case, where the particle swims straight to the target to minimize the travel distance. The second case that we want to consider is a passive reorientation: when , we now wait for the rotational diffusion to reorient it. In that case, the average reorientation duration is given by
| [21] |
Using this new equation for , Pe becomes monotonously increasing in , so that . Summarizing above, even if the particle (or cell) has an ability to steer its heading angle, run and tumbling (steering) with the optimal resetting angle is a better strategy compared with continuous steering for noisy environments.
Discussion
The feedback control method presented in this paper mimics the run and tumbling of E. coli but combined with active steering; thus, it is a simple but more efficient method to transport microscopic swimmers under thermal fluctuations. The added ability of deterministic active reorientation achieves more efficient transportation of the particle than the natural run and tumbling. It also has several advantages over other conventionally used micromanipulation techniques: laser tweezers, for example, use a high-power laser that could damage fragile samples and can be tricky to use, because particles often jump out of the confining potential (22).
We have also addressed the problem of optimizing the feedback and observed some interesting insights. The active reorientation decouples the ABM and the reorientation process in contrast to passive reorientation. Because of this decoupling, we showed that the optimal acceptance angle is a function of . Remarkably, because the timescale of passive reorientation is determined by , which scales in the cubic order of the radius, our method becomes particularly effective when the particles are relatively large. For instance, in the case of a particle of diameter , and s in our experiments, leading to more than 10 times enhancement of Peclet number. For even smaller particles, the gain of active reorientation becomes less significant as approaches , although the magnitude of is tunable by the applied electric field.
Although the optimal tolerance angle is determined by , our theory also predicts the robustness of the proposed algorithm. This robustness is guaranteed by the fact that Pe has a quite shallow shoulder toward large , at least for the range of parameters relevant to this experiment. In the real world, individual particles may possess variable or experience an effectively inhomogeneous from the environment. It may also be possible that the exact position of the target might not be known or that estimation of the orientation might not be precise, contributing to a poor resolution of . The final Péclet number, however, is weakly affected by these noises thanks to the broad tolerance of optimal . That tolerance allowed us to control the motion of particles, despite the strong variability in their behavior.
The key of our method is in our finding of the peculiar rotational motion of Janus particles that can be switched on and off by changing the parameters of the electric field. Although the mechanism of this rotation is not yet fully understood, experimental measurements of showed that it was proportional to , implying that the torque as well as the force may originate from an asymmetric flow field around the particle generated by ICEO. The other parameter, , has been poorly explored in the framework of ICEP. Additional experimental studies as well as theoretical works should be addressed. Our results also suggested that geometrical factors, such as chirality of the particle, can play a critical role in determining the swimming behavior of the particle. An interesting challenge would be to find a way to artificially fabricate “Brahma particles,” which such as the Hindu god, would have four “heads” (31). These swimmers would have two well-designed axes of asymmetry: one used to propel the particle and the other used to induce “switchable” rotations. Our experiment provides a proof of principle demonstration of such an idea. Our results encourage additional quest toward engineering functional artificial swimmers.
Materials and Methods
Making of Janus Particles.
We used polystyrene spheres of diameter m. A droplet of a solution of these polystyrene spheres is then dragged on a glass slide by a linear motor at the appropriate speed to obtain a monolayer of particles (32). We do not need a perfect crystal in our case, but it is important that there is no particle on top of each other. Using thermal evaporation, one of their hemispheres is then coated by thin layers of chromium and gold with nm and nm. The other hemisphere facing the glass slide remains bare polystyrene, so that the particles have two hemispheres with different polarizabilities. After the coating process, the particles are detached from their substrate using mild sonification and suspended in ion exchange water. The observation of the particles at high magnification shows that they are almost always chiral (Fig. 1, Inset), which is caused by a fast slightly slanted evaporation process. Note that the amount of Janus particles exhibiting rotations at low field amplitude increases when the metal layers is quite thick. For example, particles with nm rarely exhibit rotations. Making chiral Janus particles thus requires the depositing of large-enough quantities of metal. The dispersion of the radius of rotation of particles is relatively large compared with that of . However, the curve dependence on frequency is robust as shown in Fig. 3 D and E. The switching of increasing radius occurs around the cross-over frequency , at which the velocity of the particles reverses. It is known that depends on the ion concentration and the diameter of the particles (33); is typically 20–30 kHz for water and increases with increasing ion concentration.
Indium Tin Oxide Electrodes.
A droplet of a suspension of Janus particles is then put in between two indium tin oxide (ITO) electrodes sandwiching a spacer made of stretched Parafilm. The cell height is varied between m and m, and is calculated using the unit of volts per micrometer. Using a function generator connected to the ITO slides, we apply a vertical ac electric field E to the solution, such that . To prevent the particles from sticking to the bottom electrode, we apply a surface treatment to the ITO glass slides: the slides are exposed to a strong plasma for several minutes and then immersed in a 5% (vol/vol) solution of Pluronic F-127 (a nonionic copolymer surfactant) for more than 1 h. They are then washed with water to remove the excess of Pluronic F-127. By coating the surface of the electrodes with this surfactant, we significantly reduce the risks of adhesion. As an alternative procedure, we coated the electrode with SiO2. The latter procedure is very effective to prevent sticking.
Tracking and Feedback.
Throughout the experiment, particles were imaged using 10, N.A. = 0.3 objective lens mounted on a standard inverted microscope. Particles were illuminated with an incoherent light source, and the transmitted light was captured using a CCD camera with 512 512 pixels at the frame rate of 100 frames per second. Tracking and feedback were done by a home-built LabVIEW program. Real-time tracking was initiated manually by feeding the program with the position of the particle of interest. Then, for subsequent frames captured by camera, the small region of interest around the target particle was extracted and thresholded to obtain a binary image. The center of the mass was calculated from this binary image, and the updated particle coordinate was passed down to the next acquisition loop. At the same time, coordinate information was sent to the feedback loop, where it calculated the angle . The feedback loop directly communicates with the function generator via universal serial bus connection and updated the appropriate control parameters .
Langevin Description and Autocorrelation Function
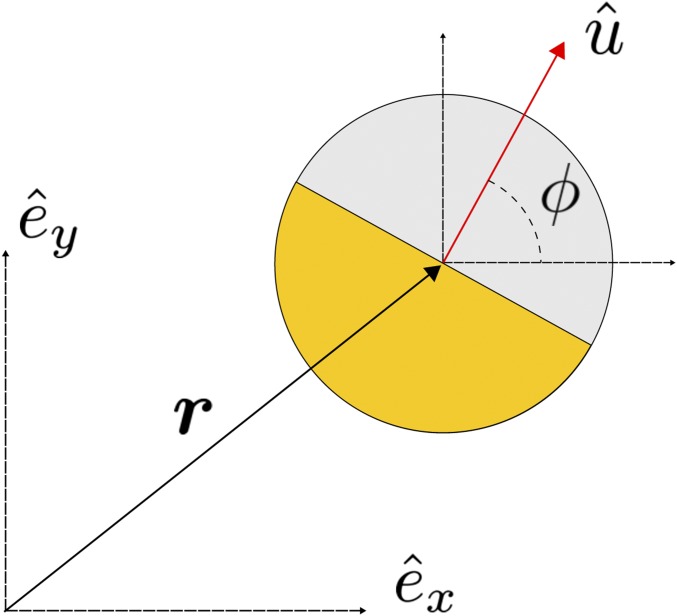
The particles move at a constant speed , rotate at the frequency , and are subjected to translational and rotational noises and , respectively, with identical properties to the ones that we gave below Eq. 1 (Fig. 8). If we assume that their motion is overdamped, we can thus write the following system of Langevin equations as
| [22] |
This model had already been studied to get an analytical expression for the mean square displacement of L-shaped artificial swimmers (16), but here, we will focus on the autocorrelation function instead. The second equation can easily be integrated to get
| [23] |
being a white noise, we have
| [24] |
According to Eq. 23, is a sum of Gaussian variables and therefore, a Gaussian itself. Because we just calculated its first and second moments, we can deduce the expression of the probability density
| [25] |
and the Green function
| [26] |
Fig. 8.
2D scheme of a Janus particle.
The velocity autocorrelation function of a particle at time is given by
| [27] |
Here, represents an ensemble average given for an arbitrary function by
| [28] |
Injecting Eqs. 25 and 26 into Eq. 28, we can calculate the two averages of Eq. 27 and find as a final expression for the velocity autocorrelation function
| [29] |
Strictly speaking, this expression diverges at , but the system of Langevin equations (Eq. 22) is actually only valid at times greater than the typical collision time of the heat bath. We can thus neglect the first term. If we use the expressions of the average velocity of the particles and the angular velocity , we recover Eq. 2. The agreement with the experimental results is excellent, such as can be seen on Fig. 9.
Supplementary Material
Acknowledgments
We thank Kyogo Kawaguchi and Daiki Nishiguchi for helpful discussions. This work was supported by KAKENHI (Grant-in-Aid for Scientific Research on Innovative Areas) Grants 25103004, 268 Fluctuation & Structure and 12F02327 from the Ministry of Education, Culture, Sports, Science, and Technology.
Footnotes
The authors declare no conflict of interest.
This article is a PNAS Direct Submission.
This article contains supporting information online at www.pnas.org/lookup/suppl/doi:10.1073/pnas.1616013114/-/DCSupplemental.
References
- 1.Sundararajan S, Lammert PE, Zudans AW, Crespi VH, Sen A. Catalytic motors for transport of colloidal cargo. Nano Lett. 2008;8:1271–1276. doi: 10.1021/nl072275j. [DOI] [PubMed] [Google Scholar]
- 2.Ismagilov RF, Schwartz A, Bowden N, Whitesides GM. Autonomous movement and self-assembly. Angew Chem Int Ed Engl. 2002;41:652–654. [Google Scholar]
- 3.Paxton WF. Catalytically induced electrokinetics for motors and micropumps. J Am Chem Soc. 2006;128:14881–14888. doi: 10.1021/ja0643164. [DOI] [PubMed] [Google Scholar]
- 4.Fennimore AM. Rotational actuators based on carbon nanotubes. Nature. 2003;424:408–410. doi: 10.1038/nature01823. [DOI] [PubMed] [Google Scholar]
- 5.Howse J. Self-motile colloidal particles: From directed propulsion to random walk. Phys Rev Lett. 2007;99:048102. doi: 10.1103/PhysRevLett.99.048102. [DOI] [PubMed] [Google Scholar]
- 6.Jiang H-R, Yoshinaga N, Sano M. Active motion of a Janus particle by self-thermophoresis in a defocused laser beam. Phys Rev Lett. 2010;105:268302. doi: 10.1103/PhysRevLett.105.268302. [DOI] [PubMed] [Google Scholar]
- 7.Fournier-Bidoz S, Arsenault AC, Manners I, Ozin GA. Synthetic self-propelled nanorotors. Chem Commun. 2004;4:441–443. doi: 10.1039/b414896g. [DOI] [PubMed] [Google Scholar]
- 8.Golestanian R, Liverpool TB, Ajdari A. Propulsion of a molecular machine by asymmetric distribution of reaction products. Phys Rev Lett. 2005;94:220801. doi: 10.1103/PhysRevLett.94.220801. [DOI] [PubMed] [Google Scholar]
- 9.Paxton W. Catalytic nanomotors: Autonomous movement of striped nanorods. J Am Chem Soc. 2004;126:13424–13431. doi: 10.1021/ja047697z. [DOI] [PubMed] [Google Scholar]
- 10.Gangwal S, Cayre O, Bazant M, Velev O. Induced-charge electrophoresis of metallodielectric particles. Phys Rev Lett. 2006;100:058302. doi: 10.1103/PhysRevLett.100.058302. [DOI] [PubMed] [Google Scholar]
- 11.Kline TR, Paxton WF, Mallouk TE, Sen A. Catalytic nanomotors: Remote-controlled autonomous movement of striped metallic nanorods. Angew Chem. 2002;117:754–756. doi: 10.1002/anie.200461890. [DOI] [PubMed] [Google Scholar]
- 12.Qian B, Montiel D, Bregulla A, Cichos F, Yang H. Harnessing thermal fluctuations for purposeful activities: The manipulation of single micro-swimmers by adaptive photon nudging. Chem Sci. 2013;4:1420–1429. [Google Scholar]
- 13.Ebbens S, Jones RAL, Ryan AJ, Golestanian R, Howse JR. Self-assembled autonomous runners and tumblers. Phys Rev E Stat Nonlin Soft Matter Phys. 2010;82:015304. doi: 10.1103/PhysRevE.82.015304. [DOI] [PubMed] [Google Scholar]
- 14.Kümmel F. Circular motion of asymmetric self-propelling particles. Phys Rev Lett. 2013;110:198302. doi: 10.1103/PhysRevLett.110.198302. [DOI] [PubMed] [Google Scholar]
- 15.Berg HC, Brown DA. Chemotaxis in Escherichia coli analysed by three-dimensional tracking. Nature. 1972;239:500–504. doi: 10.1038/239500a0. [DOI] [PubMed] [Google Scholar]
- 16.Drescher K, Goldstein RE, Tuval I. Fidelity of adaptive phototaxis. Proc Natl Acad Sci USA. 2010;107:11171–11176. doi: 10.1073/pnas.1000901107. [DOI] [PMC free article] [PubMed] [Google Scholar]
- 17.Nishiguchi D, Sano M. Mesoscopic turbulence and local order in Janus particles self-propelling under an ac electric field. Phys Rev E Stat Nonlin Soft Matter Phys. 2015;92:052309. doi: 10.1103/PhysRevE.92.052309. [DOI] [PubMed] [Google Scholar]
- 18.Suzuki R, Jiang HR, Sano M. 2011. Validity of fluctuation theorem on self-propelling particles. arXiv:1104.5607.
- 19.Kilic MS, Bazant MZ. Induced-charge electrophoresis near a wall. Electrophoresis. 2011;32:614–628. doi: 10.1002/elps.201000481. [DOI] [PubMed] [Google Scholar]
- 20.Bazant M, Squires T. Induced-charge electrokinetic phenomena: Theory and microfluidic applications. Phys Rev Lett. 2004;92:066101. doi: 10.1103/PhysRevLett.92.066101. [DOI] [PubMed] [Google Scholar]
- 21.Squires TM, Bazant MZ. Breaking symmetries in induced-charge electro-osmosis and electrophoresis. J Fluid Mech. 2006;560:65–101. [Google Scholar]
- 22.Merkt FS, Erbe A, Leiderer P. Capped colloids as light-mills in optical traps. New J Phys. 2006;8:216. [Google Scholar]
- 23.Cordes T, et al. Plasmonics, tracking and manipulating, and living cells: General discussion. Faraday Discuss. 2015;184:451–473. doi: 10.1039/c5fd90093j. [DOI] [PubMed] [Google Scholar]
- 24.Endres RG, Wingreen NS. Accuracy of direct gradient sensing by single cells. Proc Natl Acad Sci USA. 2008;41:15749–15754. doi: 10.1073/pnas.0804688105. [DOI] [PMC free article] [PubMed] [Google Scholar]
- 25.Zauderer E. Partial Differential Equations of Applied Mathematics. 3rd Ed Wiley; New York: 2011. [Google Scholar]
- 26.Darling DA, Siegert AJF. The first passage problem for a continuous Markov process. Ann Math Stat. 1953;24:624–639. [Google Scholar]
- 27.Strong SP, Freedman B, Bialek W, Koberle R. Adaptation and optimal chemotactic strategy for E. coli. Phys Rev E. 1998;57:4604. [Google Scholar]
- 28.Polin M, Tuval I, Drescher K, Gollub JP, Goldstein RE. Chlamydomonas swims with “gears” in a eukaryotic version of run-and-tumble locomotion. Science. 2009;325:487–490. doi: 10.1126/science.1172667. [DOI] [PubMed] [Google Scholar]
- 29.Stocker R, Durham WM. Microbiology. Tumbling for Stealth? Science. 2009;325:400–402. doi: 10.1126/science.1177269. [DOI] [PubMed] [Google Scholar]
- 30.Uchida N, Golestanian R. Generic conditions for hydrodynamic synchronization. Phys Rev Lett. 2011;106:058104. doi: 10.1103/PhysRevLett.106.058104. [DOI] [PubMed] [Google Scholar]
- 31.Maeda K, Onoe H, Takinoue M, Takeuchi S. Controlled synthesis of 3D multi-compartmental particles with centrifuge-based microdroplet formation from a multi-barrelled capillary. Adv Mater. 2012;24:1340–1346. doi: 10.1002/adma.201102560. [DOI] [PubMed] [Google Scholar]
- 32.Prevo BG, Velev OD. Controlled rapid deposition of structured coatings from micro- and nanoparticle suspensions. Langmuir. 2004;20:2099–2107. doi: 10.1021/la035295j. [DOI] [PubMed] [Google Scholar]
- 33.Boymelgreen A, Yossifon G, Miloh T. Propulsion of active colloids by self-induced field gradients. Langmuir. 2016;32:9540–9547. doi: 10.1021/acs.langmuir.6b01758. [DOI] [PubMed] [Google Scholar]
Associated Data
This section collects any data citations, data availability statements, or supplementary materials included in this article.


