Significance
A cell’s proteins must be properly folded. Therefore, cells have chaperones that help other proteins, their clients, fold and not aggregate. The machinery is like a hospital: it assesses the “sickness” of the patient (finds improperly folded proteins), sends the patient to the right doctor (sorts the protein to the right chaperone), and cures the disease (folds or disaggregates the protein). How are sick proteins recognized and routed to the right chaperone? How does the machine handle different growth rates? Here, we model proteostasis. We find that it can handle any arbitrary client protein, that it spends the least energy on least sick proteins, and that the cell produces just enough chaperone to keep the proteome folded but no more.
Keywords: proteostasis, chaperone, protein folding, shields up, shields down
Abstract
Chaperones are protein complexes that help to fold and disaggregate a cell’s proteins. It is not understood how four major chaperone systems of Escherichia coli work together in proteostasis: the recognition, sorting, folding, and disaggregating of the cell’s many different proteins. Here, we model this machine. We combine extensive data on chaperoning, folding, and aggregation rates with expression levels of proteins and chaperones measured at different growth rates. We find that the proteostasis machine recognizes and sorts a client protein based on two biophysical properties of the client’s misfolded state (M state): its stability and its kinetic accessibility from its unfolded state (U state). The machine is energy-efficient (the sickest proteins use the most ATP-expensive chaperones), comprehensive (it can handle any type of protein), and economical (the chaperone concentrations are just high enough to keep the whole proteome folded and disaggregated but no higher). The cell needs higher chaperone levels in two situations: fast growth (when protein production rates are high) and very slow growth (to mitigate the effects of protein degradation). This type of model complements experimental knowledge by showing how the various chaperones work together to achieve the broad folding and disaggregation needs of the cell.
A major action of cells is proteostasis (1–4). A cell’s proteostasis “machine” is the collection of chaperones and synthesis and degradation processes that maintain the homeostatic balance of the folding and disaggregation of the cell’s proteins. It is a machine in the sense that it is an energy-driven cyclic device that has component parts that work together to create its action. Proteostasis can become unbalanced under stresses, such as temperature, osmotic shock, oxidation, or drugs, or different growth conditions. Proteome health can fail if the machine is pushed beyond its tipping point (for example, in cell aging, cancer, or neurodegenerative diseases, such as Alzheimer’s and Parkinson’s) (1, 2, 4, 5).
Much is now understood about the component parts (i.e., the structures of some chaperones, the folding equilibria and kinetics of isolated proteins in vitro, and the rates at which particular chaperones help fold and disaggregate particular proteins). The organism in which this is best understood is arguably Escherichia coli. What is not yet known is how the component chaperones act together as a machine on the many different proteins to meet the cell’s needs. It is not known how “decisions” are made for trafficking different proteins through different chaperones.
Cells have multiple types of chaperones. Also, different classes of proteins have different relationships with each chaperone (6). E. coli has four major chaperone systems: GroEL/GroES (GroE), DnaK/DnaJ/GrpE (KJE), Trigger Factor (TF), and ClpB (B) (7). Complex cells have more (8). E. coli proteins fall into three classes of interaction with GroEL (7): class I proteins do not need GroEL, class II proteins can use both GroEL and DnaK, and class III proteins use GroEL. In addition, about 80% of the cell’s proteins fall outside these three classes and fold spontaneously without chaperones. How does a “sick” (misfolded) protein choose the right chaperone system? How does the chaperone choose the right client protein?
Proteostasis Decisions Resemble Those Made by Hospitals and Patients
The decisions made by the proteostasis machine resemble those made when a patient enters a hospital. (i) Reveal the problem. The hospital determines the patient’s sickness and its severity. (ii) Sorting. It sends the patient to the right doctor. (iii) Repair. The doctor fixes the problem. Also, the procedures must be comprehensive, covering all possible patients and diseases. An interesting puzzle is how any arbitrary new protein that could be produced by evolution can be handled properly by a proteostasis network that has never seen that protein before.
The cell’s proteostasis machine (the hospital) must identify whether a protein (the patient) has a folding problem and how severe it is. How does the client protein present its condition to the proteostasis machine? Then, the client protein must be trafficked through the appropriate chaperone system, so that its folding problem can be repaired. We model here how those decisions are encoded in rate processes in the cell.
Dynamical Model of Proteostasis in E. coli
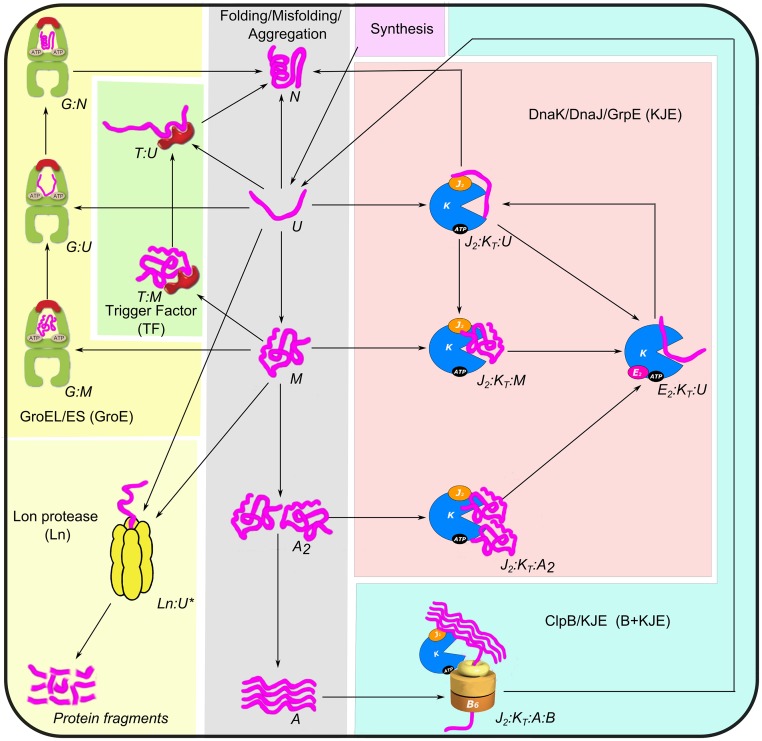
We model here dynamical proteostasis in E. coli, building on the FoldEco framework by Powers et al. (9). Our model captures the following properties: that proteins are synthesized; that they undergo the spontaneous processes of folding, misfolding, aggregation, or binding to TF; and that they undergo the active processes of chaperoning by the GroE (10), KJE, and B + KJE systems (11, 12) and degradation by Ln during cell growth. We modeled E. coli under steady-state conditions at C. Here in the text and Fig. 1, we just give an overview. More complete details are given in SI Appendix, Eqs. S2–S6, Figs. S1–S4, and Tables S1 and S2 (the rate parameters) and SI Appendix, Table S3 (the concentrations of proteins and respective chaperones). The model validation against 20 experimentally determined rate curves and the sensitivity analysis of the parameters are given in SI Appendix, Fig. S5 and Table S4, respectively.
Fig. 1.
Proteostasis network of E. coli. The six subsystems are folding/misfolding/aggregation (gray), the KJE chaperone system (magenta), the GroE chaperone system (light yellow), the B + KJE disaggregation system (cyan), TF-mediated folding (light green), and degradation by Lon (Ln) protease (light magenta). Protein synthesis () is indicated by arrows. The subscripts T and D refer to the ATP- and ADP-bound states of chaperones, respectively. For the sake of simplicity, some of the intermediate steps have been skipped, and multiple intermediates are merged together in the diagram. The detailed diagrams are shown in SI Appendix, Figs. S1–S4. The model includes cell growth rate (), which is not shown in the diagram. A, aggregate; E, GrpE; G, GroEL; J, DnaJ; K, DnaK.
Proteostasis Machine Performs Dynamical Sorting
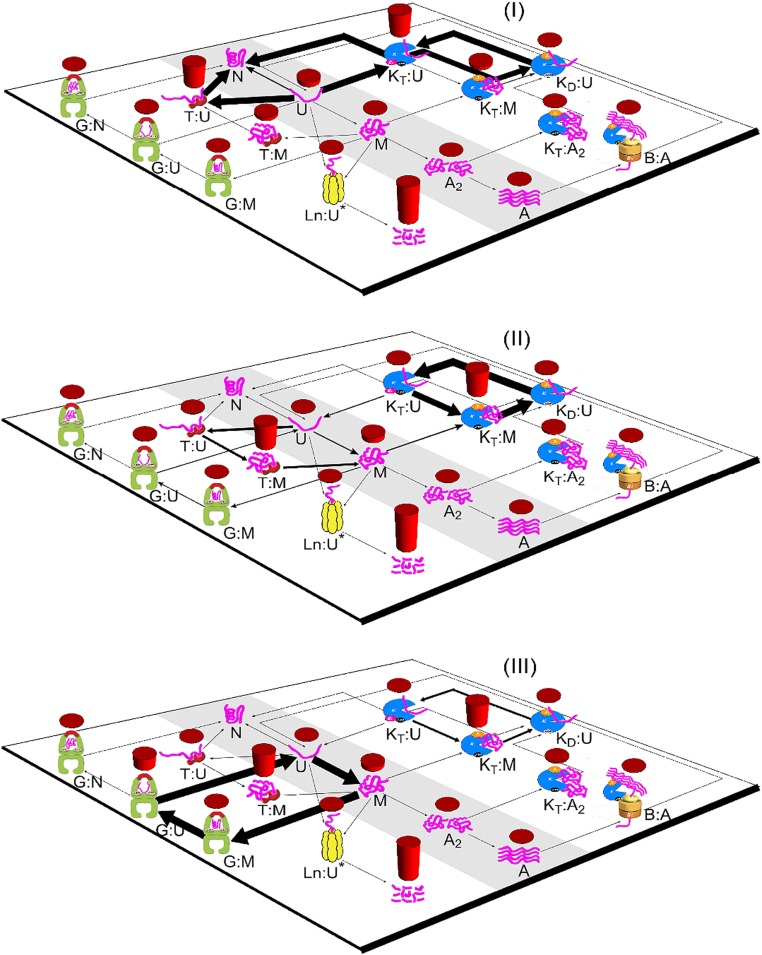
This kinetic model shows proteostasis to be a dynamical sorting machine. The different classes of protein are routed differentially through the different chaperones (Fig. 2). Class I proteins fold mainly via TF and KJE. Class II proteins fold mainly through KJE, and class III proteins use mainly the GroE system (7) (Fig. 2). Under normal (nonstress) conditions, the flux through B is negligible (13). The Ln protease degrades proteins on a timescale that is slow enough that the protein has time to attempt to fold or be chaperoned first. The extents of degradation are 1, 30, and 26% for classes I–III proteins, respectively. The populations of native states (N states) are relatively higher and are not shown in Fig. 2. The steady-state yields of N state are 98, 61, and 68% for classes I–III, respectively. Below, we explain how this kinetic network encodes these trafficking decisions.
Fig. 2.
The dynamical sorting of three classes of proteins through the different chaperone systems. Predicted concentrations of species are shown by red bar heights, and fluxes between species are shown by the thicknesses of arrows. Growth rate corresponds to a 40-min cell-doubling time. A, aggregate; G, GroEL; K, DnaK.
How Does a Client Protein Reveal Its Sickness?
We find that a key property that explains dynamical sorting is the dwell time () of the client protein in its misfolded state (M state) (SI Appendix, Derivation of a Protein’s Dwell Time in the Misfolded State):
| [1] |
where , , and are rates of folding [unfolded (U)N], misfolding (UM), and unmisfolding (MU), respectively. The subscript zero indicates that this is a property of just the protein in the absence of chaperones and aggregation; reflects how long an isolated protein spends in M before it folds to N. The dwell time is a measure of lability. We also compute and , the dwell times of the protein in M in the presence of KJE and GroE, respectively (SI Appendix, Eqs. S17 and S18):
| [2] |
| [3] |
where is the rate of KJE cycle. We take the value to be 1 s−1, which corresponds to the rate-limiting GrpE release step in the KJE cycle. The other rate parameters used to compute the values are given in SI Appendix, Table S1.
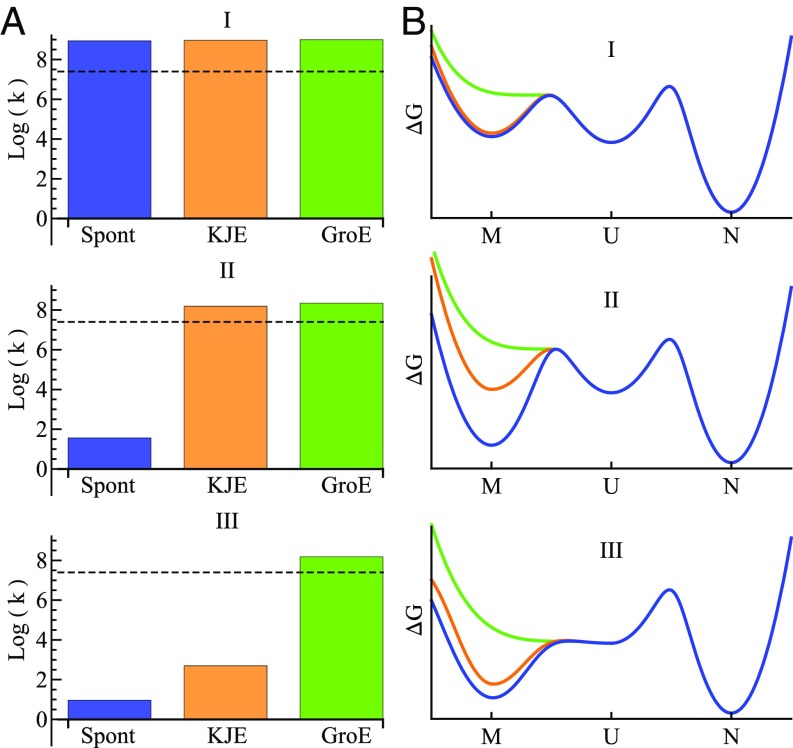
Fig. 3A shows the folding rates of different proteins in the presence of different chaperones. Proteins of class I are fast spontaneous folders. They can also be folded by the KJE and GroE chaperones at the same speed that they fold spontaneously. In contrast, proteins of classes II and III get stuck in M states over a much slower timescale. Class II proteins can be folded by both KJE and GroE, whereas class III proteins fold only by GroE (Fig. 3A).
Fig. 3.
Properties of three classes of proteins with and without chaperones. (A) Rates of protein folding from the M state in the absence of chaperones (blue), the presence of excess KJE (orange), and the presence of excess GroE (green). The rates are defined as k = /(minutes). The dwell times ( values) are computed using Eqs. 1–3 with the rate parameters given in SI Appendix, Table S1. The black dashed lines represent growth rates corresponding to 40-min cell duplication time. (B) Free energy diagrams of MUN for three classes of proteins. Blue indicates client protein alone in the absence of chaperones. Orange indicates with KJE present. Green indicates with GroE present. The rates and barrier heights are computed using rate parameter values given in SI Appendix, Table S1. For class II, the parameter set of DCEA has been used here. G, GroEL; Spont, spontaneous.
Here is how a protein’s degree of sickness is encoded in physical–chemical quantities. Fig. 3B illustrates using energy landscape diagrams. In Fig. 3B, we focus on an identical client protein having the same values of folding and unfolding rates between U and N and therefore, a given stability. The blue curves in Fig. 3B show the kinetics (barrier heights) and equilibria (well depths) for MUN of the protein for three classes of proteins in the absence of any chaperones.
Class I proteins have a weakly populated M state (shallow well on the free energy diagram) that readily converts to their U state. Class II proteins have a stable populated M state (deeper well), and it is kinetically accessible from U but with slow rate of UM. Class III proteins have a stable M state that is also kinetically accessible through fast conversion of UM. Therefore, class I proteins need the least assistance from chaperones, and class III proteins need the most assistance (Fig. 3). We can label the protein clients by their degree of folding sickness: class I proteins are “healthy,” class II proteins are “frail,” and class III proteins are sick. In short, the sickness of a protein is determined by two physical quantities of any protein: (UM) and (UM). The dwell time of a protein () in the cell is a combination of individual dwell times given in Eqs. 1–3 weighted by the corresponding chaperone pathway. Our estimated dwell times () for classes I–III are 1, 33, and 29 min, respectively.
How Does the Proteostasis Machine Repair Its Client Proteins?
What is the action of each chaperone on its client protein? This problem has been the subject of much study. An early distinction was that chaperones were either holdases (shielding a folding protein from aggregation and degradation) or foldases (accelerating the transition from U to N) (14–19). The spectrum of mechanisms is now seen as broader, with the zoo of chaperones interacting in complex ways with the zoo of protein clients (7, 20–24). Still, the whole proteostasis machine can have its own type of action distinct from the actions of the individual chaperone components. What type of action is performed by the whole machine? We adopt the following definitions: A foldase is an action that speeds up the rate from U to N. A holdase is an action that slows down the rate from U to M, and it also slows down the rate from U to N, limiting escape from U in either direction. Additionally, a third type of action, which we call an unmisfoldase, speeds up the rate from M to U. We note a matter of terminology. The field has also used the term unfoldase for this process, but our terminology is more in keeping with standard enzyme terminology in that “-ase” refers to the process that it involves and does not refer to the product.
Fig. 2 shows two conclusions from the model: (i) the proteostasis machine is a foldase for class I proteins, and (ii) it is an unmisfoldase for classes II and III proteins. For those proteins, GroE and KJE act on the M states of proteins and convert them to U states, from which they can then proceed to N.
Sorting Is Dictated by the Client Protein, Not the Chaperone
Proteins of class 0 fold spontaneously and rapidly enough to mostly evade the GroE and KJE chaperone systems altogether. Class I proteins use both TF and KJE to fold but not GroE. KJE mostly folds class II proteins, and GroE mostly folds class III proteins. How is this decision made? Is it by the chaperone or the client protein? Fig. 3B shows that the GroE system is not selective (green lines in Fig. 3B). GroE acts the same way on all classes of proteins, namely as an unmisfoldase, converting misfolded to unfolded conformations. However, SI Appendix, Table S1 shows that class III proteins bind to GroE rapidly, whereas class II proteins bind to GroE much slower. Therefore, the class III “patient chooses the doctor” (GroE), relegating the class II proteins to the KJE system.
What is the difference between the chaperone systems? The model shows that KJE and GroE destabilize the M state of all three classes of proteins. Therefore, KJE and GroE are unmisfoldases operating on M, not holdases operating on U. Even so, KJE and GroE act differently. KJE partly destabilizes M by reducing the barrier of MU to a value corresponding to a rate of about 1 s−1. KJE does not change the barrier of reverse process UM. In contrast, GroE fully destabilizes M, completely unfolding any client protein.
Here is a summary from the perspective of the client proteins.
Class III proteins bind to the GroE chaperone about five times faster than class II proteins (SI Appendix, Table S1). Therefore, class III proteins preferentially flow through GroE (Fig. 2).
Class II proteins preferentially flow through the KJE system, (i) because KJE tips the equilibrium specifically for class II proteins from MU (Fig. 3B) and thus, accelerates rate of folding (Fig. 3A) and (ii) because class II proteins are kinetically excluded from GroE by GroE’s faster capture of class III proteins.
Class I proteins do not misfold much. They fold spontaneously, or they dwell in U (Fig. 3). TF and KJE assist in the UN transition (Fig. 2).
Although this observation summarizes the average trafficking, the model also shows that the process is stochastic. A protein will sometimes enter the “wrong” host chaperone and still be channeled toward its N state.
This Sorting Mechanism Is Capable of Handling Any Possible Protein
A cell must be able to fold any protein, even a protein that it has never seen before, because cellular proteins evolve. How is the bacterial chaperone system able to provide this flexibility? This collection of four chaperone systems can handle any protein. The model shows that the proteostasis machine sorts clients on the basis of two biophysical properties: the stability of its M state (M relative to U) and its rate of conversion from U to M relative to its folding rate .
Dynamical Sorting Is Energy-Efficient for the Cell
This dynamical sorting mechanism is energy-efficient. The cell expends more energy folding sick proteins than healthy ones. GroE is the most expensive in ATP use (seven ATPs per cycle). Also, 70% of GroE activity is on class III proteins (SI Appendix, Fig. S6A). Classes II and I proteins occupy only 27 and 3% of GroE, respectively, consistent with the data of Kerner et al. (7). The extents of GroE-mediated folding are in accordance with their GroE enrichments (SI Appendix, Fig. S6B). A key measure of how a protein uses the chaperone systems is the number of times that it cycles through different chaperones before folding. A class I protein visits TF, KJE, and GroE on averages of 0.42, 0.42, and 0.1 cycles, respectively, before it folds. For class II proteins, these values are 5, 16, and 6 cycles, respectively. For class III proteins, they are 0.24, 13, and 37 cycles, respectively (SI Appendix, Fig. S6C). Therefore, the sickest proteins (class III) use the most energy-intensive chaperone (GroE). Frail proteins (class II) mostly use the next most energy-intensive chaperone (KJE), whereas the healthiest proteins are the cheapest to assist (SI Appendix, Fig. S6D).
Different Cellular Growth Rates Impose Different Demands on Proteostasis
Chaperones Are More Filled Up in Faster-Growing Cells.
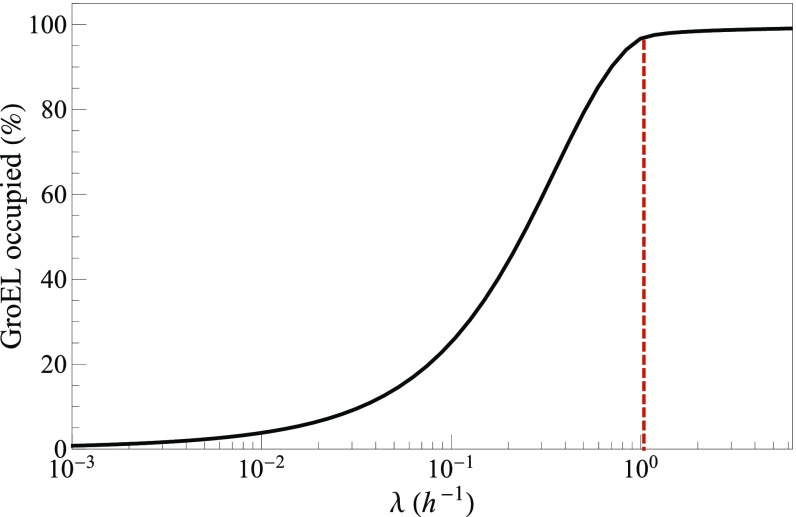
How filled up is an average chaperone with its client proteins? It depends on the growth rate. At fast growth, a cell produces new proteins rapidly, and therefore, chaperones are relatively full; Fig. 4 shows the model predictions for fixed chaperone concentration. GroEL is 100% full with client proteins under the fast-growth conditions of a 40-min duplication time (red dashed vertical line in Fig. 4). TF and KJE are also near their saturation limit. At slower-growth rates, chaperones are less filled up by client proteins. It follows that fast-growing cells will have reduced capacity to handle additional stresses on protein folding that would increase client misfolding. This prediction is consistent with the experiment of Botstein and coworkers (26) in yeast, which showed that faster-growing cells are less able to handle heat stress than slower-growing cells.
Fig. 4.
GroEL fills up with client proteins at faster-growth rates. The red line indicates cell growth corresponding to a 40-min doubling time of E. coli. Concentrations of chaperones and client proteins are given in SI Appendix, Table S3.
Shields Up/Shields Down: Different Growth Rates Require Different Chaperone Concentrations.
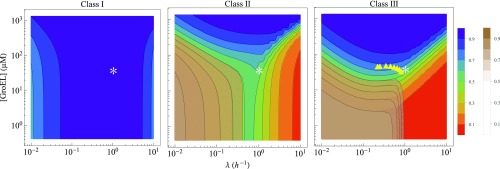
Above, we considered chaperone filling under the simplified assumption that the chaperone concentration is fixed. More realistically, a cell can control its chaperone concentrations. Fig. 5 shows the extent of proteome folding as a function of the combined cell growth rate and GroEL concentration. Fig. 5 shows “sea–cliff” diagrams, in which the blue “sea” region represents situations in which a proteome is more than 90% folded. The red and brown “cliffs” in Fig. 5 indicate conditions where the proteome is nonnative; red in Fig. 5 indicates aggregated states, and brown in Fig. 5 indicates the fraction of degraded proteins. The white asterisks in Fig. 5 indicate the concentration of GroEL in E. coli under condition of a growth rate corresponding to a 40-min doubling time.
Fig. 5.
The need for GroEL at different cell growth rates to keep the proteome folded. Native protein fraction with varying concentration of GroEL and cell growth for three classes of proteins. Blue and red indicate high and low fractions of N state, respectively. The contour of the degradation fraction (brown) is plotted in the same graph. Asterisks indicate the cellular concentration of GroEL (SI Appendix, Table S3) and the growth rate corresponding to a 40-min doubling time. The yellow triangles are GroEL concentrations at different growth rates measured in the experiments of Valgepea et al. (25). The rate parameters are the same as in SI Appendix, Tables S1 and S2, except the rate of unfolding (), which is . The concentration of cochaperone GroES is changed accordingly maintaining stoichiometry of GroEL:GroES (1:0.83). The concentrations of proteins and other chaperones are kept constant (SI Appendix, Table S3).
Fig. 5 shows a sea–cliff plot for a protein having marginal folding stability. Fig. 5, Left shows that class I proteins fold completely, irrespective of GroE concentration or growth rate. Fig. 5, Center and Right shows that classes II and III proteins, respectively, are balanced on the cliff’s edge of folding, degradation, and aggregation at a growth rate of a 40-min doubling time. Fig. 5 shows GroE limitations, but KJE limitations are similar (not shown in Fig. 5).
The cell’s chaperoning needs can be expressed in terms of gaming and movie terminology shields up/shields down. The cell needs more chaperones (shields up) to protect its proteome under two conditions: fast growth or slow growth. At intermediate-growth rates, the cell needs less chaperone (shields down) (Figs. 5 and 6). Here is the explanation from the model. In fast growth, proteins are expressed rapidly, and they tend to aggregate; therefore, more chaperones are needed to protect against aggregation. This explanation is consistent with the observation that overexpression of chaperones by regulating 32 transcription factor prevents misfolding and maintains a high level of protein expression (27). In short, fast growth is a stressor of the cell. However, fast-growth stress is different from heat shock stress. Heat shock affects the thermodynamics of protein stability and thus, changes folding properties (rate constants) of the client proteins. In contrast, growth-rate stress does not change a protein’s stability; it causes a cell’s kinetic inability to capture and fold the large numbers of newly synthesized proteins fast enough.
Fig. 6.
The flow of client protein at different growth rates and the effect of GroEL overexpression on its folding. Schematic representation of flow of client protein at different growth. U, N, and GU represent nonnative, native, and GroEL-bound protein complexes, respectively; indicates degradation. The fluxes in steady state are shown by arrows. The magnitude of flux is proportional to the width of the arrow. The most populated state is indicated by a bold letter. A, aggregate; G, GroEL.
Slow growth is also a stressor of the cell. In slow growth, the rate of protein degradation becomes important. Chaperoned folding competes with degradation. Therefore, shields up reduces the cell’s cost of synthesizing proteins. This prediction is consistent with experiments showing shields-up action in slow-growing yeast (28). Those data show that stress-response proteins (Hsp12, Hsp26, Hsp30, Hsp42, Hsp78, Hsp82, and Hsp104) are up-regulated at low-growth rates. Up-regulation of chaperone prevents degradation by faster protein binding and folding (Fig. 6, Lower Left).
Intermediate-growth rates are fast enough to avoid degradation and slow enough to avoid aggregation, and therefore, shields down is sufficient to protect the cell. This prediction is consistent with experimental data in the work by Valgepea et al. (25) (yellow triangles in Fig. 5, Right). In short, in going from low growth to medium growth to fast growth, the cell needs shields-upshields-downshields-up chaperone concentrations. We do not explicitly consider oxidative damage here, but that would add even more stress to the cell at slow-growth rates (29). The result in Fig. 5 at slow growth looks contradictory to the result shown in Fig. 4. Fig. 4 suggests that, at slow growth, the majority of chaperones are free, whereas Fig. 5 indicates the need of excess chaperone. The schematic diagram in Fig. 6, Left can explain this apparently contradictory observations. According to the diagram, there is continuous flow of protein from N to U state, and the U state is degraded by protease irreversibly, which reduces the overall population of nonnative protein, causing a decrease in chaperone occupancy. The need of excess chaperone under this condition as shown in Fig. 5 is to prevent this degradation by rapidly binding those unfolded proteins by excess chaperone.
Cell Achieves an Economical Balance; Just Enough Chaperones to Fold the Proteome
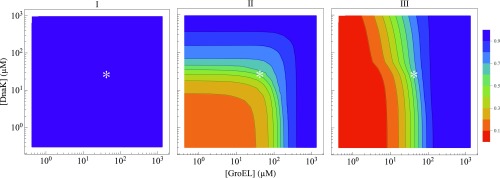
In principle, evolution fixes a cell’s average chaperone concentrations at some optimal level for cell fitness. On the one hand, producing too many chaperones means that most chaperones will be empty, meaning that the cell has wasted energy and biomass. On the other hand, producing too few chaperones means that chaperones will be near maximum capacity most of the time, meaning that the cell could not handle additional stresses. Fig. 7 is a sea–cliff diagram that shows the degree of proteome folding at different GroE and KJE concentrations at C (at a growth rate of a 40-min doubling time). The white asterisks in Fig. 7 indicate standard chaperone concentrations in E. coli (SI Appendix, Table S3). Fig. 7 shows that the normal chaperone concentrations are at a balance point: they keep most of the proteome folded but not all. Fig. 7 also shows (i) that class I proteins can fold independent of the GroE and KJE chaperones, (ii) that class II can use either GroE or KJE chaperones to fold, and (iii) that GroE is irreplaceable for folding class III proteins.
Fig. 7.
Sea–cliff plots showing that KJE and GroE concentrations are just sufficient to fold all three classes of proteins. They show that KJE can trade off for GroE for class II proteins but not for class III proteins at growth rates corresponding to a 40-min cell-doubling time. The asterisks indicate cellular concentrations of DnaK and GroEL under normal conditions (SI Appendix, Table S3). The concentrations of cochaperones DnaJ and GrpE are changed accordingly, maintaining stoichiometry of DnaK:DnaJ:GrpE (30:1:15). Similarly, GroES is varied, keeping GroEL:GroES (1:0.83) fixed. Concentrations of all other chaperones and proteins are kept constant (SI Appendix, Table S3).
Protein Expression Is Near the Aggregation Tipping Point
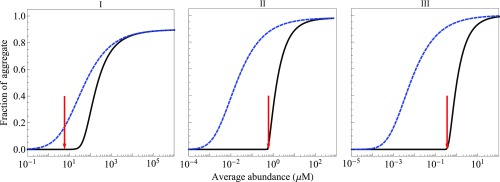
Fig. 8 shows how aggregation depends on protein expression levels. It supports the proposal of “life at the edge” (30), which is the idea that proteins are expressed at levels just below their solubility limits. The physiological concentrations (shown by red arrows in Fig. 8) of three classes of GroEL-interacting proteins are quite close to the points at which those proteins are predicted to aggregate in the presence of chaperones. It implies that cells are near their points of minimal chaperone (Fig. 7) or maximal client–protein expression levels (Fig. 8). The exception is class I proteins, which are well below their aggregation points. However, the implication for classes II and III proteins is that small perturbations (such as oxidative damage, heat shock, aging, or overexpression of protein) could drive aggregation. These aggregation points arise in the model from a complex interplay of folding rate, stability, misfolding rate, aggregation rate, and chaperone activity. Hence, no one of these factors alone is likely to predict expression levels in the cell. The expression levels of proteins that fold fast are expected to be correlated with the stability of their N state, whereas for slow folders, it should depend on aggregation rate and chaperone activity.
Fig. 8.
Protein aggregation vs. abundance. Blue indicates no chaperones. Black indicates that all chaperones are present. Red arrows indicate the protein abundance that is found in cells growing at the rate of a 40-min doubling time. Chaperone concentrations are taken to be at their normal cellular levels (SI Appendix, Table S3).
Conclusions
We have modeled the E. coli proteostasis machine. The model draws on extensive rate measurements (7). Metaphorically, the machine decisions resemble those of a hospital (the chaperone system) and a patient (the client protein). The decisions are encoded in the kinetic proteostasis network and the protein’s folding properties. The whole machine seems to act as unmisfoldase, affecting client proteins of types II and III through their MU equilibria and kinetics. The healthiest proteins do not engage much with the chaperones. Sicker proteins (class II) flow mostly through the KJE system, and the sickest proteins (class III) flow through GroE. This sorting is largely encoded by a high capture speed of class III proteins by GroE. This collection of chaperones has the capacity to handle any client protein and is energy-efficient (only the sickest proteins use the most energy-expensive chaperone, which is GroE). Cells growing at different rates fill up the chaperones to different degrees. Under fast-growth conditions, client proteins nearly overflow their chaperones, and the proteome is barely fully folded.
Materials and Methods
The model described in Fig. 1 (details are in SI Appendix, Figs. S1–S4) is a set of time-dependent differential equations involving time-dependent concentrations of each species. A representative set of equations for synthesis and folding/misfolding/aggregation is shown in SI Appendix, Eqs. S2–S6. The solution of these differential equations gives time-dependent concentrations of each species. To solve them requires initial concentrations of each species and rate parameter values. Most of the rate parameters are independent of protein type and available in the literature (SI Appendix, Table S2). Some of the protein-specific parameters can also be estimated using existing theories (SI Appendix, Table S1). For any given protein, the remaining five unknown parameters are found using in vitro refolding data.
In Vitro Refolding.
The experimental refolding data of four proteins (ENO, DCEA, SYT, and DAPA) have been reported by Kerner et al. (7) (SI Appendix, Fig. S5) for diverse conditions. For each of these proteins, we use available initial concentrations of U and chaperones as noted in SI Appendix, Fig. S5. Those of other states are taken to be zero. The protein nonspecific rate parameters are taken from SI Appendix, Table S2. The stability of the N state () is computed using the protein chain length-dependent formula of Ghosh and Dill (31). The remaining five rate parameters (six parameters for SYT) are parameters (SI Appendix, Table S1) that we fit using Mathematica. The best-fit graphs and corresponding experimental data are shown in SI Appendix, Fig. S5, and the estimated rate parameter values are given in SI Appendix, Table S1.
In Vivo Proteostasis.
Among 4,000 proteins in E. coli, 250 proteins are reported to be highly aggregation-prone. They use chaperone systems extensively for folding (7). These proteins have been divided into three classes depending on their extent of interaction with GroEL: class I (42 proteins), class II (126 proteins), and class III (84 proteins). Recent theoretical studies based on the FoldEco simulation model characterize these three classes of GroEL substrates (13, 32). Here, we model the whole proteostasis machine of E. coli and its handling of these 252 proteins.
We first derive folding and chaperoning rate parameters for each representative protein of three classes of GroEL substrates from in vitro refolding experimental data. We use them at the proteome level assuming that each of these proteins is representative of the average of its class. We chose four proteins, one for class I (ENO), two for class II (DCEA and SYT), and one for class III (DAPA), as representative of their respective classes. The reason for choosing two representative proteins for class II is that there are two different types of proteins in this class: (i) proteins of size smaller than 60 kDa (DCEA; they can be assisted by GroEL) and (ii) proteins of size bigger than 60 kDa (SYT; they do not get active assistance from GroEL in their folding). Therefore, they are folded to different degrees by GroEL.
We then compute properties of proteostasis by taking 42 class I proteins with their rate parameters identical to those of ENO, 63 class II proteins with rate parameters identical to those of DCEA, 63 class II proteins with rate parameters the same as SYT, and 84 class III proteins with rate parameters the same as DAPA. Thus, these 252 proteins compete for assistance from different chaperone systems in the model. The initial concentrations of free chaperones are given in SI Appendix, Table S3. The initial concentrations of the remaining species are taken to be zero. The growth rate () is taken to be 1.04 , which corresponds to a 40-min cell-doubling time. The protein synthesis fluxes of each class of proteins () are computed using the relationship between growth rate, desired concentrations of protein in the steady state given in SI Appendix, Table S3, and synthesis flux (SI Appendix, Eq. S9). The steady concentrations of each protein are obtained from the PaxDB database (33) by taking the geometric average over proteins belonging to a given class. They are as follows: class I: 6 M (total 252 M); class II: 0.6 M (total 75.6 M); and class III: 0.35 M (total 29.4 M) (SI Appendix, Table S3). After setting up the proteostasis machine at time t = 0 by assigning initial concentrations of each species, synthesis fluxes, growth rates, and rate parameters, we ran the numerical differential equation solver in Mathematica. At long times, the system reaches steady-state concentrations, which are the values reported in this paper.
Supplementary Material
Acknowledgments
We thank Evan T. Powers and Lila M. Gierasch, who introduced us to this problem and created the FoldEco model. We also thank Dr. Adam M. R. de Graff, Dr. Kingshuk Ghosh, Dr. Timothy O. Street, and Dr. Rakesh S. Singh for insightful discussions and suggestions, and Dr. Sarina Bromberg for help with graphics. We were supported by the Laufer Center and National Science Foundation Grant 1205881.
Footnotes
The authors declare no conflict of interest.
This article contains supporting information online at www.pnas.org/lookup/suppl/doi:10.1073/pnas.1620646114/-/DCSupplemental.
References
- 1.Balch WE, Morimoto RI, Dillin A, Kelly JW. Adapting proteostasis for disease intervention. Science. 2008;319(5865):916–919. doi: 10.1126/science.1141448. [DOI] [PubMed] [Google Scholar]
- 2.Chiti F, Dobson CM. Protein misfolding, functional amyloid, and human disease. Annu Rev Biochem. 2006;75(1):333–366. doi: 10.1146/annurev.biochem.75.101304.123901. [DOI] [PubMed] [Google Scholar]
- 3.Labbadia J, Morimoto RI. The biology of proteostasis in aging and disease. Annu Rev Biochem. 2015;84(1):435–464. doi: 10.1146/annurev-biochem-060614-033955. [DOI] [PMC free article] [PubMed] [Google Scholar]
- 4.Powers ET, Morimoto RI, Dillin A, Kelly JW, Balch WE. Biological and chemical approaches to diseases of proteostasis deficiency. Annu Rev Biochem. 2009;78:959–991. doi: 10.1146/annurev.biochem.052308.114844. [DOI] [PubMed] [Google Scholar]
- 5.Butterfield DA, Lauderback CM. Lipid peroxidation and protein oxidation in Alzheimer’s disease brain: Potential causes and consequences involving amyloid -peptideassociated free radical oxidative stress. Free Radic Biol Med. 2002;32(11):1050–1060. doi: 10.1016/s0891-5849(02)00794-3. [DOI] [PubMed] [Google Scholar]
- 6.Freeman BC, Morimoto RI. The human cytosolic molecular chaperones hsp90, hsp70 (hsc70) and hdj-1 have distinct roles in recognition of a non-native protein and protein refolding. EMBO J. 1996;15(12):2969–2979. [PMC free article] [PubMed] [Google Scholar]
- 7.Kerner MJ, et al. Proteome-wide analysis of chaperonin-dependent protein folding in Escherichia coli. Cell. 2005;122(2):209–220. doi: 10.1016/j.cell.2005.05.028. [DOI] [PubMed] [Google Scholar]
- 8.Young JC, Agashe VR, Siegers K, Hartl FU. Pathways of chaperone-mediated protein folding in the cytosol. Nat Rev Mol Cell Biol. 2004;5(10):781–791. doi: 10.1038/nrm1492. [DOI] [PubMed] [Google Scholar]
- 9.Powers ET, Powers DL, Gierasch LM. FoldEco: A model for proteostasis in E. coli. Cell Rep. 2012;1(3):265–276. doi: 10.1016/j.celrep.2012.02.011. [DOI] [PMC free article] [PubMed] [Google Scholar]
- 10.Horwich AL, Farr GW, Fenton WA. Groel-Groes-mediated protein folding. Chem Rev. 2006;106(5):1917–1930. doi: 10.1021/cr040435v. [DOI] [PubMed] [Google Scholar]
- 11.Genevaux P, Georgopoulos C, Kelley WL. The Hsp70 haperone machines of Escherichia coli: A paradigm for the repartition of chaperone unctions. Mol Microbiol. 2007;66(4):840–857. doi: 10.1111/j.1365-2958.2007.05961.x. [DOI] [PubMed] [Google Scholar]
- 12.Mogk A, Deuerling E, Vorderwülbecke S, Vierling E, Bukau B. Small heat shock proteins, ClpB and the DnaK system form a functional triade in reversing protein aggregation. Mol Microbiol. 2003;50(2):585–595. doi: 10.1046/j.1365-2958.2003.03710.x. [DOI] [PubMed] [Google Scholar]
- 13.Cho Y, et al. Individual and collective contributions of chaperoning and degradation to protein homeostasis in E. coli. Cell Rep. 2015;11(2):321–333. doi: 10.1016/j.celrep.2015.03.018. [DOI] [PMC free article] [PubMed] [Google Scholar]
- 14.Agard DA. To fold or not to fold…. Science. 1993;260(5116):1903–1904. doi: 10.1126/science.8100365. [DOI] [PubMed] [Google Scholar]
- 15.Hendrick JP, Langer T, Davis TA, Hartl FU, Wiedmann M. Control of folding and membrane translocation by binding of the chaperone DnaJ to nascent polypeptides. Proc Natl Acad Sci USA. 1993;90(21):10216–10220. doi: 10.1073/pnas.90.21.10216. [DOI] [PMC free article] [PubMed] [Google Scholar]
- 16.Nunes JM, Mayer-Hartl M, Hartl FU, Müller DJ. Action of the Hsp70 chaperone system observed with single proteins. Nat Commun. 2015;6:6307. doi: 10.1038/ncomms7307. [DOI] [PubMed] [Google Scholar]
- 17.Schröder H, Langer T, Hartl FU, Bukau B. DnaK, DnaJ and GrpE form a cellular chaperone machinery capable of repairing heat-induced protein damage. EMBO J. 1993;12(11):4137–4144. doi: 10.1002/j.1460-2075.1993.tb06097.x. [DOI] [PMC free article] [PubMed] [Google Scholar]
- 18.Sharma SK, Christen P, Goloubinoff P. Disaggregating chaperones: An unfolding story. Curr Protein Pept Sci. 2009;10(5):432–446. doi: 10.2174/138920309789351930. [DOI] [PubMed] [Google Scholar]
- 19.Szabo A, Korszun R, Hartl FU, Flanagan J. A zinc finger-like domain of the molecular chaperone DnaJ is involved in binding to denatured protein substrates. EMBO J. 1996;15(2):408–417. [PMC free article] [PubMed] [Google Scholar]
- 20.Agashe VR, et al. Function of trigger factor and DnaK in multidomain protein folding: Increase in yield at the expense of folding speed. Cell. 2004;117(2):199–209. doi: 10.1016/s0092-8674(04)00299-5. [DOI] [PubMed] [Google Scholar]
- 21.Buchberger A, Schröder H, Hesterkamp T, Schönfeld HJ, Bukau B. Substrate shuttling between the DnaK and GroEL systems indicates a chaperone network promoting protein folding. J Mol Biol. 1996;261(3):328–333. doi: 10.1006/jmbi.1996.0465. [DOI] [PubMed] [Google Scholar]
- 22.Calloni G, et al. DnaK functions as a central hub in the E. coli chaperone network. Cell Rep. 2012;1(3):251–264. doi: 10.1016/j.celrep.2011.12.007. [DOI] [PubMed] [Google Scholar]
- 23.Ewalt KL, Hendrick JP, Houry WA, Hartl FU. In vivo observation of polypeptide flux through the bacterial chaperonin system. Cell. 1997;90(3):491–500. doi: 10.1016/s0092-8674(00)80509-7. [DOI] [PubMed] [Google Scholar]
- 24.Langer T, et al. Successive action of DnaK, DnaJ and GroEL along the pathway of chaperone-mediated protein folding. Nature. 1992;356(6371):683–689. doi: 10.1038/356683a0. [DOI] [PubMed] [Google Scholar]
- 25.Valgepea K, Adamberg K, Seiman A, Vilu R. Escherichia coli achieves faster growth by increasing catalytic and translation rates of proteins. Mol BioSyst. 2013;9:2344–2358. doi: 10.1039/c3mb70119k. [DOI] [PubMed] [Google Scholar]
- 26.Lu C, Brauer MJ, Botstein D. Slow growth induces heat-shock resistance in normal and respiratory-deficient yeast. Mol Biol Cell. 2009;20(3):891–903. doi: 10.1091/mbc.E08-08-0852. [DOI] [PMC free article] [PubMed] [Google Scholar]
- 27.Zhang X, et al. Heat-shock response transcriptional program enables high-yield and high-quality recombinant protein production in Escherichia coli. ACS Chem Biol. 2014;9(9):1945–1949. doi: 10.1021/cb5004477. [DOI] [PMC free article] [PubMed] [Google Scholar]
- 28.Brauer MJ, et al. Coordination of growth rate, cell cycle, stress response, and metabolic activity in yeast. Mol Biol Cell. 2008;19(1):352–367. doi: 10.1091/mbc.E07-08-0779. [DOI] [PMC free article] [PubMed] [Google Scholar]
- 29.Fredriksson A, Ballesteros M, Dukan S, Nyström T. Defense against protein carbonylation by DnaK/DnaJ and proteases of the heat shock regulon. J Bacteriol. 2005;187(12):4207–4213. doi: 10.1128/JB.187.12.4207-4213.2005. [DOI] [PMC free article] [PubMed] [Google Scholar]
- 30.Tartaglia GG, Pechmann S, Dobson CM, Vendruscolo M. Life on the edge: A link between gene expression levels and aggregation rates of human proteins. Trends Biochem Sci. 2007;32(5):204–206. doi: 10.1016/j.tibs.2007.03.005. [DOI] [PubMed] [Google Scholar]
- 31.Ghosh K, Dill KA. Computing protein stabilities from their chain lengths. Proc Natl Acad Sci USA. 2009;106(26):10649–10654. doi: 10.1073/pnas.0903995106. [DOI] [PMC free article] [PubMed] [Google Scholar]
- 32.Dickson A, Brooks CL., III Quantifying chaperone-mediated transitions in the proteostasis network of E. coli. PLoS Comput Biol. 2013;9(11):e1003324. doi: 10.1371/journal.pcbi.1003324. [DOI] [PMC free article] [PubMed] [Google Scholar]
- 33.Wang M, et al. PaxDb, a database of protein abundance averages across all three domains of life. Mol Cell Proteomics. 2012;11(8):492–500. doi: 10.1074/mcp.O111.014704. [DOI] [PMC free article] [PubMed] [Google Scholar]
Associated Data
This section collects any data citations, data availability statements, or supplementary materials included in this article.


