Significance
Feeding a population of 9 billion in 2050 coupled with the changing climate and environmental stresses motivate us to develop advances in plant science and technology. We present a high-throughput plant phenotyping platform for detection of abiotic stress. The proposed Raman spectroscopic technique for high-throughput stress phenotyping and early stress detection in vivo improves sensitivity with the ability to interrogate individual molecules simultaneously in plants. This technology holds promise for mobile automated systems and precision agriculture.
Keywords: Raman spectroscopy, plant abiotic stress, carotenoids, anthocyanins
Abstract
Development of a phenotyping platform capable of noninvasive biochemical sensing could offer researchers, breeders, and producers a tool for precise response detection. In particular, the ability to measure plant stress in vivo responses is becoming increasingly important. In this work, a Raman spectroscopic technique is developed for high-throughput stress phenotyping of plants. We show the early (within 48 h) in vivo detection of plant stress responses. Coleus (Plectranthus scutellarioides) plants were subjected to four common abiotic stress conditions individually: high soil salinity, drought, chilling exposure, and light saturation. Plants were examined poststress induction in vivo, and changes in the concentration levels of the reactive oxygen-scavenging pigments were observed by Raman microscopic and remote spectroscopic systems. The molecular concentration changes were further validated by commonly accepted chemical extraction (destructive) methods. Raman spectroscopy also allows simultaneous interrogation of various pigments in plants. For example, we found a unique negative correlation in concentration levels of anthocyanins and carotenoids, which clearly indicates that plant stress response is fine-tuned to protect against stress-induced damages. This precision spectroscopic technique holds promise for the future development of high-throughput screening for plant phenotyping and the quantification of biologically or commercially relevant molecules, such as antioxidants and pigments.
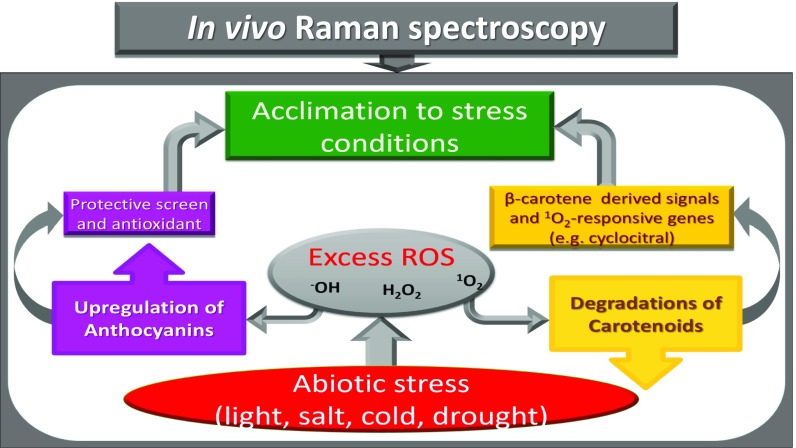
With the global population projected to exceed 9 billion by the year 2050, the task of producing enough food and energy for the world is of utmost importance (1). In anticipation of rising food demand (2), the ability to measure plant stress in vivo is becoming increasingly vital for increasing agricultural production and research. For example, such technologies would allow a farmer to intervene on stress detection and also, make practical the development of crop varieties with increased tolerance to abiotic stress. The field environment requires a comprehensive and rapid screening technology for plant physiological, biochemical, and morphological characteristics (3). Such characteristics can be integrated to predict plant growth potential, biomass processibility, and abiotic stress responses before any visible signs occur in a plant. Plant growth is impacted by unseasonable droughts, cold, increased UV radiation and high-energy blue light associated with atmospheric changes in ozone levels, and fertilizer/irrigation application associated with increased soil salinity (4, 5). Most existing methods for evaluating biochemical characteristics use destructive chemical analyses, which require time and intensive labor. In addition, these methods use strong chemicals, which require special handling and disposal. Currently, in vivo sensing technologies are limited by the time required for detecting a stress response, the types of stress factors that can be detected, the level of stress, and/or physiological changes. For example, reflectance spectroscopy (6), chlorophyll fluorescence spectroscopy (7), IR thermal imaging (8), terahertz time domain spectroscopy (9), and hyperspectral imaging (10) techniques have all been used to measure stress indirectly by focusing on changes in chlorophyll ratios/contents (6, 7), physical changes (9), or water status of plants (8, 10). Surprisingly, Raman spectroscopy has not been very widely used. Raman spectroscopy has been used for nondestructive and biochemically specific detection of trace molecules for applications, such as cancer and pathogen detection, agriculture applications, and other plant studies, such as imaging of the plant cell wall (11–15). Near-IR spectroscopy provides a complementary methodology to Raman spectroscopy; however, it has water absorption limitations. The Raman spectroscopic technique, however, is a valuable in vivo tool that deals with highly complex samples in their environment and is relatively insensitive to water. An important advantage of Raman spectroscopy is the ability to interrogate multiple molecular species simultaneously. For the purposes of identifying abiotic stress response in vivo in plants, we address a comparison between molecule biosynthesis and degradation associated with elicited general abiotic stress through utilization of Raman spectroscopy. In this study, two molecules, anthocyanins and carotenoids, were observed across all four abiotic stress factors (Fig. 1). When plants are exposed to abiotic stresses, they undergo highly complex physiological, biochemical, and molecular changes (4, 5, 16). In particular, reactive oxygen species (ROS) accumulate in plants during abiotic stresses, which are highly reactive and toxic, and the plant tries to eliminate them by producing volatile derivatives and antioxidants (17). Carotenoids, which are one of the target molecules in this study, are considered to be the first line of defense against ROS, serving as the main quencher in chloroplasts (18–21). The oxidative degradation of accessory photosynthetic pigments, like -carotene and other carotenoids, leads to the accumulation of different volatile derivatives, such as -cyclocitral, which has been shown to serve as a molecular signal responsible for induction of -responsive genes (18, 19). Therefore, rapid conversion of -carotene to -cyclocitral during oxidative stress is suggested to be one of the major defense mechanisms against ROS (18, 19). The second target molecule anthocyanin, a water-soluble pigment derived from flavonoids, has long been associated with plant stress response (16, 22, 23). Anthocyanin protection is twofold: first as an osmotic regulator and second as a light-filtering and free radical-scavenging protective pigment (16). Anthocyanins, which exist almost exclusively as glycosides, can be transported via a plant’s vasculature along with other solutes and eventually, accumulate in the cell’s vacuoles. This osmotic regulation through solute concentration protects plants from the damaging effects of various abiotic stresses (16, 22–25). As photo filters, anthocyanins block damaging intense blue, UVA, and possibly, UVB light for the leaf, lowering the light absorption burden for the photosynthetic molecules. In this work, Raman spectroscopy is used for high-throughput stress phenotyping and early stress detection in vivo with improved sensitivity and the ability to interrogate individual molecules, such as carotenoids and anthocyanins, simultaneously.
Fig. 1.
A simultaneous and in vivo detection of anthocyanins and carotenoids, which are reactive oxygen-scavenging pigments, by the Raman technique.
Materials and Methods
Plant Preparation and Treatment.
Coleus lime (Plectranthus scutellarioides) plants were used as an experimental model (23, 26). The seeds were obtained from a commercial source (www.Outsidepride.com). The experiments were carried out in the laboratory with automatic environmental controls (Institute for Quantum Science and Engineering, Texas A&M University). The seeds were initially grown under T5 grow lights on a 16-/8-h light–dark cycle for 11 wk. Next, cuttings were taken from a single fully grown plant to further multiply into cloned plants, because they provided that the plant responses to stress were not caused by genetic discriminations or mutations. These cloned plants were grown under the same conditions mentioned above for 71 d. The experimental model plants were subjected to one of four environmental stresses: salinity, drought, chilling temperature, or excess light. All plants received a nutrient solution every 2 wk. For saline stress, the plants were irrigated with 200 mM NaCl solution (pH 7) on days 1 and 3 alternately with distilled water (pH 7), whereas for drought stress, normal watering was withheld. For cold stress, the plants were kept at chilling temperatures (C) for 8 h during their dark period on days 1 and 2. Finally, for light stress, the plants were exposed to an intense light source (flood light with a 100-W high-pressure sodium light bulb) for 3–4 h (in addition to the T5 grow light) on days 1 and 3. The temperature and humidity levels were fairly stable (72°F and 47 humidity). Soil pH levels of the plants were constantly monitored. Each treatment had 10 replicate plants: 8 were harvested for chemical analysis, and 2 were used for spectroscopic measurements. Plants used for chemical analysis were harvested at 12-h intervals. Spectroscopic measurements via Raman allow us to use a single plant without destroying it, and therefore, we used two plants for statistical purposes. Pure chemicals, including -carotenoid, lycopen, xanthophyll, and anthocyanins (pelargonin chloride, peonidin 3-o-glucoside chloride, callistephin chloride, delphinidin chloride, malividin chloride, and keracyanin chloride), were obtained from Sigma-Aldrich.
Spectroscopic Measurements and Data Processing.
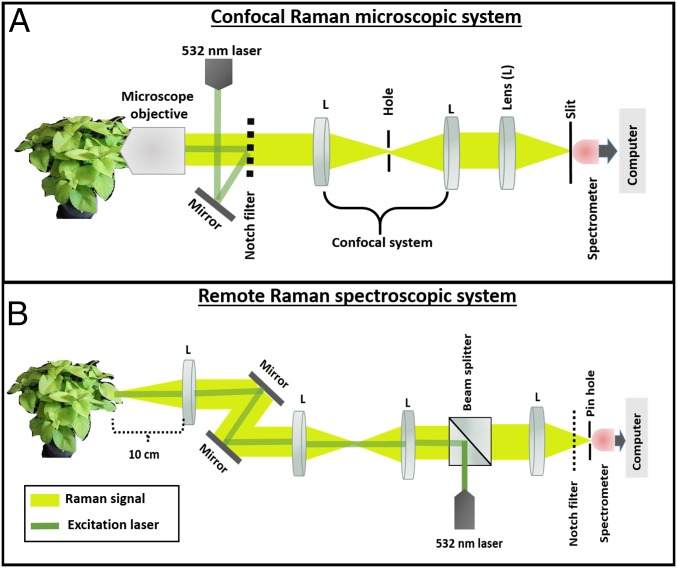
A Raman confocal microscopic system equipped with a 532-nm continuous wave (CW) laser was used for the microscopic measurements (Horiba; LabRam HR Revolution). Its simplified setup is shown in Fig. 2A. The remote Raman spectroscopic measurements were performed using a custom-built spectroscopic system that is easy to transport to a field. It is considered to be a remote sensing system, because it detects a signal at a 10-cm distance (Fig. 2B). The laser source at range system was a 532-nm CW laser, and the sampling spot size was 200 m. Plant leaves were placed directly on the sample holder without physical detachment from the plant. Therefore, it is considered as in vivo nondestructive detection. The laser-induced scattered radiation (signal) was efficiently detected by air-cooled CCD cameras. The laser powers were adjusted for the plant tissues without affecting the live cells (0.5 mW with 1 s acquisition time and 10 mW with 10 s acquisition time for microscopic and spectroscopic measurements, respectively). Twenty Raman spectra were collected from four leaves of each plant. These four leaves were selected from different locations of the canopy of the plant. The Raman spectral data of the plants (leaves) were obtained every 12 h during the onset and development of stress until 72 h. Because the leaves are a complex system, we used the mean spectra for additional analysis. The greater contributor of the noise to Raman spectra is the intrinsic fluorescence of molecules in plant tissues. Therefore, to extract Raman signal from the raw spectrum acquired, it is necessary to remove the fluorescence background. The baselines of Raman raw spectral data were corrected by fitting the high-order polynomials with multiple iterations (27). The spectra were further smoothed by the Savitzky–Golay algorithm with 15 adjacent points. All data processing programs were written in MATLAB R2013a (The Mathworks).
Fig. 2.
The Raman system setups. (A) Confocal Raman microscopic system. (B) The remote Raman spectroscopic system.
Chemical Extraction and Analysis.
Immediately after spectral data collections, leaves from the replicate plants were sampled for chemical destructive analysis. Square-cut leaf parts from each plant were immediately stored in liquid nitrogen and then a 80 °C freezer. From those frozen samples, eight were used for total carotenoids and five were used for total anthocyanins extraction for each plant. The plant tissues were extracted by the method of Lightenthaler and Buschmann (28) with 100 (vol/vol) acetone. The extracted solution’s absorbance was read at 470, 645, 662, and 750 nm with a Thermo Scientific GENYSIS 10S UV-VIS Spectrophotometer. Total carotenoids were calculated using the equations given in ref. 29. Anthocyanins were extracted by using an acidified methanol; 1 L 50 (vol/vol) methanol, 3 (vol/vol) formic acid, and 47 (vol/vol) distilled water solution was added to each 50 g plant tissues using the protocol in ref. 22. The extracted solutions were passed through a 0.4-m filter, and the absorbance was read at 532 nm by the above spectrophotometer as in ref. 22.
Main Results and Discussion
Raman Spectroscopic Detection.
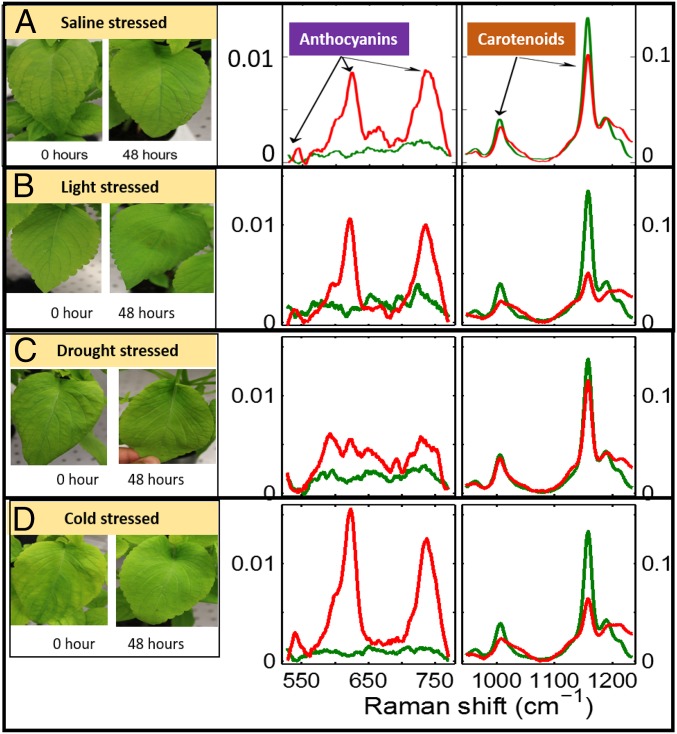
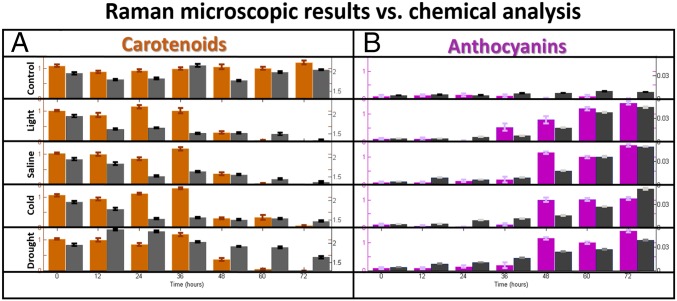
Photosynthetic pigments—anthocyanins and carotenoids—are found naturally in plant tissues. Moreover, anthocyanin biosynthesis is often induced in the leaf’s upper epidermis by excess light irradiation, cold, drought, and saline stresses. Understanding their biosynthesis is, in fact, at the heart of the plant stress tolerance mechanism justification (16, 24, 25). By targeting anthocyanins and carotenoids for the purposes of identifying abiotic stress responses in plants, we used a Raman spectroscopic technique. To implement Raman spectroscopy, a laser light is used to excite molecules. The molecules emit light with a new optical frequency that is downshifted from the incident laser frequency by the amount equal to their vibrational frequencies. This new color (referred to as Stokes radiation) is further detected with a spectrometer. The Raman spectra of the plants were recorded for 48 h after induction for all four types of stresses (saline, excess light, drought, and cold), including spectra of the unstressed control plants, using both a commercial Raman confocal microscope and a laboratory-built (portable) remote Raman system (Fig. 2). The Raman microscopic spectra at 48 h poststress are compared with the unstressed control plants in Fig. 3. Carotenoids were distinguished in the spectra for the control plants with distinct narrow peaks at 1,007 and 1,157 cm−1 (30, 31). After abiotic stress exposure, the Raman peaks at 539, 623, and 733 cm−1 for anthocyanins (32–34) clearly stood out. The set of Raman spectra of the plants was recorded initially (0 h) and every 12 h for up to 72 h of induction for all four types of stresses. The explicit height of the Raman peaks changes, indicating that the concentration of two pigments varies over time. Quantitative estimations of relative concentration variations of the pigments in plant tissues under stress can be derived from the recorded Raman spectra by using a least squares regression fitting method. For the sake of simplicity, although without losing most valuable information, we constructed a fitting as a linear combination of the recorded Raman spectra of only two pure chemicals: pelargonin chloride (22, 34) and -carotene (30, 31). A similar least squares method has been developed (11, 35) for successful diagnostics of breast cancer. The obtained fit coefficients represent relative change in the concentration of the base pigments with certain offset. In fact, these fit coefficients are functions of both the concentration of particular chemicals and their Raman scattering cross-sections. Moreover, because of the fact that the plant tissue is heterogeneous, the fitting coefficients are separately normalized, which allows the relative change to be quantified. We obtained the relative changes in carotenoids (brown bars in Fig. 4) and anthocyanin (violet bars in Fig. 4) as functions of duration of stress. The carotenoids decreased while the anthocyanins increased the longer the plants were stressed. In the control plants, carotenoids and anthocyanins levels were not altered. We note that the Raman spectra of carotenoids (30, 31) and anthocyanins molecules (32) in live plants have been previously studied one at a time. In this work, we directly measured the changes in molecule concentrations of anthocyanin and carotenoid molecules simultaneously. From the plant physiological viewpoint, negative correlation between anthocyanins and carotenoids can be understood as follows. Considering that both of the pigments are involved in response to ROS, this negative correlation highlights the effectiveness of the intracellular regulation. Under stress conditions, the strong induction of ROS (18–21) and the down-regulation of photosynthetic activity lead to the degradation of carotenoids. Recent research has shown that -carotene is rapidly converted to a novel volatile molecular signal -cyclocitral, which regulates expression of a set of -responsive genes in plants. Therefore, it is plausible that the observed reduction of -carotene in this study can be explained by its rapid conversion to -cyclocitral. Although carotenoids degrade, anthocyanins accumulate as a stress-responding ROS scavenger (16, 22–25). The strong negative correlation between the two pigments indicated that signal transduction has fine-tuned the transcriptomic, proteomic, and metabolic processes to allow the cell to properly adjust to stress conditions.
Fig. 3.
The Raman spectra of unstressed plants (green curves) and stressed plants at 48 h after stress (red curves) of (A) saline, (B) light, (C) drought, and (D) cold. (Insets) Photos of coleus leaves for (Left) unstressed and (Right) stressed plants.
Fig. 4.
(A) The bar distributions for the fit coefficients for carotenoids (brown) and the chemically extracted values for carotenoids (milligrams per gram dry weight; gray) as functions of durations of the abiotic stresses. (B) The bar distributions for the fit coefficients for anthocyanins (violet) and the chemically extracted values for anthocyanins (micrograms per microliter dry weight; black) as functions of durations of the abiotic stresses.
A Remote Raman Spectroscopic Detection of Carotenoids in Plant.
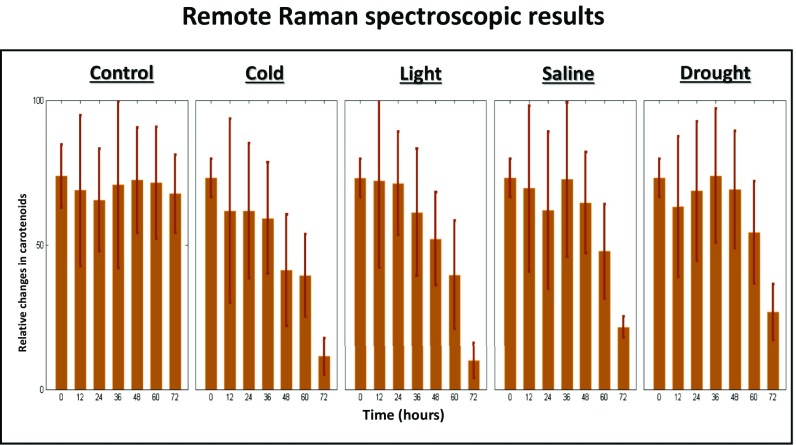
We built a portable at range Raman spectroscopic system. The recorded Raman spectral-relative changes in carotenoids via a portable Raman spectroscopic platform were consistent with the Raman microscopic data, thereby showing the capacity of Raman spectroscopy for real life in vivo monitoring of stress responses of crops in the field (Fig. 5). However, it must be noted that our remote system was not sensitive enough to measure anthocyanins. Additional improvements for our system will be to increase the collection efficiency, reduce background fluorescence, and implement high-sensitivity detectors.
Fig. 5.
The bar distributions for carotenoid-relative changes measured by the remote system as functions of durations of the abiotic stresses.
Comparison of the Raman Technique with Existing in Vivo Plant Stress Sensing Techniques.
The Raman technique shows distinct advantages over established in vivo plant stress sensing techniques, such as reflectance spectroscopy (6), chlorophyll fluorescence spectroscopy (7), IR thermal imaging (8), terahertz time domain spectroscopy (9), and hyperspectral imaging (10). It offers earlier detection, biochemical selectivity, the ability to detect multiple stress conditions, and the detection of initial defense responses. The Raman technique is capable of detecting changes in carotenoids and anthocyanins, which are some of the first line of defense responses of plants during abiotic stress. The existing sensing techniques detect changes in chlorophyll, water status, or physical appearance that are consequences of abiotic stress. Raman spectroscopic system directly detects plant stress responses within 2 d for four different stress conditions. Terahertz time domain spectroscopy (9), which had been considered the fastest existing technique, has indirect detection, is only capable of detecting drought stress, and takes 3 d.
Validations via Chemical Analytical Extractions.
Finally, we performed the traditional chemical analytical extractions. These extractions are, however, destructive methods, and only one pigment’s concentration can be extracted at a time. We collected plant tissues after each Raman spectroscopic measurement. We used the chemical extraction protocols of anthocyanins and carotenoids from refs. 22 and 28, respectively. Fig. 4 shows the absolute values of the total carotenoids (Fig. 4, gray bars) and anthocyanins (Fig. 4, black bars) over time for all treatments. The changes in total carotenoids and anthocyanins from the chemical analysis show strong agreement with the Raman spectroscopic data for all applied stress conditions. It, thus, validates the Raman technique as an appropriate sensor for these pigments.
Conclusions
We showed early detection of plant stress responses using in vivo Raman spectroscopic methods, which have improved sensitivity and the ability to interrogate individual stress indicator pigment molecules simultaneously. The variations in the concentration levels of anthocyanins and photosynthetic carotenoids in coleus plants were observed across abiotic stresses, including high salinity, drought, cold, and excess light. These changes over time after stress induction show Raman spectroscopy as a method of accurate measurement of these molecules and are indicative of the functional relationship of these pigments in response to excessive ROS during abiotic stress. This work furthers our understanding of plant physiology by detecting a negative correlation in the levels of anthocyanins and carotenoids during the stress response. The short-term response across multiple abiotic stresses holds promise for a near-ubiquitous method of abiotic stress detection. Finally, our proposed portable system has the capability to become mobile and automated to allow for increased utility in precision agricultural applications for both breeders and commercial producers. The traditional chemical analytical extraction also validated the existence of the concentration changes in either total anthocyanins or carotenoids. In general, the Raman technique could be a cheap, rapid, and nondestructive alternative to chemical analysis. Because it is in vivo, it detects changes of these molecules over time from one plant, which is impossible in destructive chemical analysis.
Acknowledgments
We acknowledge the support of Office of Naval Research Grant N00014-16-1-3054 and Robert A. Welch Foundation Award A1261. N.A. is supported by the Herman F. Heep and Minnie Belle Heep Texas A&M University Endowed Fund held/administered by the Texas A&M Foundation. M.V.K. is supported by US Department of Agriculture National Institute of Food and Agriculture Grant 2015-67013-22816.
Footnotes
The authors declare no conflict of interest.
References
- 1.Borlaug NE. Ending world hunger. The promise of biotechnology and the threat of antiscience zealotry. Plant Physiol. 2000;124(2):487–490. doi: 10.1104/pp.124.2.487. [DOI] [PMC free article] [PubMed] [Google Scholar]
- 2.Tilman D, et al. Forecasting agriculturally driven global environmental change. Science. 2001;292(5512):281–284. doi: 10.1126/science.1057544. [DOI] [PubMed] [Google Scholar]
- 3.Fiorani F, Schurr U. Future scenarios for plant phenotyping. Annu Rev Plant Biol. 2013;64:267–291. doi: 10.1146/annurev-arplant-050312-120137. [DOI] [PubMed] [Google Scholar]
- 4.Jansen MAK, Gaba V, Greenberg BM. Higher plants and UV-B radiation: Balancing damage, repair and acclimation. Trends Plant Sci. 1998;3(4):131–135. [Google Scholar]
- 5.Bernstein L. Effects of salinity and sodicity on plant growth. Annu Rev Phytopathol. 1975;13:295–312. [Google Scholar]
- 6.Gitelson A, Merziyak M. Signature analysis of leaf reflectance spectra: Algorithm development for remote sensing of chlorophyll. J Plant Physiol. 1996;148:494–500. [Google Scholar]
- 7.Kalaji HM, Bosa K, Janusz K, Hossain Z. Chlorophyll a fluorescence- a useful tool for the early detection of temperature stress in spring barley. J Integr Biol. 2011;15(12):925–934. doi: 10.1089/omi.2011.0070. [DOI] [PubMed] [Google Scholar]
- 8.Zia S, et al. Infrared thermal imaging as a rapid tool for identifying water-stress tolerant maize genotypes of different phenology. J Agron Crop Sci. 2013;199(2):75–84. [Google Scholar]
- 9.Born N, et al. Monitoring plant drought stress response using terahertz time-domain spectroscopy. Plant Physiol. 2014;164(4):1571–1577. doi: 10.1104/pp.113.233601. [DOI] [PMC free article] [PubMed] [Google Scholar]
- 10.Behmann J, Steinrücken J, Plümer L. Detection of early plant stress responses in hyperspectral images. ISPRS J Photogramm Remote Sens. 2014;93:98–111. [Google Scholar]
- 11.Shafer-Peltier KE, et al. Raman micro spectroscopic model of human breast tissue: Implications for breast cancer diagnosis in vivo. J Raman Spectrosc. 2002;33:552–563. [Google Scholar]
- 12.Pestov D, et al. Single-shot detection of bacterial endospores via coherent Raman spectroscopy. Proc Natl Acad Sci USA. 2008;105(2):422–427. doi: 10.1073/pnas.0710427105. [DOI] [PMC free article] [PubMed] [Google Scholar]
- 13.Pestov D, et al. Optimizing the laser-pulse configuration for coherent Raman spectroscopy. Science. 2007;316(5822):265–268. doi: 10.1126/science.1139055. [DOI] [PubMed] [Google Scholar]
- 14.Yang D, Ying Y. Applications of Raman spectroscopy in agricultural products and food analysis: A review. Appl Spectrosc Rev. 2011;46:539–560. [Google Scholar]
- 15.Gierlinger N, Keplinger T, Harrington M. Imaging of plant cell walls by confocal Raman microscopy. Nat Protoc. 2012;7(9):1694–1708. doi: 10.1038/nprot.2012.092. [DOI] [PubMed] [Google Scholar]
- 16.Chalker-Scott L. Environmental significance of anthocyanins in plant stress responses. Photochem Photobiol. 1999;70(1):1–9. [Google Scholar]
- 17.Apel K, Hirt H. Reactive oxygen species: Metabolism, oxidative stress, and signal transduction. Annu Rev Plant Biol. 2004;55:373–399. doi: 10.1146/annurev.arplant.55.031903.141701. [DOI] [PubMed] [Google Scholar]
- 18.Ramel F, et al. Carotenoid oxidation products are stress signals that mediate gene responses to singlet oxygen in plants. Proc Natl Acad Sci USA. 2012;109(14):5535–5540. doi: 10.1073/pnas.1115982109. [DOI] [PMC free article] [PubMed] [Google Scholar]
- 19.Havaux M. Carotenoid oxidation products as stress signals in plants. Plant J. 2013;79:597–606. doi: 10.1111/tpj.12386. [DOI] [PubMed] [Google Scholar]
- 20.Wise RR, Naylor AW. Chilling-enhanced photooxidation: Evidence for the role of singlet oxygen and superoxide in the breakdown of pigments and endogenous antioxidants. Plant Physiol. 1987;83(2):278–282. doi: 10.1104/pp.83.2.278. [DOI] [PMC free article] [PubMed] [Google Scholar]
- 21.Kennedy BF, De Filippis LF. Physiological and oxidative response to NaCl of the salt tolerant Grevillea ilicifolia and the salt sensitive Grevillea arenaria. J Plant Physiol. 1999;155(6):746–754. [Google Scholar]
- 22.Kovinich N, et al. Not all anthocyanins are born equal: Distinct patterns induced by stress in Arabidopsis. Planta. 2014;240(5):931–940. doi: 10.1007/s00425-014-2079-1. [DOI] [PMC free article] [PubMed] [Google Scholar]
- 23.Nguyen P, Cin V. The role of light on foliage colour development in coleus (Solenostemon scutellarioides (L.) Codd) Plant Physiol Biochem. 2009;47(10):934–945. doi: 10.1016/j.plaphy.2009.06.006. [DOI] [PubMed] [Google Scholar]
- 24.Treutter D. Significance of flavonoids in plant resistance and enhancement of their biosynthesis. Plant Biol (Stuttg) 2005;7(6):581–591. doi: 10.1055/s-2005-873009. [DOI] [PubMed] [Google Scholar]
- 25.Petrussa E, et al. Plant flavonoids-biosynthesis, transport and involvement in stress responses. Int J Mol Sci. 2013;14(7):14950–14973. doi: 10.3390/ijms140714950. [DOI] [PMC free article] [PubMed] [Google Scholar]
- 26.Henry A, Chopra S, Clark D, Lynch J. Responses to low phosphorus in high and low foliar anthocyanin coleus (Solenostemon scutellarioides) and maize (Zea mays) Funct Plant Biol. 2012;39(3):255–265. doi: 10.1071/FP11256. [DOI] [PubMed] [Google Scholar]
- 27.Lieber C, Mahadevan-Jansen A. Automated method for subtraction of fluorescence from biological Raman spectra. Appl Spectrosc. 2003;57(11):1363–1367. doi: 10.1366/000370203322554518. [DOI] [PubMed] [Google Scholar]
- 28.Lightenthaler HK, Buschmann C. Extraction of photosynthetic tissues: Chlorophylls and caroteoids. Curr Protoc Food Anal Chem. 2001;55:F4.2.1–F4.2.6. [Google Scholar]
- 29.Lightenthaler HK, Buschmann C. Chlorophylls and carotenoids: Measurement and characterization by UV-VIS spectroscopy. Curr Protoc Food Anal Chem. 2001;55:F4.3.1–F4.3.8. [Google Scholar]
- 30.Baranska M, Roman M, Dobrowolski J, Schulz H, Baranski R. Recent advances in Raman analysis of plants: Alkaloids, carotenoids, and polyacetylenes. Curr Anal Chem. 2013;9(1):108–127. [Google Scholar]
- 31.Schulz H, Baranska M, Baranski R. Potential of NIR-FT-Raman spectroscopy in natural carotenoid analysis. Biopolymers. 2005;77(4):212–221. doi: 10.1002/bip.20215. [DOI] [PubMed] [Google Scholar]
- 32.Brouillard R. The in vivo expression of anthocyanin colour in plants. Phytochemistry. 1983;22(6):1311–1323. [Google Scholar]
- 33.Merlin J, Statoua A, Cornard J, Saidi-Idrissi M, Brouillard R. Resonance Raman spectroscopic studies of anthocyanins and anthocyanidins in aqueous solutions. Phytochemistry. 1994;35(1):227–232. [Google Scholar]
- 34.Buchweitz M, Gudi G, Carle R, Kammerer DR, Schulz H. Systematic investigations of anthocyanin-metal intersctions by Raman spectroscopy. J Raman Spectrosc. 2012;43:2001–2007. [Google Scholar]
- 35.Haka A, et al. Diagnosing breast cancer by using Raman spectroscopy. Proc Natl Acad Sci USA. 2005;102(35):12371–12376. doi: 10.1073/pnas.0501390102. [DOI] [PMC free article] [PubMed] [Google Scholar]


