Abstract
In this paper, we described a new type of bioenabled nano-plasmonic sensors based on diatom photonic crystal biosilica with in-situ growth silver nanoparticles and demonstrated label-free chemical and biological sensing based on surface-enhanced Raman scattering (SERs) from complex samples. Diatoms are photosynthetic marine micro-organisms that create their own skeletal shells of hydrated amorphous silica, called frustules, which possess photonic crystal-like hierarchical micro-& nanoscale periodic pores. Our research shows that such hybrid plasmonic-biosilica nanostructures formed by cost-effective and eco-friendly bottom-up processes can achieve ultra-high limit of detection for medical applications, food sensing, water/air quality monitoring and geological/space research. The enhanced sensitivity comes from the optical coupling of the guided-mode resonance of the diatom frustules and the localized surface plasmons of the silver nanoparticles. Additionally, the nanoporous, ultra-hydrophilic diatom biosilica with large surface-to-volume ratio can concentrate more analyte molecules to the surface of the SERS substrates, which can help to detect biomolecules that cannot be easily adsorbed by metallic nanoparticles.
Index Terms: Biosensors, plasmonic nanoparticles, photonic crystals, surface-enhanced Raman scattering
I. Introduction
Surface-enhanced Raman scattering (SERS) [1], [2] sensing plays pivotal roles in biological and chemical detection as it provides ultra-high sensitivity, label-free sensing capabilities, and unrivaled molecular specificity by probing the vibrational bands of the analyte molecules. Inspired by advanced nanofabrication techniques, rationally designed plasmonic-active SERS substrates have gained tremendous amount of interests in recent years [3]. State-of-the-art progress includes on-wire lithography [4], hollow-core waveguide [5], guided-mode-resonance (GMR)-enhanced surface plasmons [6], nano-antennas [7], metallic gratings [8], slow-light waveguides [9], and metamaterials [10], [11]. However, such SERS substrates require rationally patterned nanoscale features that can only be implemented by expensive e-beam lithography or focused-ion beam (FIB) processes, which prohibits their applications as disposable sensors. These disposable biosensors are envisioned to be widely used for point-of-care (POC) applications [12], personal diagnostics in low-income developing countries, and large-scale sensor network for environmental protection.
Nature is an inspirational source to provide exquisite nanophotonic structures with extremely low fabrication cost. Many photosynthetic marine micro-organisms [13] efficiently capture light for photo-synthesis by imbedding inorganic periodic photonic structure, which is called photonic crystals [14]–[16], into their cell walls. Photonic crystal is a new class of material that provides novel capabilities for the control and manipulation of light [14], [17] using periodic arrays of submicrometer scale low- or high-dielectric-constant materials in a homogeneous dielectric matrix. Many interesting optical phenomena [18], [19] have been observed in photonic crystals, and have demonstrated significant engineering potentials [20], [21], especially as optical sensors [9], [22]. Unlike man-made photonic crystals using cost-prohibitive top-down lithographic and reactive-ion etching techniques, diatoms create their own skeletal shells of hydrated amorphous silica, called frustules, that possess hierarchical micro- and nanoscale photonic crystal structures by bottom-up approach at ambient temperatures and pressures. Diatoms take up water soluble silicic acid from the environment which is then precipitated into amorphous silica within an intracellular nano-bioreactor to form the frustules. Different species of diatoms based on biosilica and coccolithophores based on calcium carbonate with versatile photonic crystal structures have been reported. The potential applications of diatoms in solar cells [23], batteries [24], electroluminescence [25], photoluminescence (PL) [25], [26], nanofabrication templates [27] and selective membranes [28] have been explored by many research groups.
This paper reports our most up-to-date research progress of diatom photonic crystal biosilica SERS substrates fabricated by self-assembling of gold nanoparticles (Au NPs) and in-situ growth of high density silver nanoparticles (Ag NPs), following our previous published work [29]–[31]. Specially, we studied the contribution of the diatom frustule to randomly distributed plasmonic NPs with high density hot-spots. We also demonstrated label-free SERS sensing to detect melamine for food safety, volatile organic compounds (VOCs) for air/water quality monitoring, and organic residues in desert soils with performance surpassing conventional colloidal plasmonic NPs. Our research proves the significant engineering potential of diatom-based SERS sensors for trace level of chemical and biological sensing.
II. Materials And Methods
A. Diatom Photonic Crystal Biosilica
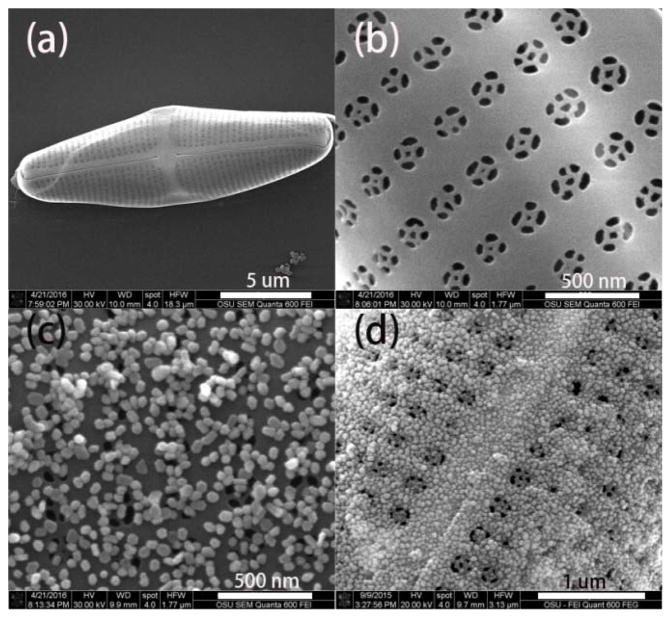
Diatom cells (Pinnularia sp.) were cultivated following the previous report method with minor modification [32]. Briefly, diatoms were cultured in a container for one week. The suspended diatoms were concentrated 10 times by centrifuging and dispersed in sterile filtered artificial seawater and filtered with 20 μm mesh to separate cells. The diatom cell density was adjusted to 2.5 × 10⁵ cells/ml for seeding. A coverslip was placed into a petri dish separately, and 15 ml of diatom cell solution was cast onto the substrate, and incubated in a humidifier chamber for one hour to deposit the cells on the coverslip surface. Then the coverslip with cells was put into a new petri dish, kept in a humidifier for one day and immersed in 70% EtOH for 4 h, and soaked in pure EtOH for 4 more h. The diatoms were dried in air and treated in a UV ozone cleaner at 90 °C for one day. After that, the prepared diatoms were ready for use. The morphology of the diatom biosilica was characterized by scanning electron microscopy (SEM). The SEM images of diatom are shown in Fig. 1(a)–(b). The semi-ellipsoidal cell dimensions for Pinnularia sp are nearly 20 μm along the major axis, 5 μm along the minor axis. The diatom biosilica consists of periodic two-dimensional nanopores with average diameters of 160 nm (Fig. 1(b)) and periodicity of 300 nm.
Fig. 1.
SEM images of (a) an overview of a single diatom frustule, (b) periodic nanopores on a frustule, (c) self-assembled Au NPs on diatom frustule via electrostatic interaction (d) deposited Ag NPs on diatom frustule through in-situ growth method.
B. Au NPs Preparation and Self-Assembly On The Diatom
The glassware used for Au NPs synthesis was cleaned with aqua regia (HNO3/HCl, 1:3, v/v) and washed thoroughly with Milli-Q water. Au NPs with an average diameter of 50 nm were prepared following the reported method with minor modification [33]. Briefly, a total of 100 mL of 1 mM chloroauric acid aqueous solution was heated to reflux under vigorous stirring. 4.2 mL of 1% trisodium citrate solution was added, and the pale yellow solution turned fuchsia within 15 min. The Au colloids were kept refluxing for another 20 min and then cooled to room temperature. To assemble Au NPs onto diatom biosilica, the surface of the diatom substrate was first functionalized with positively charged poly-diallyl-dimethylammonium chloride (PDDA) The diatom substrates were immersed in 1% aqueous solution of PDDA for half an hour followed by rinsing thoroughly with water and then immersed into pre-prepared Au colloids for 6 h, and then thoroughly washed with water. The SEM image of diatom-Au NPs was presented in Fig. 1(c). Au NPs with diameter 60 nm were uniformly distributed on the surface of diatom biosilica.
C. In-Situ Growth Ag NPs on Diatom Biosilica
Due to the electrostatic repulsion between plasmonic NPs, it is difficult to further improve the density of the plasmonic NPs using self-assembling. The method of in-situ growth of nanoparticles on porous materials proposed by Tsukruk’ group was employed with minor modification for integrating high density Ag NPs to diatom photonic crystal biosilica [34]. Briefly, the diatom frustules were first immersed into 20 mM of aqueous solution of SnCl2 and HCl (1:1) for several minutes to deposit Sn2+ on the surface of diatom, and then washed with water, acetone and dried with nitrogen flow. Then the diatom frustules were soaked in a 20 mM aqueous solution of AgNO3 for 5 min to grow Ag seeds on the diatom frustules. After Ag seed deposition, the diatom frustules were immersed in 1.5 mL of growth media (1 mL of 5 mM AgNO3 and 0.5 mL of 50 mM ascorbic acid). The size and density of the Ag nanoparticles could be well controlled as we recently reported [35]. It is clearly seen that high density Ag NPs with diameters around 40 nm were deposited on the surface of the diatom frustule.
D. Instruments and Measurement
SEM images were acquired by FEI Quanta 600 FEG SEM with 15–30 kV accelerating voltage. The Raman spectra were obtained at ambient conditions using a Horiba Jobin Yvon Lab Ram HR800 Raman microscope equipped with a CCD detector, and a 50× objective lens was used for the spectral measurement. Both 532 nm and 785 nm lasers were chosen as excitation wavelengths for Raman measurement with a laser spot size of 1.5 μm in diameter. The confocal pinhole was set to a diameter of 200 μm. Each spectrum was based on the average of 25 measured spectra: we chose five different diatoms and measured the SERS spectra from five different spots on each diatom. Raman mapping images were acquired with 20 × 20-point mapping array. They were collected under the DuoScan module using 0.5 s accumulation time. Fluorescence spectra were collected according to the method previously reported [36]. Briefly, we point to the target sample with the 50× objective lens, with the Horiba Jobin Yvon Lab Ram HR800 Raman system using the 532 nm laser line. Fluorescence microscopy images were collected using Olympus IX73 microscope equipped with X-cite 120 LED fluorescence microscope light source.
III. Results And Discussion
A. Optical Simulation of Metallic NPs on Photonic Crystal Biosilica
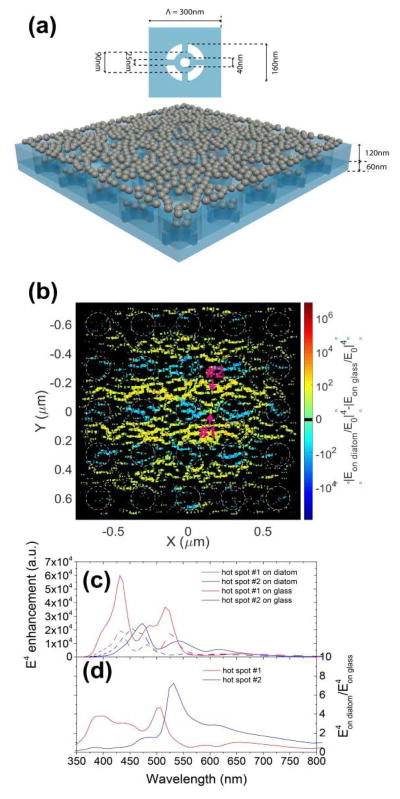
To investigate the optical coupling between the diatom photonic crystal biosilica and metallic NPs, we perform a three-dimensional (3D) finite-difference time domain (FDTD) simulation using FullWAVE module of RSoft photonic component design suite. In our simulation, the periodic porous diatom is modeled as a two-layer structure according to the high resolution SEM images of diatom frustules: a top layer (120 nm thick) with square lattice (300 nm in period) air hole (160 nm in diameter) structure and a bottom layer (60 nm thick) with fine structure as shown in the insert of Fig. 1(a). The structure parameters are measured from the SEM images. Then, randomly distributed Ag NPs with 40 nm diameters are placed on the diatom. Fig. 2(a) illustrates the simulation model. The incident light is a 532 nm wavelength Gaussian beam with a beam diameter of 1.5 μm, which matches our experiment condition. The results are compared with the case where metallic NPs with the same random distribution are placed on glass substrates. We calculate the local |E|4 enhancement (defined as |E/E0|4) distribution around NPs which is proportional to the SERS enhancement factor (EF). The photonic crystal structure increases the local electrical field due to the guided-mode resonance (GMR) [37] although the GMR spectrum may be altered by the NPs layer. Basically, when the photonic crystal biosilica is coupled with the metallic NPs, it further enhances the electric field intensity at the hot spots between NPs and also increases the hot spots density, similar to previously reported simulation results [29]. However, this is the first time to prove the enhancement from photonic crystals to a large number of randomly distributed plasmonic NPs. Fig. 2(b) shows the |E|4 enhancement difference in the hot spots areas of between two cases where NPs are placed on diatom and on a glass substrate. Here we define hot spots to be the points where |E|4 enhancement is bigger than 100. Clearly, there are more EF enhanced areas (yellow) than EF suppressed areas (blue). As a result, the total volume of hot spots increases 50% and the corresponding overall SERS EF increases 2.6 times. To better illustrate the optical coupling enhancement effect, we simulate the |E|4 enhancement spectra at the hot spots labeled in Fig. 2(b), as is shown in Fig. 2(c) and (d). We can see that in both hot spots, |E|4 has a broadband enhancement around 532 nm. The SERS enhancement factor of the hybrid diatom-Ag NPs is around 109 [35], which is nearly two orders of magnitude higher than some well-defined SERS substrates [38], [39].
Fig. 2.
(a) Schematic of the simulated metallic NPs on diatom structure. The top figure is the fine structure of the bottom layer of the diatom model. (b) E4 enhancement difference between NPs on a diatom frustule and NPs on a glass substrate in the hot spots area. (c) E4 enhancement ratio spectrum between NPs on a diatom frustule and NPs on a glass substrate on hot spot #1 and #2, which are labeled in Fig. 2(b). (d) E4 enhancement spectra on hot spot #1 and #2.
B. Hydrophilic Surface of Diatom for Sample Enrichment
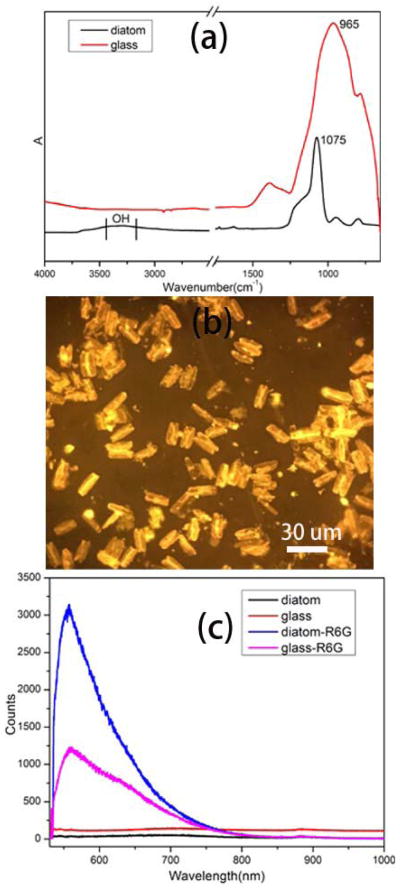
After the diatom biosilica is annealed at 90 °C on the surface of the glass substrate, the diatom frustules are highly hydrophilic compared to the planar glass slide due to the abundant hydroxyl groups and the nanoporous structure. The hydroxyl groups of diatom biosilica and the glass slide was verified by Fourier transform infrared spectroscopy (FT-IR) as shown in Fig. 3(a). The prominent peak between 3200 to 3500 cm−1 wavenumber is assigned to the stretching vibration of hydroxyl group on diatom [40]. For glass slides, the intensity of the IR peak of hydroxyl group is much lower than that of diatoms due to the lower density of hydroxyl group. We have observed liquid flow from the planar glass surface towards the nanoporous diatom frustule during the evaporation process because of the hydrophilic/hydrophobic surfaces and capillary forces [41]. The analyte concentration effect of the hydrophilic diatom biosilica was investigated using Rhodamine 6G (R6G) as the typical probe molecules due to its fluorescence color. First, 2 μL of R6G aqueous solution was dropped onto the glass-diatom substrate. After it dried in air, the substrate was imaged under a fluorescence microscope with green laser as the excitation light. As shown in Fig. 3(b), the orange color from the diatom frustule is brighter than that from the glass slide. The contrast between the diatom and glass was attributed to the analyte concentration effect of diatom frustules. Briefly, the glass-diatom substrate has a relatively large difference in wettability and the analyte solution prefers to flow onto the more hydrophilic porous diatom frustule than the less hydrophilic planar glass slide. As the solution evaporates, the analyte molecules therefore become more and more concentrated in the solution on the diatom surface. At the end of the evaporation, when the solvent (water) disappears completely, the analyte molecules on the diatom surface have a higher density compared to those on the glass slide. The analyte concentration effect of diatoms was further quantitatively verified by fluorescence spectra as shown in Fig. 3(c). The sample used to acquire the fluorescence spectra was same as the one for fluorescence image. The intensity of the fluorescence spectra from diatoms are almost three times as high as that from the glass slide, which agrees with the fluorescence image.
Fig. 3.
(a) FT-IR spectra of diatom and glass slides, (b) fluorescence image of 2 μL of R6G (10−4 M) drop onto the glass-diatom substrate, (c) fluorescence spectra of 2 μL of R6G (10−4 M) solution onto the glass-diatom substrate.
C. Food Safety Sensing
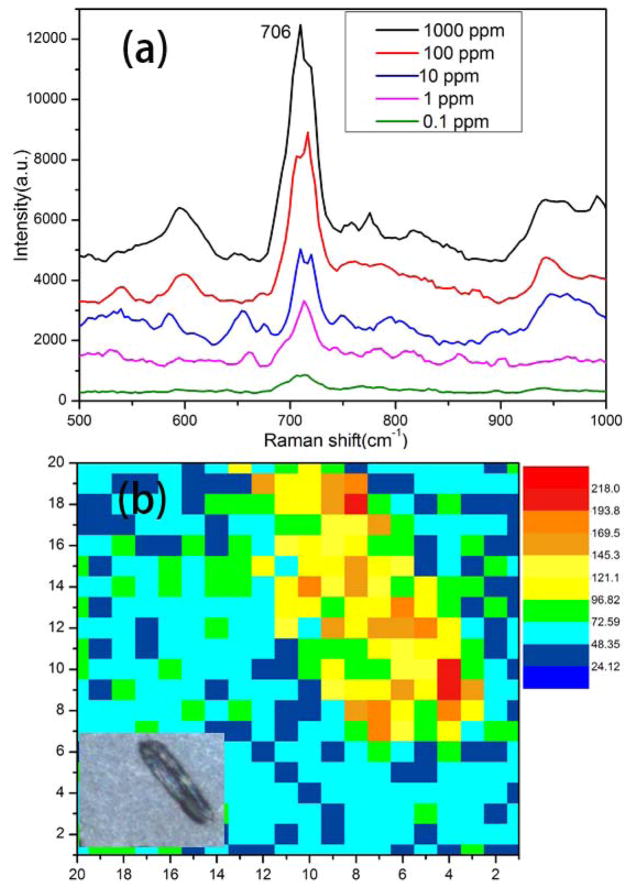
Melamine (C3H6N6), a nitrogen-rich chemical compound commonly used in the production of melamine resins has been illegally added to food products to falsely increase the protein content [42]. The intake of melamine can lead to kidney disease and even death in infants [43], [44]. Thus, the sensitive and accurate detection of melamine is of the utmost importance for food safety. Recently, some new technologies, such as high performance liquid chromatography (HPLC) [45], gas chromatography in tandem with mass spectrometry [46] and enzyme-linked immunosorbent assay (ELISA) [47] are employed for the detection of melamine. SERS has emerged as a more rapid and cost-effective method for the identification of adulterants in foods. We used diatom-Ag NPs SERS substrates for the detection of melamine. Fig. 4(a) shows the SERS spectra of 2 μL of aqueous melamine at different concentrations dropped onto the diatom-Ag NPs substrate. The prominent peak at 706 cm−1 is assigned to the ring-breathing mode of melamine and it can be used as the featured peak for melamine detection. The intensity of the peak decreases gradually with decreasing concentrations of melamine solution from 1000 ppm to 0.1 ppm. The repeatability of this measurement was verified by Raman mapping as shown in Fig. 4(b). The Raman mapping image was plotted according to the integrated peak intensity at 696–716 cm−1. The presence of the diatom photonic structures results in three times improvement compared to that on the flat glass substrate. The variation of the SERS intensity on diatom and glass of Fig. 4(b) was represented by the coefficient of variation (CV = standard deviation/mean), which is 0.25 on diatom and 0.27 on glass, respectively. The reproducibility of the diatom SERS substrate is slightly better than conventional colloidal SERS substrates.
Fig. 4.
(a) SERS spectra of melamine with different concentrations on diatom-Ag substrate, (b) Raman mapping image of melamine (1 ppm) on a single diatom frustule, inset, microscopy image of diatom for Raman mapping.
D. Air/Water Quality Monitoring
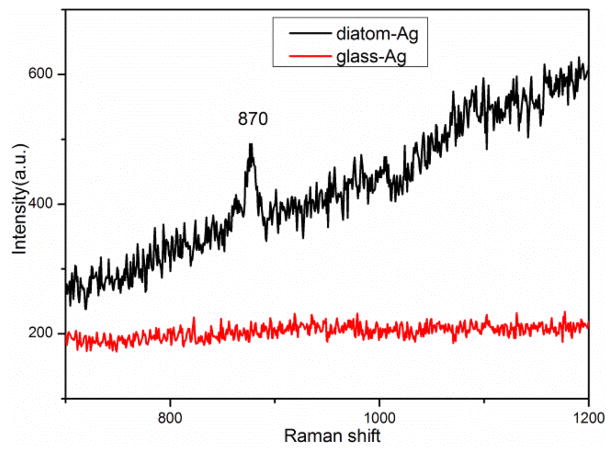
Xylene is a kind volatile organic compound and is usually used as chemical intermediates or solvents in industrial chemistry [48], [49]. Recently, the increasing accumulation of volatile aromatic compounds in water and air has raised health issues and caused public concerns [9]. Gas chromatography (GC) is the mostly used method for xylene analysis in [50]–[52]. Although the GC method could provide reliable results, the complex operation process and expensive instrument limit the application of air/water quality monitoring. SERS is a simple and fast analytical method and has been applied for xylene detection [53]–[55]. However, surface functionalization of the SERS substrates is indispensable in these applications because of the low affinity between xylene and metallic NPs. As a comparison, porous materials have the ability to adsorb organic pollutants in the environment. Thus, diatom-Ag NPs substrates were employed for detecting xylene by SERS directly as shown in Fig. 5. The prominent peak at 870 cm−1 is assigned to the ring vibration mode of para-substituted benzene of p-xylene and used as the featured SERS peak for p-xylene [53]. There were no SERS signals of xylene observed on glass-Ag NPs substrate as xylene volatilizes quickly on the planar substrate. We conclude that the porous structure of diatoms has the ability to adsorb xylene for SERS measurement. Further research is needed is improve the detection sensitivity.
Fig. 5.
SERS spectra of p-xylene (1mM) on diatom and glass substrates.
E. Detect Organic Compounds From Soil
Another application for this diatom based SERS sensor is the detection of trace level of organic matter in soil. For years, NASA and other government and private space agencies have sought to find life on Mars. They have sent probes to Mars with the goal of obtaining soil samples and then testing the samples for organic compounds. The hope is that we can learn more about our neighbor planet and learn more about our solar system. One of the main methods being used is gas chromatography with mass spectroscopy (GC-MS). However, it has been suggested that the perchlorates found in the Martian soil render GC-MS ineffective at detecting organic matter in the sample [56]. In order to get accurate data, we need to use a detection method that is accurate even in the presence of other minerals and compounds such as perchlorates. We applied our diatom based SERS substrate to this problem in an attempt to find a viable solution. We began with a sample of soil from the Mojave Desert supplied to us by Crystal Research. This soil sample was taken from a point in the desert that is known to experience the least amount of rainfall per year and best simulates the conditions experienced by soil on Mars. It is known that organic matter is present in this sample at a concentration of 1 part per million (PPM).
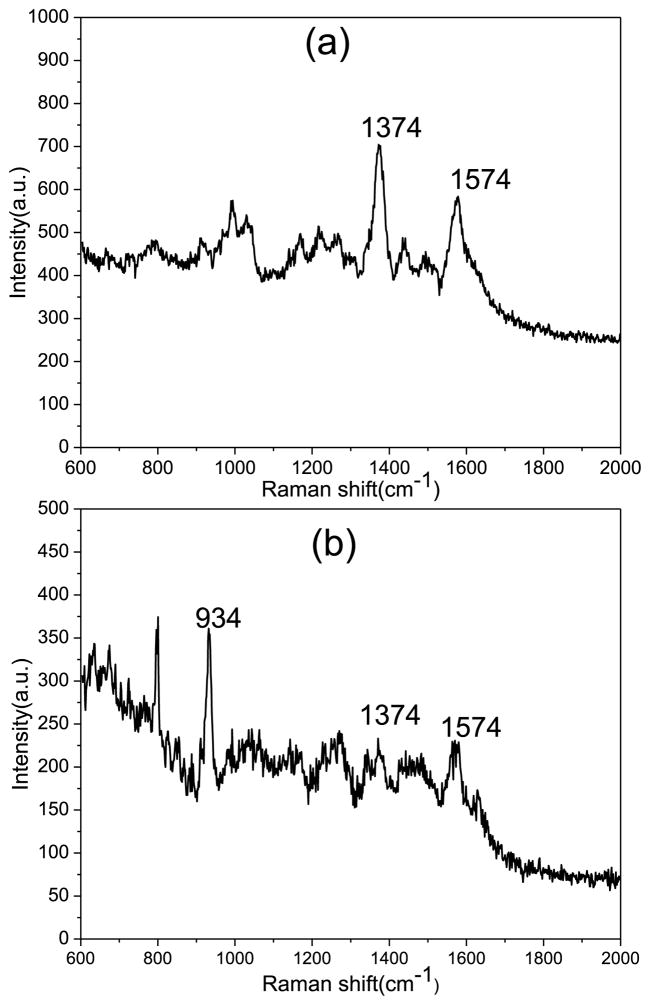
We began our experiment by preparing two soil samples in deionized water. All water used was deionized and came from a Milli-Q water purification system. The first sample is composed of 2.3 g of soil diluted in 2.3 g of water. The second sample is 2.3 g water, 2.3 g soil and 0.023 g of magnesium perchlorate (Mg(ClO4)2). We used a syringe with a 1μm filter to filter out the large particles. We then diluted the samples further to give us an organic matter concentration of 5 parts per billion (PPB). In our experiments we used 785 nm laser as excited laser and with two second exposure time and averaged over two reads. We measured the Raman spectra from our diatom frustules integrated with gold nanoparticles (Au NPs). The spectra are shown on Fig. 6(a). The peak at 1374 cm−1 is due to the D band of graphite and the 1574 cm−1 peak is due to the G band of graphite. Using the same parameters, we measured the Raman spectra of the sample containing Mg(ClO4)2 as shown in Fig. 6(b). In our sample, the perchlorate had a concentration 5000× greater than that of the graphite. The Raman peak at 934 cm−1 is the main peak of the magnesium perchlorate [57]. Even with the concentration of the magnesium perchlorate so much greater than that of the graphite, we were still able to detect the D and G band Raman peaks from the graphite. Through this experiment we have shown that our diatom based SERS substrate enhances the Raman signal and that even in the presence of perchlorates. This method proves the feasibility to detect trace amounts of organic material in soil for space research.
Fig. 6.
(a) Raman spectra of Mojave Desert soil on diatom at 5 PPB, (b) Raman spectra of Mojave Desert soil at 5 PPB and Mg(ClO4)2.
IV. Summary and Conclusion
In conclusion, we described a new type of bioenabled nano-plasmonic sensors based on diatom photonic crystal biosilica with self-assembled Au NPs and in-situ growth Ag NPs, which can provide high-density hot spots with enhanced optical field. We demonstrated label-free chemical and biological SERs sensing from complex samples based on these bioenabled SERS substrates and achieved ultra-high detection sensitivity surpassing traditional colloidal SERS substrates. These cost-effective, high sensitivity SERS substrates will find significant engineering potentials for healthcare, food testing, water and air quality monitoring, and geological analysis.
Acknowledgments
This technical effort was performed with support from the National Institutes of Health under Grant No. 1R03EB018893 and 9R42ES024023. This work was also supported by the U.S. Department of Defense, Office of Naval Research, Synthetic Biology Program, award Number N000141210313 and NASA Ames Research Center through research programs of contract numbers NNX14CA26P and NNX15CA12C, as well as Universidad Nacional Autónoma de Mexico (DGAPA-IN109416); National Council of Science and Technology of Mexico (220626).
Footnotes
Color versions of one or more of the figures in this paper are available online at http://ieeexplore.ieee.org.
Contributor Information
Xianming Kong, School of Electrical Engineering and Computer Science, Oregon State University, Corvallis, OR 97331 USA.
Kenny Squire, School of Electrical Engineering and Computer Science, Oregon State University, Corvallis, OR 97331 USA.
Erwen Li, School of Electrical Engineering and Computer Science, Oregon State University, Corvallis, OR 97331 USA.
Paul LeDuff, School of Chemical, Biological Environmental Engineering, Oregon State University, Corvallis, OR 97331 USA.
Gregory L. Rorrer, School of Chemical, Biological Environmental Engineering, Oregon State University, Corvallis, OR 97331 USA
Suning Tang, Crystal Research, Inc., 2711 Hillcrest Avenue, Suite 208, Antioch, CA 94531 USA.
Bin Chen, NASA Ames Research Center, Moffett Field, CA 94035 USA.
Christopher P McKay, NASA Ames Research Center, Moffett Field, CA 94035 USA.
Rafael Navarro-Gonzalez, Instituto de Ciencias Nucleares Universidad Nacional Autónoma de Mexico, Ciudad Universitaria, Mexico City 04510, Mexico.
Alan X. Wang, School of Electrical Engineering and Computer Science, Oregon State University, Corvallis, OR 97331 USA
References
- 1.Fleischmann M, Hendra PJ, McQuillan AJ. Raman spectra of pyridine adsorbed at a silver electrode. Chem Phys Lett. 1974 May;26(2):163–166. [Google Scholar]
- 2.Jeanmaire DL, Van Duyne RP. Surface Raman spectroelectrochemistry: Part I. Heterocyclic, aromatic, and aliphatic amines adsorbed on the anodized silver electrode. J Electroanal Chem Interfacial Electrochem. 1977 Nov;84(1):1–20. [Google Scholar]
- 3.Banholzer MJ, Millstone JE, Qin L, Mirkin CA. Rationally designed nanostructures for surface-enhanced Raman spectroscopy. Chem Soc Rev. 2008;37(5):885–897. doi: 10.1039/b710915f. [DOI] [PMC free article] [PubMed] [Google Scholar]
- 4.Banholzer MJ, Qin L, Millstone JE, Osberg KD, Mirkin CA. On-wire lithography: Synthesis, encoding and biological applications. Nature Protocols. 2009 May;4:838–848. doi: 10.1038/nprot.2009.52. [DOI] [PMC free article] [PubMed] [Google Scholar]
- 5.Yan H, et al. Hollow core photonic crystal fiber surface-enhanced Raman probe. Appl Phys Lett. 2006;89(20):204101. [Google Scholar]
- 6.Xu X, et al. Guided-mode-resonance-coupled plasmonic-active SiO2 nanotubes for surface enhanced Raman spectroscopy. Appl Phys Lett. 2012;100(19):191114. doi: 10.1063/1.4714710. [DOI] [PMC free article] [PubMed] [Google Scholar]
- 7.Novotny L, van Hulst N. Antennas for light. Nature Photon. 2011 Feb;5(2):83–90. [Google Scholar]
- 8.Grande M, et al. Experimental surface-enhanced Raman scattering response of two-dimensional finite arrays of gold nanopatches. Appl Phys Lett. 2012;101(11):111606. [Google Scholar]
- 9.Lai WC, Chakravarty S, Wang X, Lin C, Chen RT. Photonic crystal slot waveguide absorption spectrometer for on-chip near-infrared spectroscopy of xylene in water. Appl Phys Lett. 2011;98(2):023304. [Google Scholar]
- 10.Kabashin AV, et al. Plasmonic nanorod metamaterials for biosensing. Nature Mater. 2009 Nov;8(11):867–871. doi: 10.1038/nmat2546. [DOI] [PubMed] [Google Scholar]
- 11.Yi S, et al. One-step synthesis of dendritic gold nanoflowers with high surface-enhanced Raman scattering (SERS) properties. RSC Adv. 2013;3(26):10139–10144. [Google Scholar]
- 12.Yager P, Domingo GJ, Gerdes J. Point-of-care diagnostics for global health. Annu Rev Biomed Eng. 2008 Aug;10:107–144. doi: 10.1146/annurev.bioeng.10.061807.160524. [DOI] [PubMed] [Google Scholar]
- 13.Round FE, Crawford RM, Mann DG. Diatoms: Biology and Morphology of the Genera. Cambridge, U.K: Cambridge Univ. Press; 1990. [Google Scholar]
- 14.John S. Strong localization of photons in certain disordered dielectric superlattices. Phys Rev Lett. 1987;58(23):2486. doi: 10.1103/PhysRevLett.58.2486. [DOI] [PubMed] [Google Scholar]
- 15.Joannopoulos JD, Johnson SG, Winn JN, Meade RD. Photonic Crystals: Molding the Flow of Light. Princeton, NJ, USA: Princeton Univ. Press; 2011. [Google Scholar]
- 16.De Stefano L, et al. Nano-biosilica from marine diatoms: A brand new material for photonic applications. Superlattices Microstruct. 2009 Jun-Aug;46(1–2):84–89. [Google Scholar]
- 17.Yablonovitch E. Inhibited spontaneous emission in solid-state physics and electronics. Phys Rev Lett. 1987 May;58(20):2059. doi: 10.1103/PhysRevLett.58.2059. [DOI] [PubMed] [Google Scholar]
- 18.Vlasov YA, O’Boyle M, Hamann HF, McNab SJ. Active control of slow light on a chip with photonic crystal waveguides. Nature. 2005 Nov;438:65–69. doi: 10.1038/nature04210. [DOI] [PubMed] [Google Scholar]
- 19.Fan S, Joannopoulos JD. Analysis of guided resonances in photonic crystal slabs. Phys Rev B. 2002;65(23):235112-1–235112-8. [Google Scholar]
- 20.Wang X, Chakravarty S, Lee BS, Lin C, Chen RT. Ultra-efficient control of light transmission through photonic potential barrier modulation. Opt Lett. 2009;34(20):3202–3204. doi: 10.1364/OL.34.003202. [DOI] [PubMed] [Google Scholar]
- 21.Wang X, Lin CY, Chakravarty S, Luo J, Jen AKY, Chen RT. Effective in-device r33 of 735 pm/V on electro-optic polymer infiltrated silicon photonic crystal slot waveguides. Opt Lett. 2011;36(6):882–884. doi: 10.1364/OL.36.000882. [DOI] [PubMed] [Google Scholar]
- 22.Lai WC, Chakravarty S, Wang X, Lin C, Chen RT. On-chip methane sensing by near-IR absorption signatures in a photonic crystal slot waveguide. Opt Lett. 2011;36(6):984–986. doi: 10.1364/OL.36.000984. [DOI] [PubMed] [Google Scholar]
- 23.Jeffryes C, Campbell J, Li H, Jiao J, Rorrer G. The potential of diatom nanobiotechnology for applications in solar cells, batteries, and electroluminescent devices. Energy Environ Sci. 2011 Nov;4(10):3930–3941. [Google Scholar]
- 24.Song MK, Park S, Alamgir FM, Cho J, Liu M. Nanostructured electrodes for lithium-ion and lithium-air batteries: The latest developments, challenges, and perspectives. Mater Sci Eng R Rep. 2011;72(11):203–252. [Google Scholar]
- 25.Jeffryes C, Solanki R, Rangineni Y, Wang W, Chang CH, Rorrer GL. Electroluminescence and photoluminescence from nanostructured diatom frustules containing metabolically inserted germanium. Adv Mater. 2008 Jul;20(13):2633–2637. [Google Scholar]
- 26.Qin T, Gutu T, Jiao J, Chang CH, Rorrer GL. Photoluminescence of silica nanostructures from bioreactor culture of marine diatom Nitzschia frustulum. J Nanosci Nanotechnol. 2008 May;8(5):2392–2398. doi: 10.1166/jnn.2008.241. [DOI] [PubMed] [Google Scholar]
- 27.Losic D, Mitchell JG, Lal R, Voelcker NH. Rapid fabrication of micro- and nanoscale patterns by replica molding from diatom biosilica. Adv Funct Mater. 2007 Sep;17(14):2439–2446. [Google Scholar]
- 28.Losic D, Rosengarten G, Mitchell JG, Voelcker NH. Pore architecture of diatom frustules: Potential nanostructured membranes for molecular and particle separations. J Nanosci Nanotechnol. 2006 Apr;6(4):982–989. doi: 10.1166/jnn.2006.174. [DOI] [PubMed] [Google Scholar]
- 29.Ren F, Campbell J, Wang X, Rorrer GL, Wang AX. Enhancing surface plasmon resonances of metallic nanoparticles by diatom biosilica. Opt Exp. 2013;21(13):15308–15313. doi: 10.1364/OE.21.015308. [DOI] [PubMed] [Google Scholar]
- 30.Ren F, Campbell J, Rorrer GL, Wang AX. Surface-enhanced Raman spectroscopy sensors from nanobiosilica with self-assembled plasmonic nanoparticles. IEEE J Sel Topics Quantum Electron. 2014 May-Jun;20(3) doi: 10.1109/JSTQE.2014.2301016. Art. no. 6900806. [DOI] [PMC free article] [PubMed] [Google Scholar]
- 31.Yang J, Zhen L, Ren F, Campbell J, Rorrer GL, Wang AX. Ultra-sensitive immunoassay biosensors using hybrid plasmonic-biosilica nanostructured materials. J Biophoton. 2015 Aug;8(8):659–667. doi: 10.1002/jbio.201400070. [DOI] [PMC free article] [PubMed] [Google Scholar]
- 32.Jeffryes C, Gutu T, Jiao J, Rorrer GL. Metabolic insertion of nanostructured TiO2 into the patterned biosilica of the diatom Pinnularia sp. by a two-stage bioreactor cultivation process. ACS Nano. 2008;2(10):2103–2112. doi: 10.1021/nn800470x. [DOI] [PubMed] [Google Scholar]
- 33.Grabar KC, Freeman RG, Hommer MB, Natan MJ. Preparation and characterization of Au colloid monolayers. Anal Chem. 1995;67(4):735–743. [Google Scholar]
- 34.Chang S, Combs ZA, Gupta MK, Davis R, Tsukruk VV. In situ growth of silver nanoparticles in porous membranes for surface-enhanced Raman scattering. ACS Appl Mater Interfaces. 2010;2(11):3333–3339. doi: 10.1021/am100758k. [DOI] [PubMed] [Google Scholar]
- 35.Kong X, et al. Detecting explosive molecules from nanoliter solution: A new paradigm of SERS sensing on hydrophilic photonic crystal biosilica. Biosensors Bioelectron. 2017 Feb;88:63–70. doi: 10.1016/j.bios.2016.07.062. [DOI] [PMC free article] [PubMed] [Google Scholar]
- 36.Guerrero AR, Aroca RF. Surface-enhanced fluorescence with shell-isolated nanoparticles (SHINEF) Angew Chem Int Ed. 2011 Jan;50(3):665–668. doi: 10.1002/anie.201004806. [DOI] [PubMed] [Google Scholar]
- 37.Kim SM, Zhang W, Cunningham BT. Coupling discrete metal nanoparticles to photonic crystal surface resonant modes and application to Raman spectroscopy. Opt Exp. 2010;18(5):4300–4309. doi: 10.1364/OE.18.004300. [DOI] [PubMed] [Google Scholar]
- 38.Ciou SH, Cao YW, Huang HC, Su DY, Huang CL. SERS enhancement factors studies of silver nanoprism and spherical nanoparticle colloids in the presence of bromide ions. J Phys Chem C. 2009;113(22):9520–9525. [Google Scholar]
- 39.Fang J, Yi Y, Ding B, Song X. A route to increase the enhancement factor of surface enhanced Raman scattering (SERS) via a high density Ag flower-like pattern. Appl Phys Lett. 2008;92(13):131115. [Google Scholar]
- 40.Kammer M, Hedrich R, Ehrlich H, Popp J, Brunner E, Krafft C. Spatially resolved determination of the structure and composition of diatom cell walls by Raman and FTIR imaging. Anal Bioanal Chem. 2010 Sep;398(1):509–517. doi: 10.1007/s00216-010-3924-0. [DOI] [PubMed] [Google Scholar]
- 41.Shao J, et al. PLLA nanofibrous paper-based plasmonic substrate with tailored hydrophilicity for focusing SERS detection. ACS Appl Mater Interfaces. 2015;7(9):5391–5399. doi: 10.1021/am508881k. [DOI] [PubMed] [Google Scholar]
- 42.Chan EY, Griffiths SM, Chan CW. Public-health risks of melamine in milk products. Lancet. 2008 Oct;372:1444–1445. doi: 10.1016/S0140-6736(08)61604-9. [DOI] [PMC free article] [PubMed] [Google Scholar]
- 43.Shen JS, Cai QG, Jiang YB, Zhang HW. Anion-triggered melamine based self-assembly and hydrogel. Chem Commun. 2010;46(36):6786–6788. doi: 10.1039/c0cc02030c. [DOI] [PubMed] [Google Scholar]
- 44.Kong X, Du X. In situ IRRAS studies of molecular recognition of barbituric acid lipids to melamine at the air–water interface. J Phys Chem B. 2011;115(45):13191–13198. doi: 10.1021/jp207863x. [DOI] [PubMed] [Google Scholar]
- 45.Ehling S, Tefera S, Ho I. High-performance liquid chromatographic method for the simultaneous detection of the adulteration of cereal flours with melamine and related triazine by-products ammeline, ammelide, and cyanuric acid. Food Addit Contaminants. 2007;24(12):1319–1325. doi: 10.1080/02652030701673422. [DOI] [PubMed] [Google Scholar]
- 46.Hong M, et al. Simultaneous determination of melamine, ammelide, ammeline, and cyanuric acid in milk and milk products by gas chromatography-tandem mass spectrometry. Biomed Environ Sci. 2009 Apr;22(2):87–94. doi: 10.1016/S0895-3988(09)60027-1. [DOI] [PubMed] [Google Scholar]
- 47.Yin W, et al. Preparation of monoclonal antibody for melamine and development of an indirect competitive ELISA for melamine detection in raw milk, milk powder, and animal feeds. J Agricult Food Chem. 2010;58(14):8152–8157. doi: 10.1021/jf1006209. [DOI] [PubMed] [Google Scholar]
- 48.Achilias DS, Roupakias C, Megalokonomos P, Lappas AA, Antonakou EV. Chemical recycling of plastic wastes made from polyethylene (LDPE and HDPE) and polypropylene (PP) J Hazardous Mater. 2007 Nov;149(3):536–542. doi: 10.1016/j.jhazmat.2007.06.076. [DOI] [PubMed] [Google Scholar]
- 49.Oh Y-S, Shareefdeen Z, Baltzis BC, Bartha R. Interactions between benzene, toluene, and p-xylene (BTX) during their biodegradation. Biotechnol Bioeng. 1994 Aug;44(4):533–538. doi: 10.1002/bit.260440417. [DOI] [PubMed] [Google Scholar]
- 50.Gu Z-Y, Yan X-P. Metal–organic framework MIL-101 for high-resolution gas-chromatographic separation of xylene isomers and ethylbenzene. Angew Chem Int Ed. 2010 Feb;49(8):1477–1480. doi: 10.1002/anie.200906560. [DOI] [PubMed] [Google Scholar]
- 51.Dori L, Nicoletti S, Elmi I, Mastrogiacomo AR, Sampaolo L, Pierini E. A gas chromatographic-like system for the separation and monitoring of benzene, toluene and xylene compounds at the ppb level using solid state metal oxide gas sensors. Sensors Mater. 2000;12(3):163–174. [Google Scholar]
- 52.Ji J, Deng C, Shen W, Zhang X. Field analysis of benzene, toluene, ethylbenzene and xylene in water by portable gas chromatography–microflame ionization detector combined with headspace solid-phase microextraction. Talanta. 2006 Jun;69(4):894–899. doi: 10.1016/j.talanta.2005.11.032. [DOI] [PubMed] [Google Scholar]
- 53.Carron K, Peitersen L, Lewis M. Octadecylthiol-modified surface-enhanced Raman spectroscopy substrates: A new method for the detection of aromatic compounds. Environ Sci Technol. 1992;26(10):1950–1954. [Google Scholar]
- 54.Xia D, Guo Q, Ge M, Yuan Y, Xu M, Yao J. On-line sensitive detection of aromatic vapor through PDMS/C3H7S-assisted SERS amplification. RSC Adv. 2016;6(58):53289–53295. [Google Scholar]
- 55.Carron KT, Kennedy BJ. Molecular-specific chromatographic detector using modified SERS substrates. Anal Chem. 1995;67(18):3353–3356. [Google Scholar]
- 56.ten Kate IL. Organics on Mars? Astrobiology. 2010;10(6):589–603. doi: 10.1089/ast.2010.0498. [DOI] [PubMed] [Google Scholar]
- 57.Ruan C, Wang W, Gu B. Surface-enhanced Raman scattering for perchlorate detection using cystamine-modified gold nanoparticles. Anal Chim Acta. 2006 May;567(1):114–120. doi: 10.1016/j.aca.2006.01.097. [DOI] [PubMed] [Google Scholar]


