

Supplemental Digital Content is available in the text
Keywords: clock drift, EEG, EFRP, eye tracking, temporal accuracy, Tobii
Abstract
Eye tracking and event-related potentials have been widely used in the field of cognitive psychology and neuroscience. Both techniques have the ability to refine cognitive models through a precise timeline description; nevertheless, they also have severe limitations. Combining measures of event-related potentials and eye movements can contribute to cognitive process capture, which provides the possibility to determine precisely when and in which order different cognitive operations occur. Combining of event-related potentials and eye movements has been recently conducted by synchronizing measures from an infrared eye tracker with an electroencephalograph to allow simultaneous data recording. Here, we describe in detail 4 types of co-registration methods for event-related potentials and eye movements on the Tobii platform. Moreover, the present investigation was designed to evaluate the temporal accuracy of data obtained using the 4 methods. We found that the method based on the Tobii Pro Analytics software development kit had a higher degree of temporal accuracy than the other co-registration methods. Furthermore, the reasons for the different temporal accuracies were assessed, and potential measures to correct clock drift were taken. General suggestions are made regarding timing in the co-registration of the electroencephalograph and eye tracker.
1. Introduction
In recent 2 decades, electronic and information technology have become increasingly important and popular in vision research, and the advancements in computer science have allowed the development of accurate and precise equipment that can evaluate cognitive processes.[1] Among these techniques, eye tracking and event-related potentials (ERPs) have been widely used in the field of behavioral research. Both techniques can refine cognitive modeling through the precise description of progress over time.[2]
Eye movement (EM) measurements provide a complementary approach to capture cognitive processes with high resolution. Eye tracking technology offers the possibility of capturing visual behavior information in real time and obtaining gaze position within stimuli.[3,4] Recently, this technology has become increasingly accurate and user-friendly, and it has been extended to various fields and applications,[5,6] such as memory,[7] categorizing,[8] sequence learning,[9] face perception,[10] motion perception,[11] object perception,[12–14] and social cognition.[15] However, one of the major difficulties in interpreting EMs is determining whether fixations or saccades represent deeper or more superficial processing. Researchers can only rely on temporal variables such as gaze duration, fixation locations (e.g., salient vs nonsalient features) and saccadic behavior (e.g., reading regression or skipping) to determine the nature of information processing.
Electroencephalography (EEG) is a well-established noninvasive technique for brain monitoring with high temporal resolution and relatively low cost.[16] The limitations of ERP involve, for instance, (a) corneo-retinal distortions in the EEG findings, (b) eye muscular artifacts, and (c) ERP component overlap during free viewing.[17,18] Several techniques such as multisource component analysis[19] and regression-based methods[20] have been developed to process the ocular artifacts; however, researchers usually exclude the contaminated EEG segments to avoid data loss.[21] To avoid the ocular artifacts caused by excessive saccadic EMs such as blinks and saccades, stimuli are presented in isolation and subjects are instructed to keep their eyes fixated on the display to avoid unnecessary EMs, which, however, causes many difficulties, especially for reading or visual scene perception. Another more serious difficulty with the ERP paradigm is that these isolated stimuli are presented with unnatural, long intervals, which prevent overlap between cognitive processes.[22]
For these reasons, combining eye tracking and EEG has been considered by scientists.[1,2] This approach has commonly been implemented using 3 methods: (1) measuring ERPs and electrooculograms (EOG) simultaneously,[23] (2) measuring EMs and ERPs with an eye tracker separately,[24] and (3) measuring ERPs and EMs simultaneously with an eye tracker.[25,26] The last approach is the most commonly used method for the eye-fixation related brain potentials (EFRPs), which was first introduced by Kazai and Yagi.[27] Based on EEG measurements of electrical brain activity in response to eye-fixations, the EFRP technique has been measured by synchronizing the measures from an infrared eye tracker and an EEG; this permits recording of data simultaneously.[25,26,28] For instance, Kamienkowski et al[29] studied about visual search with a combined EEG and eye tracking method in which they presented a novel approach to match the critical properties of 2 conditions (targets/distractors). This approach can be readily adapted to other paradigms to investigate EEG components during free eye-movements Winslow et al[16] combined EEG and eye tracking to study visual search using eye fixations to generate ERPs during a visual search task. The EFRP technique has 3 advantages compared with the 2 previous techniques. One of the most important advantages is its ability to directly couple gaze information with ERPs for the same participant, the same stimulus, and at the same time. Another advantage is to obtain EEG signals in a natural context. In the studies using the EFRP technique, the participants are allowed to move their gaze freely onto any complex stimuli such as reading or viewing pictures, so that experimental settings that allow for a strong ecological validity can be used. Lastly, in the EFRP analyses, the separation of the ERP components may be highly valuable and informative for labeling fixations.[1,2] By combining eye location information and EEG signals, the EFRP technique can also perform more brain–machine interface applications and more accurate cognitive activities, which is conducive to the development of assistive technology.
Each psychological experiment has its purpose and requirements, and many differences exist among hardware and software platforms; accordingly, it is particularly important to choose a suitable co-registration method for an experimental study, and determine its accuracy. Several studies have focused on the accuracy of eye tracking experiments performed on Tobii series platforms, which helps researchers decide what eye tracker is appropriate for the range of tasks and the skill level of the researchers and is a cost-effective solution. Weigle and Banks[30] presented a sample protocol for determining whether a gaze-tracking device accurately reports the location of the user's gaze when the user is instructed to look at a moving target. Morgante et al[31] evaluated the temporal and spatial accuracy of data from the Tobii T60XL eye tracker using visual latency and spatial accuracy tasks. Creel found some sources of inconsistencies in the Tobii eye tracker and proposed several corrective measures and general suggestions regarding timing during eye-tracked data collection.[31,32]
However, few researchers focus on the issues that stem from the temporal alignment of electrophysiological and behavioral data sampled with different devices at different sampling rates. The best solution for timing inconsistency is that all information should be collected with the same clock to ensure that all signals are registered on the same time scale.[32] For many types of eye trackers including the Tobii systems, however, the second best solution can be employed; the 2 clocks of EEG and the eye tracker must be co-registered by external software at both the start and end time points during the experiments. Tobii Pro Studio does not appear to directly generate and transfer synchronous signals to third-party software similar to the EEG signal. Therefore, Tobii Technology AB provides all of the previously described co-registration methods to cover the shortages. Tobii trackers have not often been used in EFRP research due to their relatively low sampling rates and difficulties with interfacing. However, since many labs including our lab own their Tobii equipment, improved methods for synchronizing this hardware with EEG would clearly be useful (We would like to state that this study was not conducted in cooperation with Tobii Technology AB).
Here, we focus on the relevant issue, which is the temporal alignment of electrophysiological and behavioral data. This is a technically complex issue, as the 2 sets of data are acquired with devices running different internal clocks. Ideally one would sample electrophysiological and behavioral data with the same device and the same sampling rate. As this is not impractical in a way, researchers have to use other hardware and software based synchronization methods. Hardware methods include transistor–transistor logic (TTL) pulses to trigger the sampling onset, and software methods include the timing synchronization protocols. These hardware and software might have their own internal latencies; therefore, we need to determine the temporal accuracy of the co-registration of an eye tracker and EEG. The temporal accuracy of co-registration refers to the timing of EMs relative to the EEG results and is a function of the processing capacity and software of computers, the sampling rates of the behavioral equipment, and the network transmission speed.
In the next sections, we describe in detail 4 types of co-registration of the Tobii eye tracker and EEG as well as their degrees of temporal accuracy (or temporal error). Furthermore, based on our results, we also provide some reasonable proposals for cognitive and psychological research requiring the EFRP technique, and we introduce and discuss the feasibility of potential solutions.
2. Methods
2.1. Overview of the methods
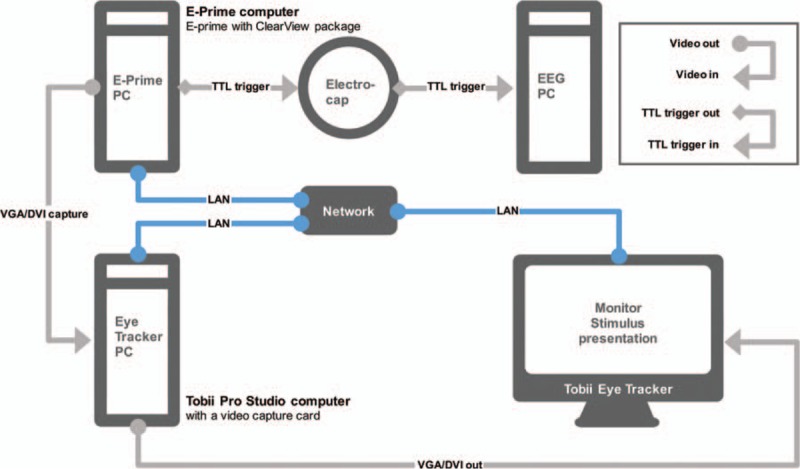
Figure 1 depicts the EFRP experimental setup (Fig. 1), which consisted of 2 computers connected through respective parallel or serial ports.[2] The Eye Tracker Computer, which was connected to the eye tracker server over a local area network (LAN), was devoted to presenting stimuli and acquiring EMs. The EEG Computer, which was connected to the EEG server, collected the EEG signals. The 2 systems were coupled by sending a synchronization signal (TTL trigger) as soon as the stimulus was presented on the monitor and the participant made a response. The synchronization signals enabled the EM and EEG data to be recorded simultaneously and produced an accurate timestamp matching the offline data. Therefore, the most important consideration was ensuring that both signals were sampled at the same rate. However, many commercially available brands of EEG equipment and eye trackers exist. Their sampling frequencies are usually different; thus, each of the companies uses its own methods to solve the problem of co-registration of EEG and eye tracking signals. To compensate for the timing accuracy of the EFRP, this report intends to describe several measures for combining the eye tracker (the Tobii Pro TX300, for instance) and the EEG (the Blackrock series, for instance) data and testing their temporal accuracy as well as accounting for reasons for their varying degrees of accuracy. Furthermore, we briefly outline potential corrective measures and discuss potential solutions.
Figure 1.
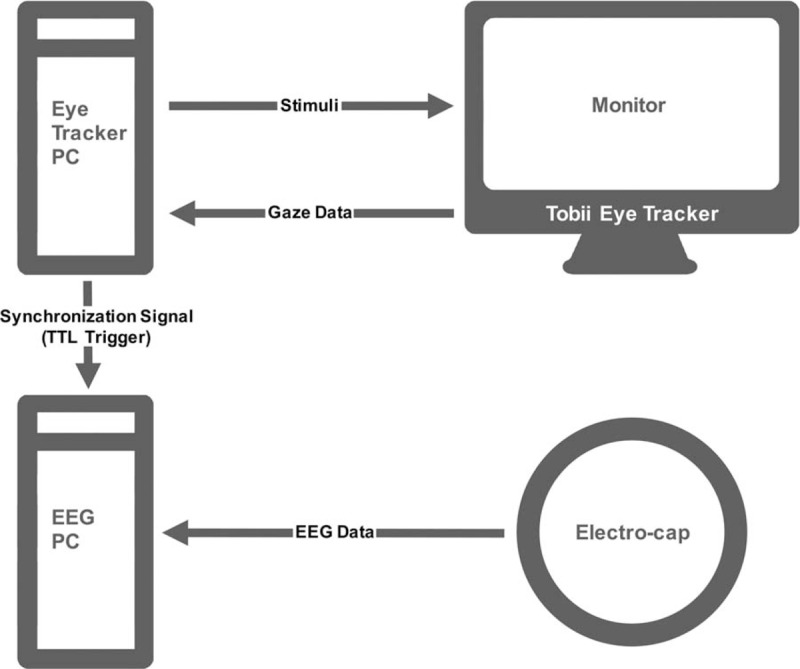
Experimental setup for recording EFRPs. 2 computers were connected through a TTL trigger. The eye tracker server was physically embedded in the experimental-presentation monitor. The Eye Tracker Computer was connected to the eye tracker server over a LAN and devoted to presenting stimuli and collecting EM information. The EEG Computer was connected to the EEG server and devoted to collecting the EEG signals. EEG = electroencephalography, EFRP = eye-fixation related brain potential, EM = eye movement, LAN = local area network, TTL = transistor–transistor logic.
2.2. System configuration
The eye tracker was a Tobii Pro TX300 (developed by Tobii Technology AB, Danderyd, Sweden) with a 300 Hz sampling rate (binocular) and a maximum total system latency of 10 ms.[33] The eye tracker server was integrated into the base of the monitor, which was a 23-inch thin film transistor liquid crystal display with a screen resolution of 1920 × 1080 pixels and screen response time of 5 ms (which was required according to the Tobii Pro TX300 brochure). The eye tracker server was connected to an eye tracker computer running Tobii Pro Studio (bundled software for the Tobii eye tracker and used for presenting stimuli and recording gaze data) and E-Prime.
The EEG device was Cerebus multichannel neuro data recording system (hardware transformed into an EEG device for human-use, developed by Blackrock Microsystem Inc., Salt Lake, UT, USA) that included a 128-Channel Neural Signal Processor with a 1000 Hz sampling rate and 0.1 to 500 Hz analog band-pass. The EEG server was connected to an EEG computer running Cerebus Central Software, which recorded the EEG signals from the electro-cap and TTL coupling triggers from the eye tracker computer.
The computers were Dell computers (Dell Inc., Round Rock, TX, USA) running Windows 7 Ultimate (x64) with a 3.10-GHz Intel Core i5–3450 CPU, a 1-TB (7200 rpm) hard drive, an 8-GB RAM, and an NVIDIA GeForce GT 630 graphics card.
2.3. Procedure
Twenty blank pictures (1920 × 1080 pixels, jpeg formats) were presented on the display monitor in all tests. No participant was eye tracked in the study because this was a timing test for co-registration, which was minimally affected by artificial subjective factors. Our research was just a test of 2 behavioral recording devices without any human participants, so I would like to confirm that our study did not utilize human subjects. Ethical approval was waived or not necessary.
All responses were controlled by keyboard-controlling software, which transferred simulated keyboard signals to make the stimuli begin and end within 3-second, 4-second, or 5-second intervals. Each evaluation consisted of 4 blocks of 20 trials (presenting 20 pictures). Three blocks of each evaluation presented the stimuli for 3-second, 4-second, and 5-second intervals, while the fourth block presented the stimuli for 3-second, 4-second, and 5-second intervals periodically.
2.4. Ethical statement
Our research was just a test of 2 behavioral recording devices without any human participants, so it is confirmed that our study did not utilize human subjects, and the ethical approval was waived and not necessary.
2.5. Algorithmic methods of the temporal error
The temporal error (corresponding to the temporal accuracy) was obtained as shown in Fig. 2. Two timelines represent the time processes of the EM and EEG signals. The timestamps of the starting point (when the stimuli were onset by pressing the keys) and the end point (when the keys were pressed) are also shown in the figure. We denote the timestamps of markers (TTL triggers) recorded by eye tracker as R, and these recorded by EEG as S, i.e.
Figure 2.
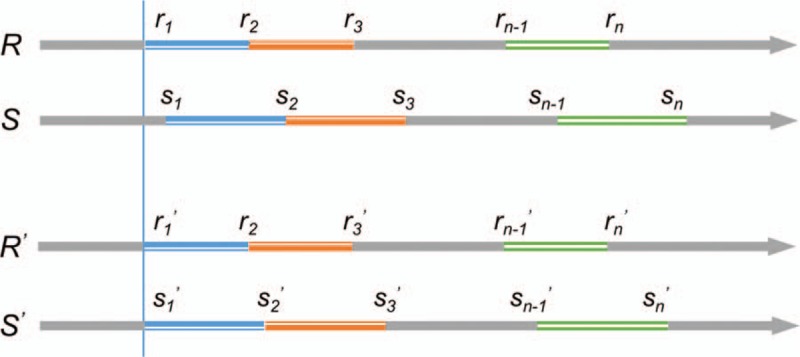
Sample figure showing how the temporal error on 2 synchronous timelines was calculated—only align the first starting point. Line R represents the timeline of eye tracker, whereas Line S represents the timeline of EEG. The 2 timelines represent the raw data of the timelines. The starting times of the timelines were aligned, so that Line R was converted to Line R′ and Line S was converted to Line S′. Then, each temporal error was expressed as S′ – R′ = s1′ – r1′, s2′ – r2′, …, sn′ – rn′. EEG = electroencephalography.
R = r1, r2, …, rn;
S = s1, s2, …, sn.
In order to align the starting times of the 2 sets of clock times, we subtract out the starting times from each set of clock times to make the both clocks started at zero, that is,
R′ = r1 – r1, r2 – r1, …, rn – r1 = r1′, r2′, …, rn′;
S′ = s1 – s1, s2 – s1, …, sn – s1 = s1′, s2′, …, sn′.
Therefore, each temporal error was expressed as,
S′ – R′ = s1′ – r1′, s2′ – r2′, …, sn′ – rn′.
which we called cumulative temporal error (CTE).
Since the previous algorithmic method of temporal error was based on that the starting time points were aligned, lacking of consideration of the delays of the subsequent time points and their accumulation. Therefore, we also employed another method to represent the temporal error.
The timestamps from eye tracker and EEG were also denoted as R and S, respectively, as described previously, then each timestamp from the 2 sets of data subtracted its previous timestamp to make the starting time of each presentation-period align, in other words, we compare the difference of the duration of each stimulus presentation from the eye tracker and the EEG. As shown in Fig. 3, we denote the duration of each stimulus presentation from the eye tracker and the EEG as RTr and RTs, that is,
Figure 3.
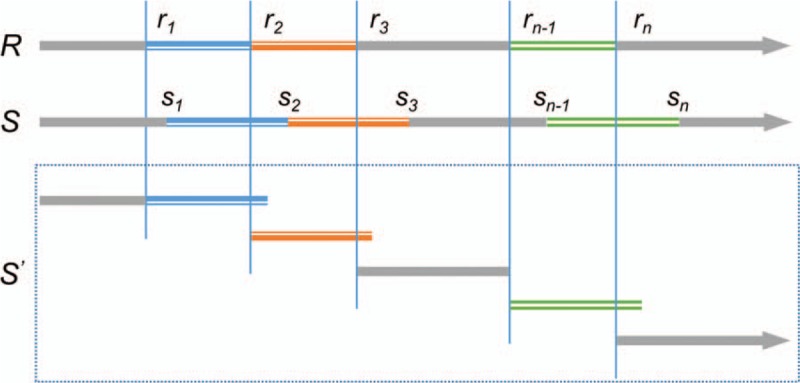
Sample figure showing how the temporal error on 2 synchronous timelines was calculated—align each starting point. Line R represents the timeline of eye tracker, whereas Line S represents the timeline of EEG. The 2 timelines represent the raw data of the timelines. The starting time of each presentation-period was aligned, so that Line S was converted to Line S’. Then, each temporal error was expressed as RTr – RTs = (s2 – s1) – (r2 – r1), (s3 – s2) – (r3 – r2), …, (sn – sn-1) – (rn – rn-1). EEG = electroencephalography.
RTr = r2 – r1, r3 – r2, …, rn – rn−1
RTs = s2 – s1, s3 – s2, …, sn – sn−1
Then, each temporal error was expressed as
RTr – RTs = (s2 – s1) – (r2 – r1), (s3 – s2) – (r3 – r2), …, (sn – sn−1) – (rn – rn−1)
which we called reaction temporal error (RTE).
2.6. Co-registration methods
Experimental flexibility varies for different eye trackers. For instance, the Tobii series (developed by Tobii Technology AB, Stockholm, Sweden) has its own proprietary software, Tobii Pro Studio. Tobii Pro Studio is used to design and implement experimental procedures, and it works well for designs such as fixed-duration trial presentation. Other experimental designs, however, such as the paradigms of combining eye tracking and EEG, cannot be implemented with Tobii Pro Studio alone. This has forced many researchers to use other software with eye tracker interfaces to conduct cognitive or psychological experiments. Since Tobii Pro Studio is not able to send synchronization signals directly, Tobii provided several co-registration methods using the E-Prime Eye Tracking Extensions for Tobii, which allows one to combine E-Prime's experimental design and stimulus presentation with Tobii Pro Studio's eye-tracking data collection and visualization. The extensions include 2 package calls: Tobii Eye Tracker (TET) package Call, contains a set of instructions that interact directly with the Tobii eye tracker server; and the ClearView Package Call, which contains a set of instructions that interact with Tobii Pro Studio, for example, it instructs Tobii Pro Studio to start recording. In this section, we briefly describe 2 co-registration methods using E-Prime extensions for Tobii as the instructions from the Tobii Eye Tracking and E-Prime integration Whitepaper (for details, please read the Tobii eye tracker manuals).[34–36] In addition, we also modified and improved instructive methods from the manual, and specially employed Tobii Pro Analytics software development kit (SDK) to write a co-registration program to implement the synchronization of the EEG and Tobii eye tracker. The original code can be found in supplemental materials online.
For each method, we calculated its mean value and standard deviation of temporal accuracy. We conducted the Levene's test to determine whether the tests for equal variances of the 4 methods were acceptable, if were rejected (P < 0.05), then all temporal errors were tested in relation to each other with the Wilcoxon rank sum test to indicate significant differences. We used R program for statistical computing (R version 3.2.0, Copyright 2015 The R Foundation for Statistical Computing).
2.7. Method 1: E-Prime with a TET package was run on a single computer
E-Prime was run on a Dell computer and communicated with the Tobii eye tracker server over a LAN (TCP/IP protocol). Once the key was pressed (represents the stimulus onset or ending), E-Prime sent a TTL trigger (or synchronization signal) to the EEG server to implement co-registration of the EMs and EEG. The picture stimuli were presented using E-Prime with a TET package. This allowed E-Prime to present stimuli, connect to the eye tracker server, and collect gaze data such as the timestamp, gaze position related to the current calibration, and distance between the subjects’ eyes and the eye tracker[34–36] (Fig. 4).
Figure 4.
Experimental setup for E-Prime with a TET package on a single computer. E-Prime software with a TET package were run on a single computer and communicated with the Tobii Eye Tracker Server. The E-Prime was used to display the stimuli and record the eye movement data, and send TTL triggers to the EEG server to implement synchronization. EEG = electroencephalography, TET = tobii eye tracker, TTL = transistor–transistor logic.
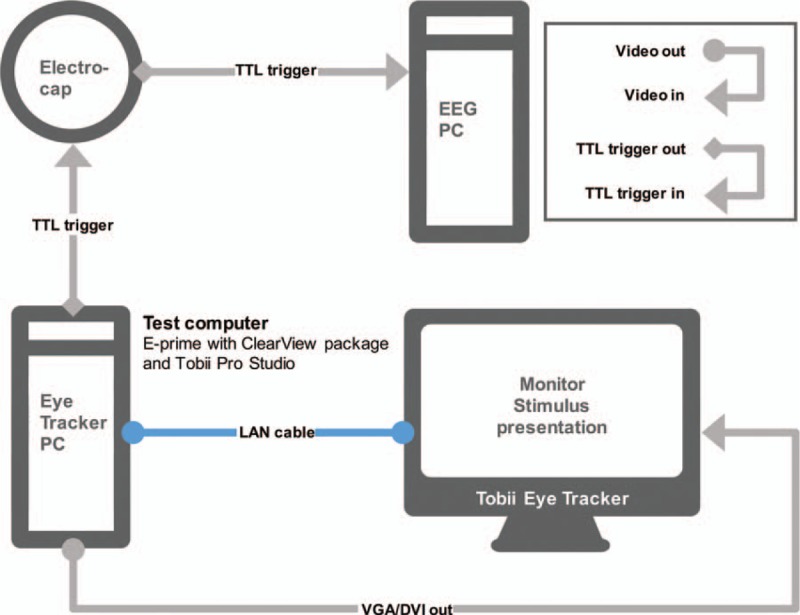
2.8. Method 2: Tobii Pro Studio and E-Prime with a ClearView package were run on 2 different computers
As described in the manual, E-Prime and Tobii Pro Studio software were run on 2 different computers.[34–36] A Dell computer ran E-Prime, presented the stimuli and sent command signals to the Tobii Pro Studio software to start and stop the Tobii Pro Studio recording and insert event markers into the recording. Moreover, Tobii Pro Studio on the other Dell computer collected the gaze data and captured the stimulus video from E-Prime with an external video capture card (Datapath Vision RGB-E1S, developed by Datapath Ltd, Derby, UK). In other words, the second computer captured the stimuli presented by E-Prime and mapped gaze coordinates within Tobii Pro Studio. The 2 computers were linked together via an Ethernet hub. The eye tracker and EEG were coupled by sending TTL triggers from E-Prime once the keys were pressed, as described previously (Fig. 5).
Figure 5.
Experimental setup for Tobii Pro Studio and E-Prime with a ClearView package on 2 different computers. E-Prime software with a ClearView package and Tobii Pro Studio software were run on 2 different computers and communicated with the Tobii Eye Tracker Server as well as between each other over a LAN network (TCP/IP protocol). The stimuli presented by the E-Prime on the eye tracker's display also were recorded by the Tobii Pro Studio and synchronized with the gaze data. The stimulus recording was done via a RGB video capture card installed on the Tobii Studio computer. In addition, the E-Prime computer was used to send TTL triggers to the EEG server for synchronization. EEG = electroencephalography, LAN = local area network, TCP/IP = transmission control protocol/internet protocol, TTL = transistor–transistor logic.
2.9. Method 3: Tobii Pro Studio and E-Prime with a TET package and a ClearView package were run on a single computer
Based on the 2 combining methods described previously, we combine the 2 types of E-Prime Extension for Tobii, which allows researchers to use E-Prime's flexibility to design the stimulus presentation and accurate timing with Tobii Studio's visualizations and calculation of metrics based on Areas Of Interest (AOIs). Furthermore, we implement this combining method on a single computer for improvement and convenience. A Dell computer ran E-Prime with a TET package and a ClearView package, presented the stimuli, and collected gaze information from the Tobii eye tracker server; it sent command signals to the Tobii Pro Studio software to start and stop the Tobii Pro Studio recording and insert event markers into the recording. Moreover, Tobii Pro Studio was used to record the stimulus video from E-Prime and collect the gaze data. The eye tracker and EEG were coupled by sending TTL triggers from E-Prime as soon as the stimulus was presented on the display and the key was pressed, as described previously (Fig. 6).
Figure 6.
Experimental setup for Tobii Pro Studio and E-Prime with a TET package and a ClearView package on a single computer. Tobii Pro Studio software and E-Prime software with a TET package and a ClearView package were run on the same computer and communicated with the Tobii Eye Tracker Server. The stimuli presented by the E-Prime on the eye tracker's display also were recorded by the Tobii Pro Studio and synchronized with the gaze data. In addition, the E-Prime computer was used to send TTL triggers to the EEG server for synchronization. EEG = electroencephalography, TET = tobii eye tracker, TTL = transistor–transistor logic.
2.10. Method 4: the Tobii eye tracker and EEG were directly coupled by Tobii Pro Analytics SDK
The Tobii Pro Analytics SDK contains core features that browse for and connect to Tobii eye tracker server, calibrate the eye tracker to the user's eyes, and subscribe to a stream of eye tracking data that includes full access to and control over the high-resolution clock synchronization between the client computer and the eye tracker. The SDK supports platforms such as Windows, Linux and Mac OS, and languages such as .NET Framework, Python, C++ and MATLAB.[37]
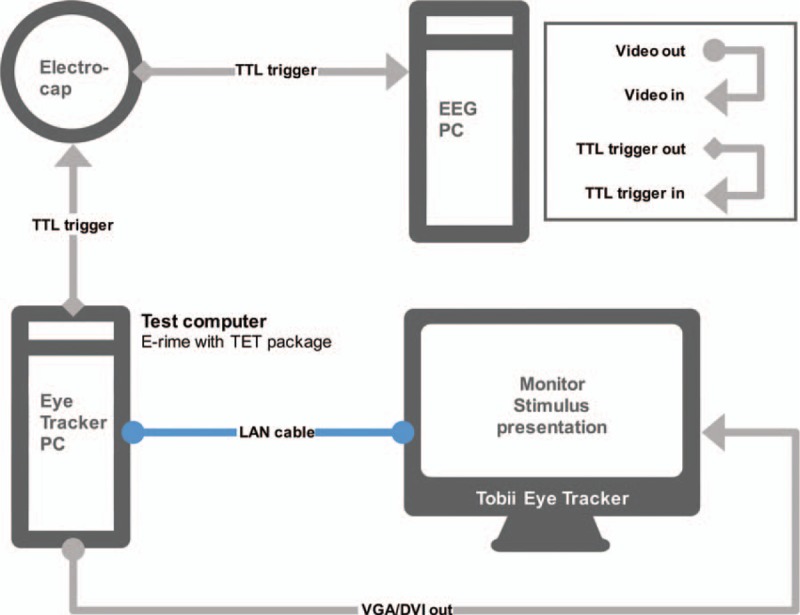
We employed Tobii Pro Analytics SDK for MATLAB to write a co-registration program with the functions of presenting stimuli, recording responses and gaze data, and sending synchronization signals to the EEG server. A Dell computer ran this co-registration program, which sent a TTL trigger to Cerebus Central Software as soon as the stimulus was presented on the display and the key was pressed, and recorded the gaze data from the Tobii eye tracker server (Fig. 7). It is our intent to make the code script freely available to all interested researchers.
Figure 7.
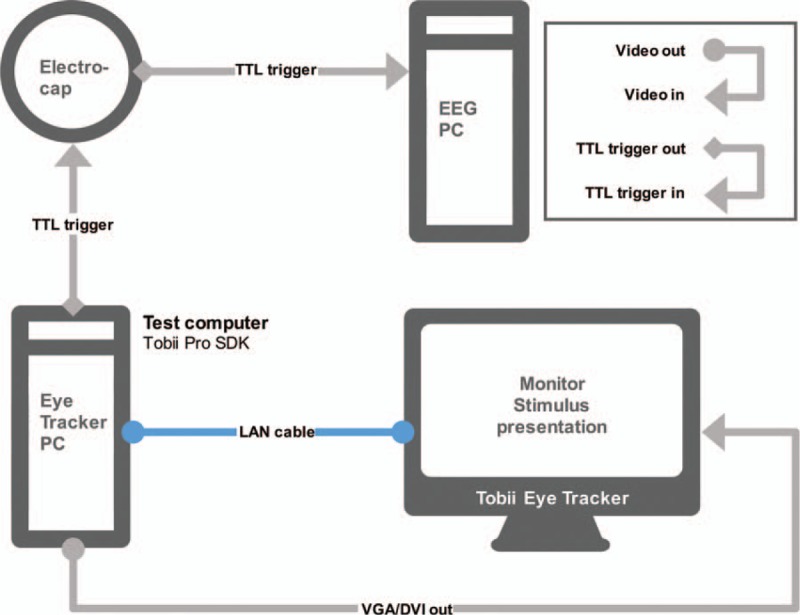
Experimental setup for combining method based on Tobii Pro Analytics SDK. The test computer ran the program based on Tobii Pro Analytics SDK for MATLAB to present stimuli, record the responses and eye movement data, and specially send TTL triggers to the EEG server for synchronization. SDK = software development kit, TTL = transistor–transistor logic.
3. Results
3.1. Evaluation 1
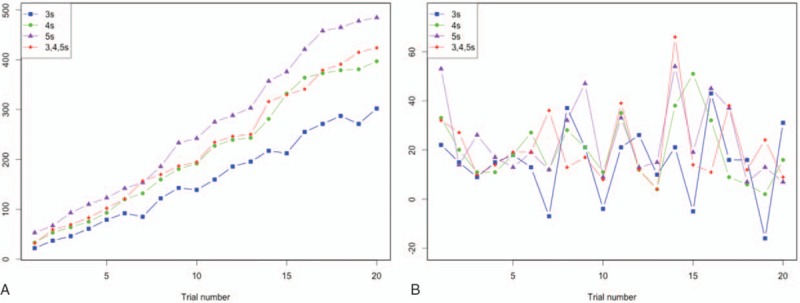
In Method 1, we used E-Prime for stimulus presentation and collection of gaze data, as well as to send TTL triggers to the Cerebus EEG server. At the end of the experiments, gaze information including EM timestamps was obtained from E-Prime, while EEG information, including the synchronous TTL triggers, was obtained from the EEG software. The temporal error was obtained by comparing the timestamps of the following 2 sets of data: (a) from E-Prime, a combined file that contained data regarding eye tracking timestamps (300 Hz) as well as the event markers of the stimulus start and end points and (b) from Cerebus Central Software, a combined file that contained the EEG timestamps (1000 Hz) as well as the synchronous TTL triggers transferred from E-Prime. Data for each task and each trial are shown in Fig. 8, and the results of the CTE were M = 68.2 ms, SD = 38.6 ms, and range = 3 to 142 ms, whereas these of the RTE were M′ = 6.2 ms, SD′ = 7.0 ms, and range = – 10 to 26 ms (Fig. 8).
Figure 8.
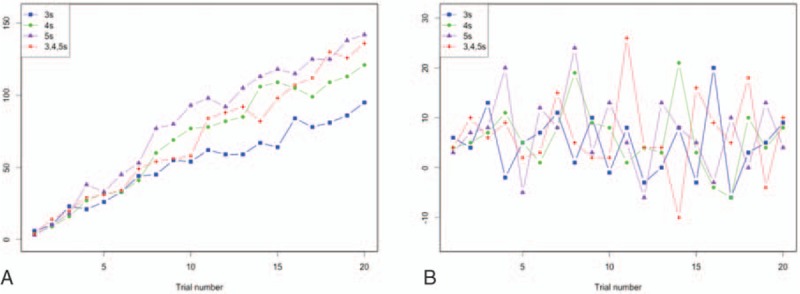
Temporal errors of the 4 tasks in Method 1. The x-axis shows the trial number (1–20), and the y-axis shows the temporal error in ms. (A) The cumulative temporal errors of the 4 different presentation-period tasks are shown. (B) The reaction temporal errors of the 4 different presentation-period tasks are shown.
3.2. Evaluation 2
In Method 2, E-Prime was used to display the stimuli and send TTL triggers to the Cerebus EEG server, while Tobii Pro Studio was used to record the stimulus video from E-Prime and collect the gaze data. The evaluation consisted of a comparison of the following 2 sets of data: (a) from Tobii Pro Studio, a combined file that contained data regarding eye tracking timestamps (300 Hz) as well as the event markers of stimulus start and end points and (b) from Cerebus Central Software, a combined file that contained the EEG timestamps (1000 Hz) as well as the synchronous TTL triggers from E-Prime. The results of the CTE were M = 216.4 ms, SD = 127.2 ms, and range = 22 to 485 ms, whereas these of the RTE were M′ = 20.1 ms, SD′ = 14.7 ms, and range = – 16 to 66 ms (Fig. 9).
Figure 9.
Temporal errors of the 4 tasks in Method 2. The x-axis shows the trial number (1–20), and the y-axis shows the temporal error in ms. (A) The cumulative temporal errors of the 4 different presentation-period tasks are shown. (B) The reaction temporal errors of the 4 different presentation-period tasks are shown.
3.3. Evaluation 3
The procedure for analysis was similar to that described in Evaluation 2. Data for each task and each trial are shown in Fig. 10, and the results of the CTE were M = 48.3 ms, SD = 82.0 ms, and range = – 122 to 192 ms, whereas these of the RTE were M′ = 4.0 ms, SD′ = 86.1 ms, and range = – 176 to 166 ms (Fig. 10).
Figure 10.
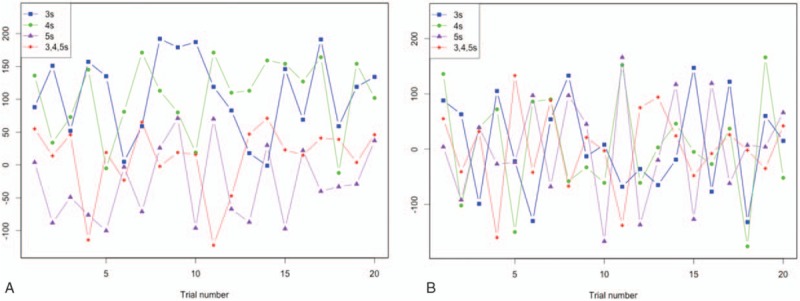
Temporal errors of the 4 tasks in Method 3. The x-axis shows the trial number (1–20), and the y-axis shows the temporal error in ms. (A) The cumulative temporal errors of the 4 different presentation-period tasks are shown. (B) The reaction temporal errors of the 4 different presentation-period tasks are shown.
3.4. Evaluation 4
In Method 4, a manual program (based on Tobii Pro Analytic SDK for MATLAB) was employed to present stimuli, collect the gaze data, and send the synchronous TTL triggers, whereas the Cerebus Central Software recorded the EEG signals as well as the synchronous TTL triggers from the Tobii eye tracker. The evaluation consisted of 2 sets of data from the manual program and Cerebus Central Software, and the results of the temporal error were M = – 2.0 ms, SD = 17.3 ms, and range = – 43 to 46 ms, whereas these of the RTE were M′ = – 0.01 ms, SD′ = 9.2 ms, and range = – 17 to 16 ms (Fig. 11).
Figure 11.
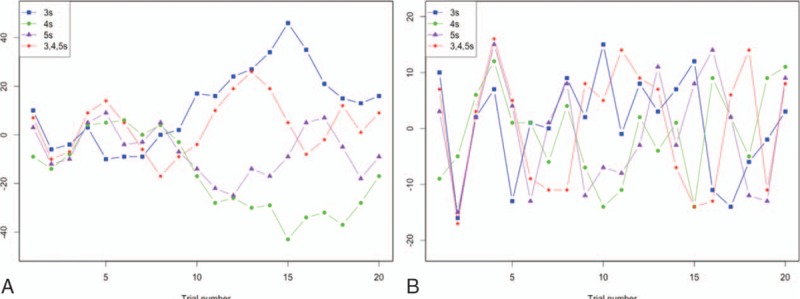
Temporal errors of the 4 tasks in Method 4. The x-axis shows the trial number (1–20), and the y-axis shows the temporal error in ms. (A) The cumulative temporal errors of the 4 different presentation-period tasks are shown. (B) The reaction temporal errors of the 4 different presentation-period tasks are shown.
3.5. General comparison of the 4 co-registration methods
Because the tests for equal variances of the 4 methods were rejected (Levene's test, P < 0.05), all temporal errors were tested in relation to each other with the Wilcoxon rank sum test. In Fig. 12A and B, except between Method 1 and Method 3, the CTEs and RTEs of other methods between each other had statistically significant differences (Wilcoxon rank sum test, P < 0.001); in addition, although the mean value of Method 3's RTE was nearly equal to that of Method 4's RTE, the standard deviation of Method 3's RTE was much higher than that of Method 4's RTE. According to the above results, Method 4 (Tobii eye tracker and EEG were directly coupled by Tobii Pro Analytics SDK) has the highest temporal accuracy (Fig. 12).
Figure 12.
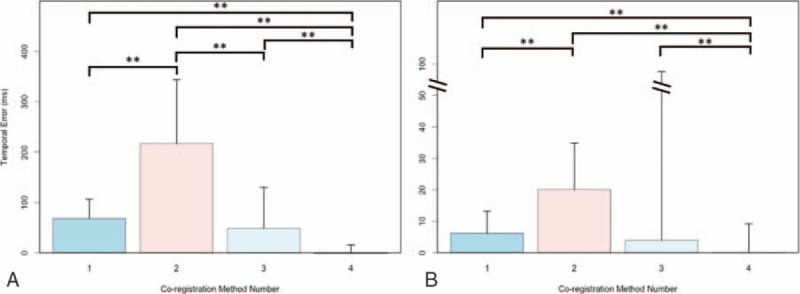
The temporal error box plot of the 4 co-registration methods. The x-axis shows the 4 co-registration method numbers, and the y-axis shows the temporal error in ms. (∗∗ P < 0.001). (A) The cumulative temporal errors of the 4 methods are shown. The y-axis ranges from 0 to 300 ms. (B) The reaction temporal errors of the 4 different presentation-period tasks are shown. The y-axis goes from 0 to 40 ms in units of 1 ms, then shows a “break” (//), and then continues from 40 ms to 100 ms in units of 60 ms.
Compared with the latter 2 co-registration methods, the results of the first 2 methods had a different feature, which was that the latencies were gradually accumulated over trials, as their CTE were linearly increasing in a degree. In addition, the mean results of Method 1 and Method 3 were similar, however, the CTE of Method 1 appeared to grow without bounds over trials, and Method 3 had a higher standard deviation. Both CTE and RTE of Method 4 had a stable performance.
4. Discussion
Researchers who would like to obtain the EEG results during free viewing tasks such as reading and visual scene perception must be faced with some technical and data-analytical problems. Dimigen et al[17] identified 4 major challenges, of which the first one is the requirement for accurate and precise co-registration of gaze position. To solve this problem, for many paradigms, the researcher may need to know the timing of the co-registration of EEG and eye tracking signals. Accurate timing of their co-registration is critical in studies that involve reading and visual scene perception.[38–43] This occurs because a risk of drawing incorrect conclusions about the cognitive capacities exists if inaccurate timing is present.
The 2 packages mentioned previously—TET and ClearView—allowed E-Prime to connect the eye tracker server and the EEG server, and the 2 systems were coupled by sending a synchronization signal through their parallel or serial ports as soon as the stimulus was presented on the display. Method 1 and Method 2 were implemented according to the Tobii manual's description; however, the CTEs of these 2 methods appeared to grow without bounds over trials, and had higher temporal errors (hundred-millisecond orders of CTE), which would not meet most EFRP experimental demands. Therefore, a third co-registration method was implemented based on the previous instructive methods from the manual; Method 3, which had a similar CTE value of Method 1 and did not appear to grow without bounds over trials as Method 1 did, may be allowed to be one of the combining methods. Many commercial corporations including Tobii do not want to disclose their proprietary software designs for recording EMs or for providing visualization of data analysis. However, this is usually contrary to the purposes of researchers who also would like to understand exactly how the system works or to reconstruct the system to meet specific experimental requirements.[32] To overcome the limitations above, we used Tobii Pro Analytics SDK to write a co-registration program for cognitive research methods that require the EFRP technique. Furthermore, the degree of temporal accuracy was higher when compared to other combination measures, as shown in the previous sections. The direct connection to the eye tracker by the SDK and the reduced influence of external factors may explain this higher temporal accuracy.
When conducting precise time studies, many influences can cause timing errors. For instance, undesired processes running in the computer may interrupt running programs and cause an exceptional delay. The amount of time required for the computer to search the files stored in the memory is another consideration. Second, during the synchronous period, the responding times of the eye tracker and the EEG may be different according to the network status, and the synchronization between the host and the client can therefore be affected. Third, even though the 2 devices are started simultaneously, there can be offsets due to their different running rates.[33] Lastly, a built-in delay is inherent in the process of a computer updating the monitor and displaying new pictures on the screen.[44] In other words, time also depends on the monitor's refresh frequency (a typical rate for most monitors is 60 Hz, or approximately 16.7 ms) when a saccade starts during an eye tracker's sampling phase.
To some extent, clock drift of co-registration can be corrected simply by various solutions. First, the timestamps from the eye tracker server and the EEG server are required to be obtained simultaneously at both the starts and ends of the experiment and trials included, which can be implemented by the co-registration methods as described above or other appropriate solutions.[32] There are many solutions available for obtaining these time clocks. For instance, the Psychtoolbox-3 in MATLAB provides a function of GetSecs() that can collect the current computer time clocks. Besides, the Tobii Pro Analytics SDK provided by Tobii also has some effective and user-friendly functions that can achieve similar functionality (see the guidance manual of Tobii for detailed usage).[37]
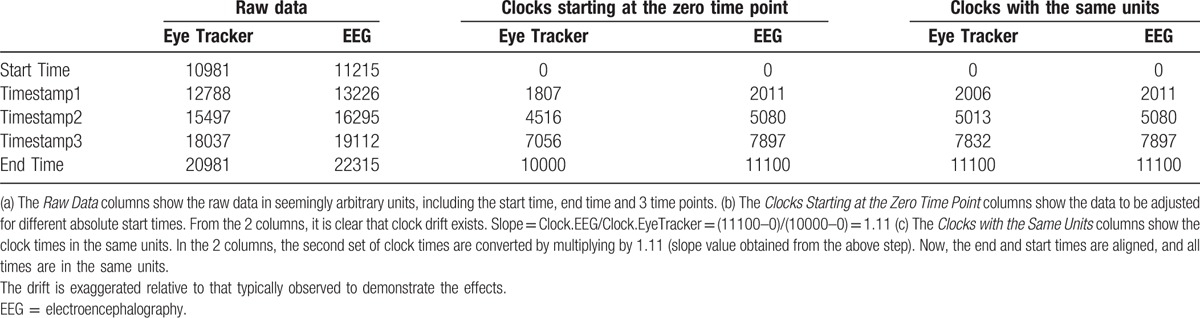
After the clock times from EEG and eye tracker are available, the following methods can be implemented for clock drift correction. First, it needs to be determined whether the clock drift of the 2 sets of clock times exists (the 2 left columns in Table 1). Then, each timestamp (including the starting time, end time and other middle time points, which indicates the time of a block start/end) for each column is required to subtract the starting time, so that the 2 sets of clocks take the Zero as the starting point. As shown from the 2 middle columns in Table 1, the end time points are different, so the clock drift of the 2 clocks exists. Second, the clock drift can be corrected by employing a linear transformation to implement the 2 clocks in the same units. Using the information presented in Table 1, each time points from eye tracker should be multiplied by 1.11 (11,100 ms/10,000 ms). Then, the 2 clocks will display the same clock units (the 2 right columns in Table 1) and can be correctly interdigitated for the following analysis.
Table 1.
Schematic table showing how to correct for clock drift.
The open source EYE-EEG toolbox has been around for some years and it is the software that has been most often used and cited in published EFRP research. EYE-EEG is a plugin for the open-source MATLAB toolbox EEGLAB developed with the goal to facilitate integrated analyses of electrophysiological and oculomotor data. While it does not support Tobii, it already implements the data-realignment based on start and end markers that is theoretically proposed as a new solution here. EYE-EEG also implements more advanced options, for example, optimized clock alignment by means of a linear regression model that considers all recorded time markers in both systems for optimal alignment, not just the start and end marker (as proposed here, see Table 1). Given that EYE-EEG is well-documented and used by different EFRP groups, it is rather high-accuracy solutions for non-Tobii hard- and software.
The EFRP technology, as with each new technological method, has its own problems and challenges. Further studies are required to confirm the effects of various factors that affect the synchronization signal components. In particular, future research is needed to determine how to remove the influence of pre-saccades and micro-saccades in the fixations as well as in the analysis of overlapping processes to extract the effective ERP components. This will require continuous efforts and breakthroughs in the technique.
An important issue regarding the limitations of this investigation should be raised at the end of the article. We have not yet systematically evaluated other eye trackers and EEG equipment for timing accuracy. In addition, our evaluations were performed with a specific model of eye tracker and EEG, and a specific operating system on specific computers. The extent to which the specific timing accuracy values that we reported above will extend to other eye trackers and EEG equipment is not known.
Acknowledgments
The authors thank Dr. Yiming Lu for critical discussion and suggestions.
Supplementary Material
Footnotes
Abbreviations: AOI = area of interest, API = application programming interface, CTE = cumulative temporal error, EEG = electroencephalography, EFRP = eye-fixation related brain potential, EM = eye movement, EOG = electrooculography, ERP = event-related potential, LAN = local area network, RTE = reaction temporal error, SDK = software development kit, TCP/IP = transmission control protocol/internet protocol, TTL = transistor–transistor logic.
Authorship: Conceived and designed the experiments—JX, CQ, JY. Performed the experiments—JX, CQ, CL. Analyzed the data—JX. Contributed reagents/materials/analysis tools—JX. Wrote the paper—JX, JY, CZ.
Funding: Funding was provided by the AMMS Innovation Fund (2015CXJJ005).
The authors have no conflicts of interest to disclose.
Supplemental Digital Content is available for this article.
References
- [1].Baccino T. Eye movements and concurrent event-related potentials’: eye fixation-related potential investigations in reading. Oxford Handbook of Eye Movements 2011. 857–70. [Google Scholar]
- [2].Baccino T, Drai-Zerbib V. A new cognitive engineering technique: eye-fixation-related potentials, Paper presented at: The 5th PSU-UNS International Conference on Engineering and Technology, 2011. [Google Scholar]
- [3].Hansen DW, Ji Q. In the eye of the beholder: a survey of models for eyes and gaze. IEEE Trans Pattern Anal Mach Intell 2010;32:478–500. [DOI] [PubMed] [Google Scholar]
- [4].Jaskula B, Pancerz K, Szkola J. Toward synchronization of EEG and eye-tracking data using an expert system. Concurrency Specification Programming 2015;1:196–8. [Google Scholar]
- [5].Duchowski AT. A breadth-first survey of eye-tracking applications. Behav Res Meth Instrum Comput 2002;34:455–70. [DOI] [PubMed] [Google Scholar]
- [6].Jacob RJK. The use of eye movements in human–computer interaction techniques: what you look at is what you get. ACM Trans Inform Syst 1991;9:152–69. [Google Scholar]
- [7].Richmond J, Nelson CA. Relational memory during infancy: evidence from eye tracking. Dev Sci 2009;12:549–56. [DOI] [PubMed] [Google Scholar]
- [8].Quinn PC, Doran MM, Reiss JE, et al. Time course of visual attention in infant categorization of cats versus dogs: evidence for a head bias as revealed through eye tracking. Child Dev 2009;80:151–61. [DOI] [PubMed] [Google Scholar]
- [9].Kirkham NZ, Slemmer JA, Richardson DC, et al. Location, location, location: development of spatiotemporal sequence learning in infancy. Child Dev 2007;78:1559–71. [DOI] [PubMed] [Google Scholar]
- [10].Frank MC, Vul E, Johnson SP. Development of infants’ attention to faces during the first year. Cognition 2009;110:160–70. [DOI] [PMC free article] [PubMed] [Google Scholar]
- [11].Kato M, de Wit TC, Stasiewicz D, et al. Sensitivity to second-order motion in 10-month-olds. Vis Res 2008;48:1187–95. [DOI] [PubMed] [Google Scholar]
- [12].Amso D, Johnson SP. Selection and inhibition in infancy: evidence from the spatial negative priming paradigm. Cognition 2005;95:B27–36. [DOI] [PubMed] [Google Scholar]
- [13].von Hofsten C, Kochukhova O, Rosander K. Predictive tracking over occlusions by 4-month-old infants. Dev Sci 2007;10:625–40. [DOI] [PubMed] [Google Scholar]
- [14].Johnson SP, Davidow J, Hall-Haro C, et al. Development of perceptual completion originates in information acquisition. Dev Psychol 2008;44:1214–24. [DOI] [PMC free article] [PubMed] [Google Scholar]
- [15].Falck-Ytter T, Gredeback G, von Hofsten C. Infants predict other people's action goals. Nat Neurosci 2006;9:878–9. [DOI] [PubMed] [Google Scholar]
- [16].Winslow B, Carpenter A, Flint J, et al. Combining EEG and eye tracking: using fixation-locked potentials in visual search. J Eye Mov Res 2013;6:1–1. [Google Scholar]
- [17].Dimigen O, Sommer W, Hohlfeld A, et al. Coregistration of eye movements and EEG in natural reading: analyses and review. J Exp Psychol 2011;140:552–72. [DOI] [PubMed] [Google Scholar]
- [18].Kliegl R, Dambacher M, Dimigen O, et al. Eye movements and brain electric potentials during reading. Psychol Res 2012;76:145–58. [DOI] [PubMed] [Google Scholar]
- [19].Berg P, Scherg M. A multiple source approach to the correction of eye artifacts. Electroencephalogr Clin Neurophysiol 1994;90:229–41. [DOI] [PubMed] [Google Scholar]
- [20].Wallstrom GL, Kass RE, Miller A, et al. Automatic correction of ocular artifacts in the EEG: a comparison of regression-based and component-based methods. Int J Psychophysiol 2004;53:105–19. [DOI] [PubMed] [Google Scholar]
- [21].Jung TP, Makeig S, Humphries C, et al. Removing electroencephalographic artifacts by blind source separation. Psychophysiology 2000;37:163–78. [PubMed] [Google Scholar]
- [22].Dambacher M, Kliegl R. Synchronizing timelines: relations between fixation durations and N400 amplitudes during sentence reading. Brain Res 2007;1155:147–62. [DOI] [PubMed] [Google Scholar]
- [23].Yagi A, Imanishi S, Konishi H, et al. Brain potentials associated with eye fixations during visual tasks under different lighting systems. Ergonomics 1998;41:670–7. [DOI] [PubMed] [Google Scholar]
- [24].Sereno SC, Rayner K, Posner MI. Establishing a time-line of word recognition: evidence from eye movements and event-related potentials. Neuroreport 1998;9:2195–200. [DOI] [PubMed] [Google Scholar]
- [25].Baccino T, Manunta Y. Eye-fixation-related potentials: Insight into parafoveal processing. J Psychophysiol 2005;19:204–15. [Google Scholar]
- [26].Hutzler F, Braun M, Vo ML, et al. Welcome to the real world: validating fixation-related brain potentials for ecologically valid settings. Brain Res 2007;1172:124–9. [DOI] [PubMed] [Google Scholar]
- [27].Kazai K, Yagi A. Integrated effect of stimulation at fixation points on EFRP (eye-fixation related brain potentials). Int J Psychophysiol 1999;32:193–203. [DOI] [PubMed] [Google Scholar]
- [28].Simola J, Holmqvist K, Lindgren M. Right visual field advantage in parafoveal processing: evidence from eye-fixation-related potentials. Brain Lang 2009;111:101–13. [DOI] [PubMed] [Google Scholar]
- [29].Kamienkowski JE, Ison MJ, Quiroga RQ, et al. Fixation-related potentials in visual search: a combined EEG and eye tracking study. J Vis 2012;12:4. [DOI] [PubMed] [Google Scholar]
- [30].Weigle C, Banks DC. Analysis of eye-tracking experiments performed on a Tobii T60, Proc SPIE 6809. Visualization Data Anal 2008;680903:923–8. [Google Scholar]
- [31].Morgante JD, Zolfaghari R, Johnson SP. A critical test of temporal and spatial accuracy of the Tobii T60XL eye tracker. Infancy 2012;17:9–32. [DOI] [PubMed] [Google Scholar]
- [32].Creel SC. Looking forward: comment on Morgante, Zolfaghari, and Johnson. Infancy 2012;17:141–58. [DOI] [PubMed] [Google Scholar]
- [33].Tobii Technology. Timing guide for Tobii eye trackers and eye tracking software. Stockholm, Sweden: Tobii Technology AB; 2010. [Google Scholar]
- [34].Tobii Technology. Tobii Eye Tracking and E-Prime integration: Quick Start Guide. Stockholm, Sweden: Tobii Technology AB.; 2010. [Google Scholar]
- [35].Schneider W, Eschman A, Zuccolotto A. User Manual E-Prime Extensions for Tobii. Sharpsburg, PA: Psychology Software Tools, Inc; 2009. [Google Scholar]
- [36].Schneider W, Eschman A, Zuccolotto A. E-Prime Extensions for Tobii. Pittsburgh: Psychology Software Tools, Inc; 2002. [Google Scholar]
- [37].Tobii Technology. Tobii Analytics SDK 3.0: Developer's Guide. Stockholm, Sweden: Tobii Technology AB; 2013. [Google Scholar]
- [38].Makin ADJ, Poliakoff E, Ackerley R, et al. Covert tracking: a combined ERP and fixational eye movement study. PloS One 2012;7:e38479. [DOI] [PMC free article] [PubMed] [Google Scholar]
- [39].Jordan TR, Fuggetta G, Paterson KB, et al. An ERP assessment of hemispheric projections in foveal and extrafoveal word recognition. PloS One 2011;6:e23957. [DOI] [PMC free article] [PubMed] [Google Scholar]
- [40].Domínguez-Martínez E, Parise E, Strandvall T, et al. The fixation distance to the stimulus influences ERP quality: an EEG and eye tracking N400 study. PloS One 2015;10:e0134339. [DOI] [PMC free article] [PubMed] [Google Scholar]
- [41].Healy G, Smeaton AF. Eye fixation related potentials in a target search task. Conf Proc IEEE Eng Med Biol Soc 2011;2011:4203–6. [DOI] [PubMed] [Google Scholar]
- [42].Devillez H, Guyader N, Guérin-Dugué A. An eye fixation-related potentials analysis of the P300 potential for fixations onto a target object when exploring natural scenes. J Vis 2015;15:20. [DOI] [PubMed] [Google Scholar]
- [43].Devillez H, Kristensen E, Guyader N, et al. Time course of the P300 Eye-Fixation Related Potential during the visual search for a target embedded in natural scenes. J Vis 2015;15:205. [DOI] [PubMed] [Google Scholar]
- [44].Maguire M, Magnon G., Fitzhugh A. E-Prime and Tobii Eye-Tracker Configuration: A Methodological Manual. Stockholm, Sweden: Tobii Technology AB. [Google Scholar]
Associated Data
This section collects any data citations, data availability statements, or supplementary materials included in this article.