Abstract
To evaluate quantitative hepatitis B surface antigen (qHBsAg) as a diagnostic marker for inactive carriers (ICs) and hepatitis B surface antigen (HBsAg) seroclearance in hepatitis B e antigen (HBeAg)-negative chronic hepatitis B (CHB) patients. We retrospectively studied 300 HBeAg-negative CHB patients with initial serum hepatitis B virus (HBV) Deoxyribonucleic acid (DNA) levels <2000 IU/mL. Serum HBV DNA and alanine aminotransferase (ALT) levels were monitored every 6 months for 24 months. ICs were identified as having persistent HBV DNA levels <2000 IU/mL and normal ALT levels, whereas active carriers (ACs) were identified as having HBV DNA levels ≥2000 IU/mL, with or without elevated ALT levels. The serum qHBsAg level was defined at baseline and evaluated as a diagnostic predictor using a receiver-operating characteristic curve. The study group comprised 134 men and 166 women with a median age of 41.5 years. At baseline, 200 ICs displayed lower levels of qHBsAg (1492 IU/mL) compared with 100 ACs (2936 IU/mL) (P = 0.005). The qHBsAg level was independently associated with the IC state and HBsAg seroclearance. Baseline qHBsAg levels <1000 IU/mL and HBV DNA levels <2000 IU/mL, when detected simultaneously, allowed for identification of ICs with 41% sensitivity and 72% specificity. Fifteen patients (5%) displayed HBsAg seroclearance after 24 months. A qHBsAg cutoff value of <50 IU/mL provided 100% sensitivity and 92% specificity in predicting HBsAg seroclearance. The qHBsAg level at a single timepoint among HBeAg-negative CHB patients with low HBV DNA levels at baseline was not a predictive marker for ICs; however, it accurately predicted spontaneous HBsAg seroclearance at 24 months.
Keywords: HBeAg-negative chronic hepatitis B, HBsAg seroclearance, inactive carrier, quantitative hepatitis B surface antigen
1. Introduction
Chronic hepatitis B infection (CHB) is a major health problem in Thailand.[1] Despite the expansion of Thailand's immunization program in 1992, the carrier rate in the country remained as high as 4.5%. The estimated total number of CHB patients in Thailand was 2.22 million in a recent report.[2]
Hepatitis B e antigen (HBeAg)-negative CHB becomes more prevalent with age in the CHB population.[3] It is associated with clinical conditions ranging from the inactive carrier (IC) state to immune-reactive HBeAg-negative CHB or the active carrier (AC) state. ICs have low or undetectable levels of hepatitis B virus (HBV) Deoxyribonucleic acid (DNA) and normalized alanine aminotransferase (ALT) levels compared with ACs, which display fluctuations in viral replication and biochemical activity. ICs are also associated with a better prognosis and a lower incidence of cirrhosis and hepatocellular carcinoma (HCC) than ACs. Although 67% to 80% of carrier patients are in the IC state, 10% to 20% of these may display reactivation. It therefore becomes difficult to differentiate between real ICs and ACs, and serial testing of HBV DNA and ALT levels is necessary.[4]
Spontaneous hepatitis B surface antigen (HBsAg) seroclearance is a rare event in HBeAg-negative CHB, with an annual incidence of 1% to 2%. Most patients who undergo HBsAg seroclearance show excellent clinical outcomes and are effectively “cured.” Several determinants of HBsAg seroclearance include old age, male sex, HBV genotype B, and low serum HBV DNA levels.
Recently, serum quantitative HBsAg (qHBsAg) levels have been shown to be correlated with intrahepatic DNA and can therefore be a useful indicator in the management of CHB patients. In some studies, qHBsAg levels have been shown to indicate the IC state and HBsAg seroclearance, with different cutoff levels according to different genotypes.[5] However, both HBV genotyping and HBV DNA testing are expensive to perform. In this study, we tried to develop a qHBsAg assay that could be practically applied in countries with limited resources and a high prevalence of hepatitis B virus genotypes B/C.
2. Materials and methods
2.1. Patients
We performed a retrospective study of our longitudinal cohort study that included 2293 CHB patients who presented in the outpatient liver clinic at Chulabhorn Hospital from 2010 onward. These patients were followed every 6 months to determine their carrier status, and serum ALT and serum HBV DNA levels.
The inclusion criteria were HBeAg-negative/anti-HBe positive status and HBV DNA < 2000 IU/mL at the initial visit, follow-up duration of 24 months, no antiviral therapy during the entire follow-up period, and no coinfection with hepatitis C or HIV. All patients with a diagnosis of liver cirrhosis, either by histology or ultrasonographic findings, or patients with HCC were excluded.
Patients were classified as ICs if they displayed persistent serum HBV DNA levels <2000 IU/mL and normal ALT levels during the follow-up period, whereas those having HBV DNA levels greater than 2000 IU/mL with or without elevated ALT levels were classified as ACs.[6] From July 2010 to July 2012, 300 HBeAg-negative CHB cases met the inclusion criteria for our study.
Serum qHBsAg levels were quantified at baseline and at 24 months. When the level of qHBsAg fell below 0.05 IU/mL at 24 months, we classified this as HBsAg seroclearance.
This study met the guidelines of the Helsinki Declaration and was approved by the Ethical Committee for Human Research at Chulabhorn Research Institute. Informed consent was obtained from all participants.
HBV genotyping was not performed in our study; however, in previous studies, most Thai CHB patients have been reported to be infected with genotype B and C viruses. Based on the sequence of the S gene, 87.5% of patients were found to be infected with genotype C virus, while 10.5% were infected with viruses of genotype B.[7]
2.2. Laboratory analysis
Biochemical tests were performed using routine automated techniques. HBeAg, anti-HBe, anti-HCV, and anti-HIV levels were determined using a commercial electrochemiluminescence immunoassay (COBAS 6000/e601; Roche Diagnostics, Mannheim, Germany), and an ALT assay using a serum autoanalyzer (Cobas c501/600; Roche Diagnostics).
2.2.1. Quantitative HBsAg assay
Serum qHBsAg levels were determined by an electrochemiluminescence method using an Elecsys HBsAg II Quant assay (COBAS 600/e601; Roche Diagnostics). The sensitivity of the assay ranged from 0.05 to 130 IU/mL. Samples with qHBsAg titers higher than 130 IU/mL were diluted to 1:400 to enable reading of the results.
2.2.2. HBV DNA assay
Serum HBV DNA levels were determined by a real-time polymerase chain reaction assay (COBAS AmpliPrep/CobasTaqman; Roche Diagnostics, Pleasanton, CA), with a lower detection limit of 20 IU/mL of HBV DNA.
2.3. Statistical analysis
The frequency and median values were determined for categorical and continuous variables. The differences between groups were analyzed using the Mann–Whitney U test for continuous variables, while the χ2 test and Fisher exact test were used for categorical variables. Logistic regression analysis was used to identify factors independently associated with ICs and HBsAg seroclearance status.
The area under the receiver-operating curve (AUROC) was used to determine the predictive value of serum qHBsAg for detecting ICs and HBsAg seroclearance. The cutoff point was determined based on the coordinates of the receiver-operating characteristic (ROC) curve. All analyses were performed using the statistical program Stata/SE v.12 software, (StataCorp LP, College Station, TX). A P value ≤0.05 was considered statistically significant.
3. Results
3.1. Patient characteristics at initial visit
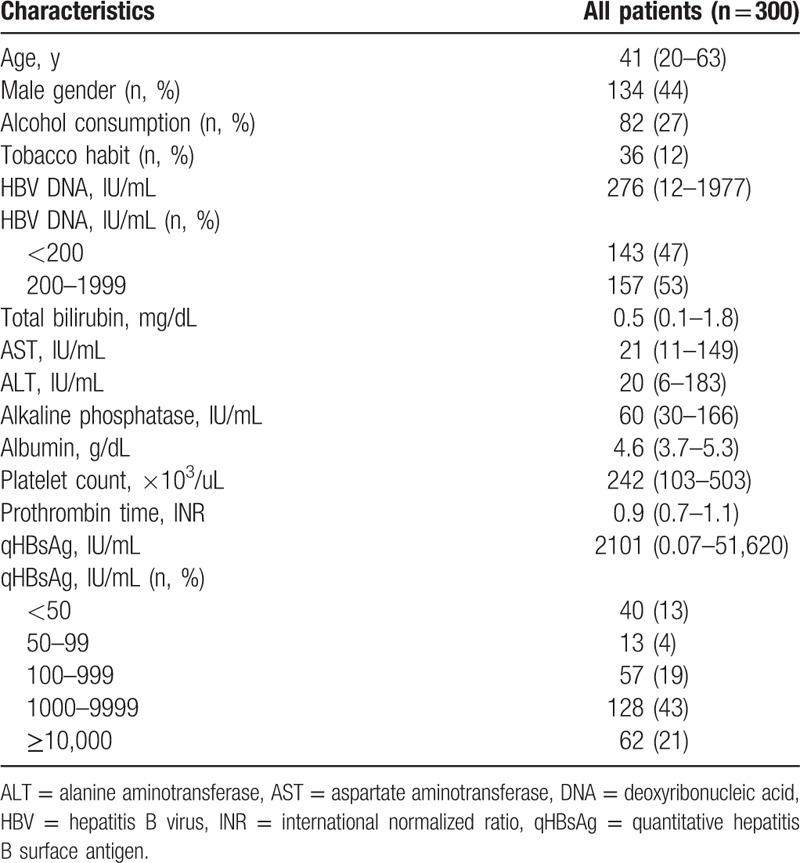
A total of 300 patients, including 134 men and 166 women, with a median age of 41.5 ± 9.4 years (range, 20–63 years), were enrolled in the study. The baseline median serum HBV DNA level was 490 (range, 12–1977) IU/mL, and 47% of patients had HBV DNA levels lower than 200 IU/mL. Of these patients, 110 (36%) had serum qHBsAg levels <1000 IU/mL, and the baseline median serum qHBsAg level was 2101 (range, 0.07–51,620) IU/mL (Table 1). Other results of routine liver function tests were within normal range.
Table 1.
Baseline characteristics of all patients.

3.2. Comparison of baseline clinical variables between ACs and ICs
Based on our results, 200 patients were classified as ICs, and 100 patients were classified as ACs in this study (Table 2). The baseline serum HBV DNA level in the IC group was 137 (range, 12–1977) IU/mL, significantly lower than that in the AC group (846 IU/mL; range, 12–1939; P < 0.001). In addition, the IC group had significantly lower serum qHBsAg levels than the AC group (1492 vs 2936 IU/mL, respectively, P = 0.005). There were no significant differences between the AC and IC groups when age, sex, alcohol consumption, smoking habits, and baseline ALT levels were compared.
Table 2.
Baseline demographic data comparing ACs with ICs.

In multivariate analysis, both serum HBV DNA levels (log10 IU/mL) (odds ratio [OR], 0.17; 95% confidence interval [CI], 0.10–0.29, P < 0.001) and serum qHBsAg levels (log10 IU/mL) (OR, 0.68; 95% CI, 0.49–0.96; P < 0.001) were independently associated with IC status.
3.3. Kinetics of qHBsAg (log IU/mL) between ACs and ICs
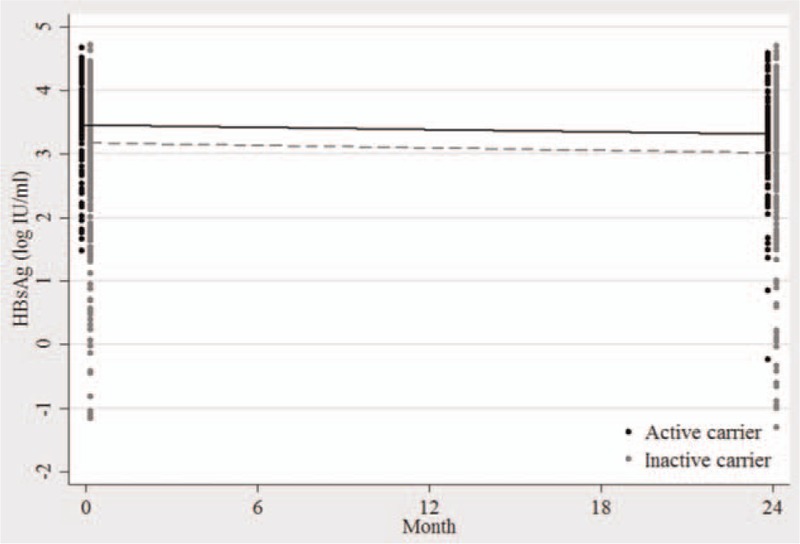
The changes in median qHBsAg levels (log10 IU/mL) in patients who are ACs and ICs are depicted in Fig. 1. During follow-up period, there is a statistically significant qHBsAg reduction in both ACs and ICs (P < 0.001 and P < 0.001, respectively). At 2 years, the log reductions in qHBsAg for AC group and IC group were 0.12 (range, −0.31 to 2.18) and 0.15 (range, −0.63 to 2.82), respectively. No significant difference in log reduction in qHBsAg was found between both groups.
Figure 1.

Kinetics of median serum hepatitis B surface antigen (log10 IU/mL) in patients who are active carrier (black) and inactive carrier (gray).
3.4. Predictive efficacy of baseline serum qHBsAg and HBV DNA levels for detecting ICs
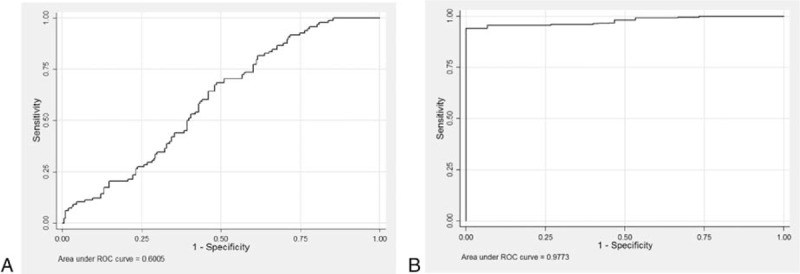
The ROC curve was analyzed for its ability to predict the IC state from baseline serum qHBsAg levels. For serum qHBsAg levels <1000 IU/mL and HBV DNA levels <2000 IU/mL, the IC state can be predicted with 41% sensitivity and 72% specificity. The AUROC was 0.6 (95% CI, 0.54–0.67) (Fig. 2A), whereas if the serum qHBsAg level was <50 IU/mL and the HBV DNA level was <2000 IU/mL, the specificity increased to 98% but sensitivity decreased to 14%.
Figure 2.

(A) Receiver-operating characteristic (ROC) curve of baseline quantitative hepatitis B surface antigen (qHBsAg) levels for predicting inactive carriers. The area under the ROC curve was 0.60 (95% confidence interval [CI], 0.54–0.67) when qHBsAg level was <1000 IU/mL. (B) ROC curve of baseline qHBsAg levels for hepatitis B surface antigen seroclearance. The area under the ROC curve was 0.97 (95% CI, 0.96–0.99) when qHBsAg level <50 IU/mL.
3.5. Comparison of baseline clinical variables between patients who did or did not display HBsAg seroclearance
During the follow-up period, 15 patients underwent spontaneous HBsAg seroclearance, all of which were in the IC group. At the time of HBsAg loss, 14 patients had undetectable HBV DNA levels and 1 patient showed a serum HBV DNA level of 83 IU/mL.
Patients who were able to clear HBsAg displayed significantly lower baseline serum HBV DNA levels and serum qHBsAg levels than those who were unable to clear HBsAg (Table 3). All patients who showed HBsAg seroclearance had baseline serum qHBsAg levels <50 IU/mL.
Table 3.
Baseline demographic data comparing cases with and without HBsAg seroclearance.

In multivariate analysis, the serum qHBsAg level (log10 IU/mL) (OR, −1.53; 95% CI, −2.23 to −0.83; P < 0.001) was the only factor independently associated with the HBsAg seroclearance status.
3.6. Kinetics of qHBsAg (log IU/mL) between patients who did and did not display HBsAg seroclearance
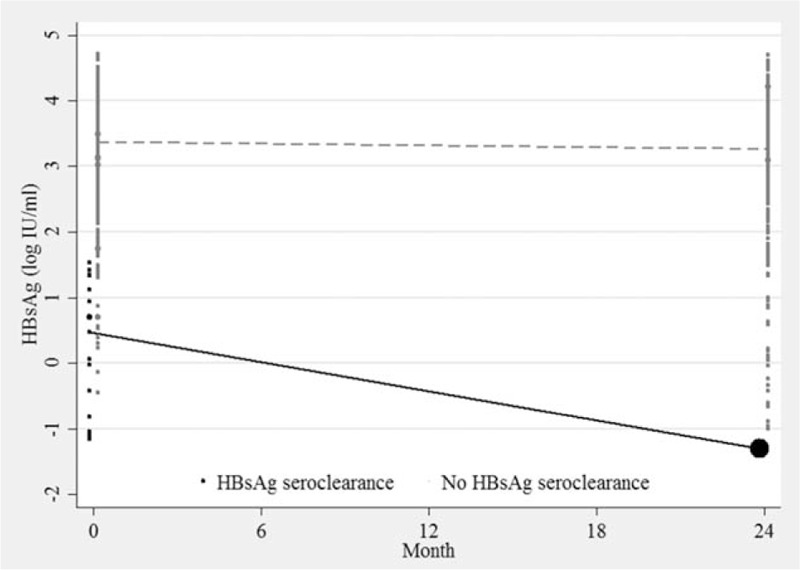
Among patients who had HBsAg seroclearance at months 24, we observed significant log reduction in qHBsAg. The log reduction in qHBsAg in HBsAg seroclearance group was 1.78 (range, 0.15–2.82), whereas only 0.13 (range, −0.63 to 2.18) in another group (P < 0.001) (Fig. 3).
Figure 3.

Kinetics of median serum hepatitis B surface antigen (log10 IU/mL) in patients who display hepatitis B surface antigen (HBsAg) seroclearance (black) and did not display HBsAg seroclearance (gray).
3.7. Predictive efficacy of baseline serum qHBsAg and HBV DNA levels for detecting HBsAg seroclearance
Based on ROC analysis, the serum qHBsAg cutoff point to most accurately predict the 2-year probability of HBsAg seroclearance was <50 IU/mL, with HBV DNA <2000 IU/mL, which provided 100% sensitivity and 92% specificity (AUROC, 0.97; 95% CI, 0.96–0.99) (Fig. 2B).
4. Discussion
CHB infection is dynamic in nature, as reflected by the correlation between the immune response and viral replication. A longitudinal follow-up of ALT and HBV DNA levels and/or assessment of liver histology in CHB patients can determine the phase of infection and guide treatment choices.[6] However, this method is not applicable to limited-resource countries because of the high cost involved and the need for frequent monitoring.
HBsAg is a glycosylated envelop protein of HBV virions. It can be synthesized from translated messenger RNAs of transcriptionally active covalently closed circular DNA and also from integrated HBV DNA sequences. The levels of HBsAg reflect the degree of host immune control over HBV infection.[8] Quantitative HBsAg has recently been proposed as a prognostic biomarker and useful indicator of treatment responses in CHB. The serum qHBsAg level was highest in HBeAg-positive hepatitis B and lowest in patients with resolved hepatitis. After HBeAg seroconversion, the clinical status of HBeAg CHB ranged from IC to HBeAg-negative immune-reactive CHB.[9] The IC state showed a low incidence of HCC and cirrhosis and a good prognosis, whereas HBeAg-negative immune-reactive CHB patients showed more moderate/severe hepatitis and frequently developed liver cirrhosis and HCC.[4,10]
Normal ALT levels were not a good predictor for IC because fluctuations resulted in misleading IC diagnoses. This was supported by our findings that the IC state correlated well with serum HBV DNA and serum qHBsAg levels, but not serum ALT levels. Serum qHBsAg and serum HBV DNA levels also showed a significant positive correlation with the IC state in previous reports.[11,12]
Brunetto et al[13] suggested a cutoff value for HBV DNA (<2000 IU/mL) and qHBsAg (<1000 IU/mL) that distinguished ICs from 209 patients with HBeAg-negative chronic hepatitis in a cohort of untreated, HBeAg-negative, asymptomatic, HBV genotype D carriers with high diagnostic accuracy (94%). This result was consistent with another study in Taiwanese patients, in which HBVs of genotypes B and C were prevalent, that used the same proposed cutoff point.[14] By contrast, a study in genotype C viruses specially used a different parameter and a cutoff level of qHBsAg < 50 IU/mL to identify ICs.[10] However, in a report by Park et al,[15] an overlap was reported in the serum qHBsAg levels between ICs and ACs, which indicates that this may not be the best parameter with which to determine a discriminatory cutoff level for genotype C viruses.
For comparison with other studies, we analyzed different cutoff values for serum qHBsAg levels. In our study, ICs could be predicted using cutoff values for serum qHBsAg of <1000 IU/mL and serum HBV DNA of <2000 IU/mL, which conferred 41% sensitivity and 72% specificity. If baseline levels for serum qHBsAg of <50 IU/mL and HBV DNA of <2000 IU/mL were used, only 17% sensitivity and 98% specificity was obtained.
Inconsistent with previous studies, our results revealed that the proposed cutoff values for serum qHBsAg of <1000 IU/mL or serum qHBsAg of <50 IU/mL accompanied by serum HBV DNA levels of <2000 IU/mL may not be good diagnostic indicators for predicting the IC state for genotype B or C viruses.
Recent reports suggested that the secretion of HBsAg is HBV genotype-dependent. When HBV DNA levels were consistent, serum qHBsAg levels differed between genotypes with high levels in genotypes A and C, intermediate levels in genotypes D and E and low levels in genotype B.[16,17] This discordance in serum HBV DNA and serum qHBsAg levels among genotypes may explain the different results and indicates the need for further studies to verify the validity of this potential marker in predicting IC status, especially in genotype B/C carriers.
HBsAg seroclearance is a clinical goal for HBV carriers. Previous studies showed that HCC and/or hepatic decompensation rarely occurred in patients if there was no evidence of liver cirrhosis or HCV/HDV superinfection and the subject's age was <50 years at the time of HBsAg seroclearance.[18] The predictive value of spontaneous HBsAg seroclearance was clarified in another previous report. The level of HBV DNA, old age, normal ALT levels, male sex, hepatic steatosis, genotype B, and HCV coinfection are also important factors that correlate with spontaneous HBsAg seroclearance.[19]
Despite qHBsAg levels correlating with HBV DNA levels,[12] Arai et al[20] reported that the qHBsAg titer at baseline was the only predictive factor for HBsAg seroclearance. This result corresponds with our findings.
A longitudinal study in Hong Kong[21] that analyzed 103 HBeAg-negative CHB patients predominantly of genotypes B and C, who were followed up for a median of 11 years, revealed that serum qHBsAg levels ≤100 IU/mL and HBV DNA levels ≤2000 IU/mL correlated with 75% sensitivity and 91% specificity in predicting HBsAg seroclearance. In another report by Tseng et al,[22] patients who had serum HBV DNA levels <200 IU/mL and serum qHBsAg levels <100 IU/mL predicted HBsAg loss within 6 years with 91.5% sensitivity and 83.3% specificity. Our results confirmed the observations of previous studies with regard to the impact of HBsAg levels on the development of HBsAg seroclearance.
Our findings revealed that when lower cutoff points for serum qHBsAg levels (<50 IU/mL) than those reported by previous studies were employed, more accurate predictions of the timescales of HBsAg seroclearance were derived. This would have implications for reducing medical expenses and reducing the frequency of monitoring.
Another important observation in our study was that the log reduction of serum qHBsAg was not different between ACs and ICs during follow up. However, patients achieving HBsAg seroclearance had significant decline in qHBsAg level than patients who did not display HBsAg seroclearance. These results confirmed previous study[23] that a serum HBsAg reduction of more than 1 log reflects effective immune control and increase probability of HBsAg seroclearance.
Our study had a few limitations. First, we did not perform genotyping, and the genotype may affect the level of HBsAg. Second, the follow-up period may be too short to determine the carrier status. However, in clinical practice, patients might display heterogeneity and not all show genotypic results.
In conclusion, in countries where genotype B/C viruses are common, the serum qHBsAg level, determined at a single timepoint for HBeAg-negative CHB patients with low serum HBV DNA levels at baseline, was not a favorable predictive marker for ICs. However, serum qHBsAg levels accurately predicted spontaneous HBsAg seroclearance at 24 months when using a serum qHBsAg cutoff level of <50 IU/mL.
Acknowledgments
We thank the following people who kindly contributed to many aspects of this project: Jiraporn Dechma, Charinthip Pothijaroen, Kaannika Polput, Vanwisa Pongpun, Nakorn Sangkaew, and Nutthaphon Phokhachang.
Footnotes
Abbreviations: AC = active carrier, ALT = alanine aminotransferase, AUROC = area under the receiver-operating curve, CHB = chronic hepatitis B infection, HBeAg = hepatitis B e antigen; HCC = hepatocellular carcinoma, IC = inactive carrier, qHBsAg = quantitative hepatitis B surface antigen.
Funding/support: The study was supported by research grant from Chulabhorn Hospital to TU.
The authors have no conflicts of interest to disclose.
References
- [1].Merican I, Guan R, Amarapuka D, et al. Chronic hepatitis B virus infection in Asian countries. J Gastroenterol Hepatol 2000;15:1356–61. [DOI] [PubMed] [Google Scholar]
- [2].Posuwan N, Wanlapakorn N, Sa-Nguanmoo P, et al. The success of a universal hepatitis B immunization program as part of Thailand's EPI after 22 years’ implementation. PLoS One 2016;11:e0150499. [DOI] [PMC free article] [PubMed] [Google Scholar]
- [3].Hadziyannis SJ, Vassilopoulos D. Hepatitis B e antigen-negative chronic hepatitis B. Hepatology 2001;34:617–24. [DOI] [PubMed] [Google Scholar]
- [4].Lok AS, McMahon BJ. Chronic hepatitis B: update 2009. Hepatology 2009;50:661–2. [DOI] [PubMed] [Google Scholar]
- [5].Chan HL, Thompson A, Martinot-Peignoux M, et al. Hepatitis B surface antigen quantification: why and how to use it in 2011—a core group report. J Hepatol 2011;55:1121–31. [DOI] [PubMed] [Google Scholar]
- [6].Terrault NA, Bzowej NH, Chang KM, et al. AASLD guidelines for treatment of chronic hepatitis B. Hepatology 2016;63:261–83. [DOI] [PMC free article] [PubMed] [Google Scholar]
- [7].Louisirirotchanakul S, Olinger CM, Arunkaewchaemsri P, et al. The distribution of hepatitis B virus genotypes in Thailand. J Med Virol 2012;84:1541–7. [DOI] [PubMed] [Google Scholar]
- [8].Tseng TC, Kao JH. Clinical utility of quantitative HBsAg in natural history and nucleos(t)ide analogue treatment of chronic hepatitis B: new trick of old dog. J Gastroenterol 2013;48:13–21. [DOI] [PMC free article] [PubMed] [Google Scholar]
- [9].Martinot-Peignoux M, Lapalus M, Asselah T, et al. HBsAg quantification: useful for monitoring natural history and treatment outcome. Liver Int 2014;34Suppl 1:97–107. [DOI] [PubMed] [Google Scholar]
- [10].Yim SY, Um SH, Jung JY, et al. Role of hepatitis B surface antigen (HBsAg) in identifying true inactive HBsAg carriers infected with genotype C hepatitis B virus. J Clin Gastroenterol 2014;48:166–71. [DOI] [PubMed] [Google Scholar]
- [11].Kim YJ, Cho HC, Choi MS, et al. The change of the quantitative HBsAg level during the natural course of chronic hepatitis B. Liver Int 2011;31:817–23. [DOI] [PubMed] [Google Scholar]
- [12].Chen CH, Lee CM, Wang JH, et al. Correlation of quantitative assay of hepatitis B surface antigen and HBV DNA levels in asymptomatic hepatitis B virus carriers. Eur J Gastroenterol Hepatol 2004;16:1213–8. [DOI] [PubMed] [Google Scholar]
- [13].Brunetto MR, Oliveri F, Colombatto P, et al. Hepatitis B surface antigen serum levels help to distinguish active from inactive hepatitis B virus genotype D carriers. Gastroenterology 2010;139:483–90. [DOI] [PubMed] [Google Scholar]
- [14].Tseng TC, Liu CJ, Yang HC, et al. Serum hepatitis B surface antigen levels help predict disease progression in patients with low hepatitis B virus loads. Hepatology 2013;57:441–50. [DOI] [PubMed] [Google Scholar]
- [15].Park H, Lee JM, Seo JH, et al. Predictive value of HBsAg quantification for determining the clinical course of genotype C HBeAg-negative carriers. Liver Int 2012;32:796–802. [DOI] [PubMed] [Google Scholar]
- [16].Brunetto MR, Moriconi F, Bonino F, et al. Hepatitis B virus surface antigen levels: a guide to sustained response to peginterferon alfa-2a in HBeAg-negative chronic hepatitis B. Hepatology 2009;49:1141–50. [DOI] [PubMed] [Google Scholar]
- [17].Moucari R, Martinot-Peignoux M, Mackiewicz V, et al. Influence of genotype on hepatitis B surface antigen kinetics in hepatitis B e antigen-negative patients treated with pegylated interferon-alpha2a. Antivir Ther 2009;14:1183–8. [DOI] [PubMed] [Google Scholar]
- [18].Chen YC, Sheen IS, Chu CM, et al. Prognosis following spontaneous HBsAg seroclearance in chronic hepatitis B patients with or without concurrent infection. Gastroenterology 2002;123:1084–9. [DOI] [PubMed] [Google Scholar]
- [19].Chu CM, Liaw YF. Hepatitis B surface antigen seroclearance during chronic HBV infection. Antivir Ther 2010;15:133–43. [DOI] [PubMed] [Google Scholar]
- [20].Arai M, Togo S, Kanda T, et al. Quantification of hepatitis B surface antigen can help predict spontaneous hepatitis B surface antigen seroclearance. Eur J Gastroenterol Hepatol 2012;24:414–8. [DOI] [PubMed] [Google Scholar]
- [21].Chan HL, Wong GL, Tse CH, et al. Viral determinants of hepatitis B surface antigen seroclearance in hepatitis B e antigen-negative chronic hepatitis B patients. J Infect Dis 2011;204:408–14. [DOI] [PubMed] [Google Scholar]
- [22].Tseng TC, Liu CJ, Su TH, et al. Serum hepatitis B surface antigen levels predict surface antigen loss in hepatitis B e antigen seroconverters. Gastroenterology 2011;141:517–25. 525.e511–512. [DOI] [PubMed] [Google Scholar]
- [23].Seto WK, Wong DK, Fung J, et al. A large case–control study on the predictability of hepatitis B surface antigen levels three years before hepatitis B surface antigen seroclearance. Hepatology 2012;56:812–9. [DOI] [PubMed] [Google Scholar]


