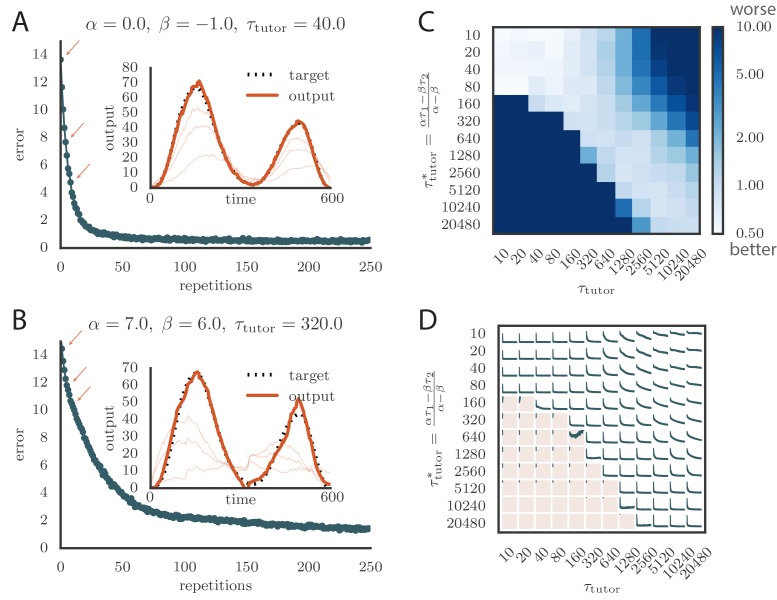
Figure 3. Learning with matched or mismatched tutors in rate-based simulations.
(A) Error trace showing how the average motor error evolved with the number of repetitions of the motor program for a rate-based () plasticity rule paired with a matching tutor. (See online Video 1). (B) The error trace and final motor output shown for a timing-based learning rule matched by a tutor with a long integration timescale. (See online Video 2.) In both A and B the inset shows the final motor output for one of the two output channels (thick orange line) compared to the target output for that channel (dotted black line). The output on the first rendition and at two other stages of learning indicated by orange arrows on the error trace are also shown as thin orange lines. (C) Effects of mismatch between student and tutor on reproduction accuracy. The heatmap shows the final reproduction error of the motor output after 1000 learning cycles in a rate-based simulation where a student with parameters , , , and was paired with a tutor with memory timescale . On the axis, and were kept fixed at and , respectively, while and were varied (subject to the constraint ; see text). Different choices of and lead to different optimal timescales according to Equation (4). The diagonal elements correspond to matched tutor and student, . Note that the color scale is logarithmic. (D) Error evolution curves as a function of the mismatch between student and tutor. Each plot shows how the error in the motor program changed during 1000 learning cycles for the same conditions as those shown in the heatmap. The region shaded in light pink shows simulations where the mismatch between student and tutor led to a deteriorating instead of improving performance during learning.

