

Abstract
The development of the central nervous system (CNS) is a complex process that must be exquisitely controlled at multiple levels to ensure the production of appropriate types and quantity of neurons. RNA alternative polyadenylation (APA) contributes to transcriptome diversity and gene regulation, and has recently been shown to be widespread in the CNS. However, the previous studies have been primarily focused on the tissue specificity of APA and developmental APA change of whole model organisms; a systematic survey of APA usage is lacking during CNS development. Here, we conducted global analysis of APA during mouse retinal development, and identified stage-specific polyadenylation (pA) sites that are enriched for genes critical for retinal development and visual perception. Moreover, we demonstrated 3′UTR (untranslated region) lengthening and increased usage of intronic pA sites over development that would result in gaining many different RBP (RNA-binding protein) and miRNA target sites. Furthermore, we showed that a considerable number of polyadenylated lncRNAs are co-expressed with protein-coding genes involved in retinal development and functions. Together, our data indicate that APA is highly and dynamically regulated during retinal development and maturation, suggesting that APA may serve as a crucial mechanism of gene regulation underlying the delicate process of CNS development.
Electronic supplementary material
The online version of this article (doi:10.1007/s00018-016-2429-1) contains supplementary material, which is available to authorized users.
Keywords: Central nervous system, PA-seq, RNA stability, Post-transcriptional gene regulation, Transcriptome, Cleavage and polyadenylation-associated factor
Introduction
The neurons of the central nervous system (CNS) and peripheral nervous system (PNS) exhibit a vast complexity in terms of the different cell types, which result in a high level of transcriptome diversity [1]. Alternative 3′ end cleavage and polymerization of an adenosine tail (alternative polyadenylation, APA) of mRNAs [2–6] are recognized as a widespread mechanism to increase the functional diversity of the transcriptome and proteome, introducing additional layers for regulated gene expression and playing important roles in development and diseases [2, 3, 7–12]. Unraveling the hidden layer of APA regulation is necessary to obtain a comprehensive understanding of the transcriptome diversity, which would greatly expand the scope of post-transcriptional regulatory networks of the nervous system.
In mammals, up to 80% of mRNA genes and 70% of long non-coding RNA (lncRNA) genes are found to have multiple polyadenylation (pA) sites [13–15]. APA generates transcript variants that may have different coding regions or 3′ untranslated regions (UTRs), leading to the production of distinct protein or 3′UTR isoforms. 3′UTRs often harbor various regulatory sequences, including the target sites of transacting factors, such as RNA-binding proteins (RBPs) [10, 16, 17] and microRNAs (miRNAs) [18, 19]. The gain/loss of the cis-acting elements in the 3′UTR isoforms caused by APA can affect not only the stability but also the localization, transport, and translational properties of the mRNA [2, 3, 11, 20–23], thereby contributing to functional diversity and gene regulation.
Global shortening of 3′UTRs by APA has been found to be associated with enhanced neuronal activity, T-cell activation, elevated cell proliferation rate, stem cell state, and oncogene activation in cancer cells [19, 20, 24–26]. In addition, altered RNA polyadenylation has been associated with numerous neurological, immunological, oncological, hematological, and endocrine disorders [3, 11, 12, 20]. For instance, myotonic dystrophy is characterized by disruption of developmentally regulated APA events as a result of diminished MBNL activity due to sequestration by microsatellite expansion RNAs [27, 28]. Copy-number variations spanning NUDT21, which encodes a subunit of pre-mRNA cleavage factor Im (CFIm25), cause neuropsychiatric disease by increasing usage of the distal pA site in the MECP2 3′UTR [29]. Similarly, a mutation within the polyadenylation signal (PAS) of the FOXP3 gene results in an unstable mRNA due to lengthened 3′UTR, leading to IPEX, a disease characterized by dysfunction of regulatory T cells and subsequent autoimmunity [30, 31].
The 3′UTR diversity was recently recognized to be particularly widespread in the CNS of Drosophila and mammals [32, 33]. The previous studies have been primarily focused on the tissue specificity of APA and developmental APA change of the whole organism [32, 34–38]; there is, however, lack of systematic surveys of complex usage of APA during CNS development. As a part of CNS, the retina has a complex layered structure with several layers of neurons interconnected by synapses [39, 40]. The development of retina is a process tightly regulated at multiple levels to ensure the generation of appropriate cell types and quantity of neurons necessary for assembling the functional retinal circuitry [41–43], which imposes a challenge for the understanding of the APA regulation that shapes this complexity.
In this study, we conducted global analysis of alternative polyadenylation usage at various stages of mouse retinal development, and identified stage-specific pA sites that are enriched for genes critical for retinal development and visual perception. Moreover, we demonstrated 3′UTR lengthening and increased usage of intronic pA sites over the course of retinal development that would result in gaining many different RBP (RNA-binding protein) and/or miRNA target sites. Furthermore, we showed that a considerable number of polyadenylated long non-coding RNAs (lncRNAs) are co-expressed with protein-coding genes involved in retinal cell development, phototransduction, synaptogenesis, and so on. These data reveal a dynamically changed APA landscape during retinal development, which implicates APA as an important mechanism of gene regulation underlying CNS development.
Materials and methods
PA-seq
We used the PA-seq procedure as previously described [44, 45]. Retinas were collected from C57BL/6J mice at stages E13.5, E15.5, E18.5, P0, P6, and P21. These time points were chosen to cover the major developmental stages, with retinas at E13.5 containing mostly dividing progenitors and retinas at P21 containing differentiated retinal cell types. Total RNA was extracted from collected retinas using the TRIzol reagent (Invitrogen) according to the manufacturer’s instruction. Two separate PA-seq libraries were then constructed from each RNA sample for sequencing as described [44]. The raw reads and processed files have been deposited in the NCBI Gene Expression Omnibus under accession number GSE80206.
Identification of polyadenylation sites
The PA-seq sequencing reads of 42 bp in length were mapped to the Mus musculus genome (mm10, downloaded from UCSC). BWA (version 0.7.5a-r405) was used for mapping reads to the genome where a maximum of two mismatches and no gaps were allowed [46]. The duplicated reads were discarded and the alignments with mapping quality ≥20 were kept. A total number of 2.7–4.3 million paired-end reads were used for further analysis after the removal of low-quality, unmapped, and multiple mapped reads (Supplementary Table S1).
The PA-seq reads from all the samples were first combined to obtain a global profile of the polyadenylation events. The F-seq [47] was applied to find pA peaks with a feature length of 30 bp and a fragment length of 1 bp. The peak sites were filtered with a minimum enrichment score of 3 and a minimum number of tags of 40. To remove the effects of internal priming [44, 45], the number of As in the downstream 20-nucleotide (nt) region of the identified sites was counted and the sites with fewer than 12 As were kept.
Distribution of polyadenylation sites
The annotation of genes was obtained from Ensembl (version GRCm38.p4), including 21,965 protein-coding genes, 9059 long non-coding genes, 9939 pseudogene, and 6017 small non-coding genes. The annotation of pA sites was obtained from Gencode (version M8), including seven genomic regions: 3′UTR, 3 kb downstream of the annotated 3′UTR (extended 3′UTR), exon (Exon), intron (Intron) of protein-coding genes, exon (lncRNA_Exon) and intron (lncRNA_Intron) of lncRNA genes, and 3 kb downstream of the annotated lncRNA (Extended lncRNA), with priority (3′UTR > Extended_3′UTR > Exon > Intron > lncRNA_Exon > lncRNA_Intron > Extended lncRNA). Since the actual cleavage position typically fluctuates by about 10 nt around the major cleavage position [20], we define the identified pA sites located within 10 nt of the annotated pA sites as annotated sites (annotated pAs). The pA sites located outside 10 nt of the annotated pA sites were defined as novel pA sites (novel pAs). The number of pA sites and normalized read number (reads per million, RPM) were estimated for each of these categories.
Time-specific gene expression and polyadenylation sites
The 3′UTR isoform abundance at different developmental stages was quantified using the PA-seq tags of the corresponding pA sites, and the average RPM of the two technical replicates were computed for subsequent analysis. The time specificity of the identified pA genes/sites was measured using the Shannon entropy [48]. The entropy scores H and Q were calculated based on the PA-seq tags, also called PA-seq reads, indicating the degree of the overall specificity of a gene/pA site and the specificity to a particular developmental stage, respectively.
The PA-seq tags assigned to the 3′UTR and extended 3′UTR regions of each protein-coding gene were combined as the approximation of the expression level of the corresponding gene. To evaluate the estimation of gene expression by PA-seq, RNA-seq data of the mouse retina from the same or similar developmental stages were downloaded from GEO data set (accession GSE52006) [49], and mapped to the Mus musculus genome (mm10, downloaded from UCSC) using Tophat [50]. The expression level for all the protein-coding genes was quantified using HTSeq-count [51], and the Pearson correlation of read counts between PA-seq and RNA-seq was evaluated.
The relative expression of a gene g at a particular developmental stage t is defined as p t|g = w g,t/∑1 ≤ t ≤ N w g,t, where w g,t is the expression level of the gene estimated by the sum of the PA-seq tags of all the pA sites for the given gene normalized by the library size. The entropy of a gene’s expression distribution is H g = ∑1 ≤ t ≤ N − p t|glog2(p t|g), and the categorical time specificity is Q g|t = H g − log2(p t|g). For time-specific pA sites, the normalized expression of each pA site of a gene at a developmental stage is computed as w g,t,p = (n g,t,p + 1)/(n g,t + N g), where n g,t,p is the PA-seq tags of a pA site p for gene g at stage t, n g,t is the total number of PA-seq tags for the gene g at stage t, and N g is the number of pA sites for gene g. The probability of observing a pA site p at a particular developmental stage t is then defined as p t|p = w g,t,p/∑1 ≤ t ≤ N w g,t,p.
The smaller entropy scores imply higher specificity. The genes/pA sites with the entropy scores H and Q less than the median minus 1.5 standard deviations were defined as categorical time-specific genes/pA sites, accounting for about −10.5%/5.2% of the expressed genes/identified pA sites; and the pA sites with the entropy score H more than the median plus 0.5 standard deviation were defined as common pA sites, accounting for about 18.2% of the identified pA sites. To test the significance of the identified time-specific genes/pA sites, permutation tests were conducted. The null hypothesis assumes that the genes/pA sites are not regulated in a time-specific manner. First, the relative expression of each gene/pA site was scaled across stages, and mean expression of time-specific genes/pA sites within each stage was calculated. Second, empirical distribution of mean expression from each permutation (5000 permutations) was generated for the genes/pA sites specifically expressed/used at each stage, respectively. For each gene/pA site, the developmental stages were permuted for 5000 times. For each stage, we generated a background of gene/pA sites by re-sampling the same number of time-specific genes/pA sites also for 5000 times. The shuffle of the stage labels and re-sampling were performed in separate rounds. Finally, the statistical significance was assessed by comparing the observed mean expression with the empirical distribution. The same statistical test was implemented for the genes/pA sites specifically expressed/used at each stage, respectively. Gene set enrichment analysis (GSEA) was conducted for both the time-specific genes and genes associated with the time-specific pA sites using the Bioconductor Package Piano [52].
3′UTR length estimation
The annotated transcripts of a given gene were merged if they shared the same stop codon. The RUD (relative expression of 3′UTR isoforms using distal pA sites) score for each gene is defined as the usage of distal pA sites minus the summed usage of the other pA sites located in 3′UTR and extended_3′UTR regions [38], which reflects the relative expression of 3′UTR isoforms using distal pA sites at a specific developmental stage. The 3′UTR length of each gene for all the developmental stages was subsequently defined as the average length of all the 3′UTRs weighted by the number of PA-seq tags [44]. The calculated weighted 3′UTR length was abbreviated as 3′UTR length in this paper. Genes that varied by 100 nt in the 3′UTR length between stages were defined as shortened/lengthened genes.
Motif analysis
The sequence composition around the identified pA sites was compared between the annotated and novel identified pA sites. The information content with default color scheme was generated using Weblogo version 2.8 (http://weblogo.threeplusone.com). The sequence surrounding the pA site usually contains a polyadenylation signal (PAS), such as AAUAAA and other hexamer variants. The frequency of the canonical PAS AAUAAA and the most common 12 variants reported (AUUAAA, UAUAAA, AGUAAA, UUUAAA, CAUAAA, AAUAUA, AAUACA, GAUAAA, AAGAAA, AAAAAG, AAAACA, and AAUAGA) [53] were calculated in the upstream 10–30 nt region of the identified pA sites. The sequence motif of other cis-elements in the upstream 10–30 nt of the pA sites was discovered using the MEME suite (version 4.10.2) [54].
The target sites of a total of 93 reported RNA-binding proteins (RBPs) and 1915 miRNA sequences in the seed region were searched within the lengthened 3′UTR regions resulting from alternative usage of the distal polyadenylation signal. The motifs of these RNA-binding proteins were downloaded from the CisBP-RNA database [16, 55], and the seed sequences of the miRNA were downloaded from the miRBase sequence database [56]. The Analysis of Motif Enrichment (AME, Version 4.10.2) [57] method of the MEME suite was utilized to identify the target sites of RBPs and miRNAs that were enriched in the lengthened 3′UTR regions.
qRT-PCR analysis
Quantitative RT-PCR analysis was performed as described previously [58, 59]. Total RNA was isolated using the TRIzol reagent from retinas of E15.5, P0, and P6 C57BL/6J mice. Gene-specific primers in proximal and distal regions of 3′UTRs used for qRT-PCR validation are listed in Supplementary Table S2.
Co-expression of polyadenylated lncRNAs and protein-coding genes
The Pearson correlation co-efficiencies (R) between polyadenylated lncRNAs and protein-coding mRNAs were calculated based on their estimated expression level across the developmental stages. For each lncRNA, GSEA was consequently conducted for the protein-coding genes with a high level of co-expression (R > 0.9) using the Bioconductor Package Piano [52]. The predicted cellular roles of highly expressed lncRNAs (log10-transformed summed RPM across stages larger than 2) were visualized using the Cytoscape program [60].
Results
Global analysis of pA sites during retinal development
To investigate global changes during retinal development and maturation, we profiled genome-wide polyadenylation sites of the mouse retina using a modified polyadenylation sequencing (PA-seq) strategy [44, 45], across six developmental stages, including the embryonic and postnatal stages (E13.5, E15.5, E18.5, P0, P6, and P21). We also performed two technical replicates for each developmental stage and the Pearson correlation coefficients of replicates ranged from 0.94 to 0.96. The PA-seq reads at all the stages were first combined to identify reliable polyadenylation sites during retinal development. A total number of 32,688 distinct pA sites were identified by the peak-finding algorithm F-seq [47] after removal of the sites with more than 12 As in the 20-nucleotide region downstream to avoid the effect of internal priming. Of these distinct pA sites, 59% of them were novel/unannotated sites and only 41% were present in the latest PolyA_DB database [61] (Supplementary Fig. S1). A similar ratio was found when the Gencode reference database was used (Fig. 1b).
Fig. 1.

Distribution and motif sequences of the identified pA sites. a Comparison of the number of the identified pA sites located in protein-coding, long non-coding (lncRNA), other genes (pseudogenes and small non-coding genes), and intergenic regions. b Distribution of the identified pA sites across genomic regions divided into seven categories including the annotated 3′UTRs, extended 3′UTRs (Extended_3′UTR), exon (Exon) and intron (Intron) of protein-coding genes, and exon (lncRNA_Exon) and intron (lncRNA_Intron) of lncRNA genes. Number of the annotated pA sites (red) from Gencode and the novel identified pA sites (cyan) for each category was labeled. c Normalized read number (RPM) of pA sites (in logarithm scale) in the genomic regions corresponding to those defined in a (***p < 0.001). d Box plots of the average usage of the pA sites in different genomic regions for each gene. e Distribution of the number of pA sites for protein-coding (blue) and lncRNA (green) genes. f Information content of both the known (upper panel) and novel identified pA sites (lower panel) around 50 nt of the pA site. g Frequency of the polyadenylation signals (PAS), including the canonical AAUAAA and 12 most common variants, reported in human in the upstream 10–30 nt of the pA sites
The distribution of the identified pA sites on the genomic regions was evaluated. We found that the cleavage and polyadenylation of protein-coding genes accounted for a major fraction (~71.3%) of the identified polyadenylation events. Around 25.5% of pA sites are located in intergenic regions, which might represent novel distal pA sites of known genes in downstream 3′UTR regions (Fig. 1a, b). The identified pA sites were compared with the annotated pA sites (Gencode, mouse version M8) and their distribution across genomic features, including 3′UTR, Extended_3′UTR, Exon, Intron, lncRNA_Exon, lncRNA_Intron, and Extended_lncRNA, was further examined. About 36.3% of the pA sites matched the Genecode-annotated pA sites (annotated pAs), and both the annotated pAs and novel pAs favor 3′UTR and extended 3′UTR regions of protein-coding genes (Fig. 1b), indicating the usage of novel 3′UTR isoforms during mouse retinal development. In comparison, there are a smaller number of pA sites (~6.5%) distributed in the intron and exon of protein-coding genes. In addition, around 4% of pA sites were found to be located in lncRNA and extended lncRNA (3 kb downstream of the annotated lncRNA) regions (Fig. 1b). Besides, the number of reads of the annotated pA sites accounts for more than 60% of total mapped reads, suggesting that the annotated pA sites are preferentially used compared to the novel pA sites.
Of all the mapped sequence reads, a large fraction is located in pA sites of protein-coding genes, which is significantly higher than that located in pA sites of lncRNA or intergenic regions (Fig. 1c). We further defined the average usage of the pA sites in a genomic region as the normalized read number of the pA sites that are located in that genomic region for each gene (Fig. 1d). The abundance of isoforms caused by cleavage and polyadenylation in 3′UTRs and extended 3′UTRs was significantly higher than that of the other genomic regions (Fig. 1d, two-tailed t test, p < 0.01). Since pA sites associated with other genomic regions contribute to only a minor part of the overall polyadenylation events, we will mainly focus on the identified pA sites located in 3′UTRs and the extended 3′UTRs of the protein-coding genes, exons of lncRNA, and extended lncRNA regions. After merging all 3′UTRs with the same stop codons, we found that around 49% (6,301/12,872) and 21% (195/722) of transcribed protein-coding genes and lncRNA in the mouse retinal tissue harbor more than one pA sites, respectively (Fig. 1e), suggesting a potential mechanism of regulation of gene activity by APA during retinal development.
It has been well documented that the cleavage and polyadenylation events involve the upstream AU-rich pA signal and the downstream U/GU-rich element [53, 62]. In our data, these two elements were also detected within the first 30 nucleotides flanking the cleavage sites of both the annotated and novel identified pA sites (Fig. 1f). We searched for the hexamer motif sequences of the PAS, and found that 85% of the PAS were the canonical recognition signal AAUAAA or the most common 12 variants reported in the human [53] in a region 10–30 bases upstream of the pA sites (Fig. 1g). The sequence composition and elements surrounding the PAS agreed well with those reported in human tissues [44].
Time-specific gene expression and pA site usage
To assess the overall relationship of gene expression levels of the polyadenylation sites across all the stages, we applied principal component analysis (PCA) to the normalized read number (RPM) of both replicates of samples from all the different developmental stages, where the first three principal components contributed to about 98% of the explained variance (Fig. 2a). Interestingly, we observed that most of the stages, including embryonic stages (E13.5, E15.5, and E18.5) and postal day 0, are clustered, while P6 and P21 are in a relative far distance from the main cluster (Fig. 2a; Supplementary Fig. S2).
Fig. 2.

Identification and characterization of the time-specific pA sites during retinal development. a First three principal components of PCA analysis applied to the normalized read number (RPM) of both replicates of samples from all the developmental stages tested. b Heat map of log-transformed RPM for all time-specific pA sites, row-wise normalization was applied. Each row of the heat map represents a pA site using RPM Z score values normalized for each pA site individually, across all developmental stages. Red indicates high expression and blue indicates low expression. The color vector with group information of time-specific pA sites for each stage was added to the left side of the heat map corresponding to the color labels in a. c Number of time-specific pA sites (dark blue and green) and genes (light blue and green) at each developmental stage. Blue and green indicate protein-coding and lncRNA genes, respectively. d Distribution of time-specific pA sites in different genomic regions at each developmental stage
The previous studies have shown that expression levels of the protein-coding genes are highly correlated with gene expression levels estimated by tag counts of pA sites [35, 44, 63]. To estimate the expression of the protein-coding genes, the tag/read counts of the identified pA sites located in 3′UTR and extended 3′UTR regions were summed up. To validate the estimated gene expression, we downloaded two RNA-seq data sets of the mouse retina [49] (GEO accession: GSE52006) and compared the gene expression levels from RNA-seq with our estimated gene expression. The estimated gene expression levels at P0 and P21 were highly correlated with those from RNA-seq data at P2 and P21, respectively (Pearson correlation coefficients ranging between 0.74 and 0.69) (Supplementary Fig. S3), indicating that the PA-seq tag counts can be used to estimate the transcript abundance.
We further used Shannon entropy to measure categorical time specificity of gene expression (Supplementary Fig. S4A) and the pA site usage (Fig. 2b). Categorical time specificity ranks a gene/pA site according to the degree to which its expression pattern is skewed toward expression at that particular stage [48]. A permutation test was performed based on the mean expression values of the pA sites, revealing that the time-specific genes and pA sites identified based on Shannon entropy showed significant specificity at the corresponding stages (p < 0.0001). Consistent with the principal component analysis, a large proportion of the time-specific genes were identified at P6 and P21 (Fig. 2c). Gene set enrichment analysis (GSEA) showed that P6- or P21-specific genes were significantly enriched in the pathways associated with retinal development and functions, such as neurophysiological process of visual perception, detection of stimulus involved in sensory perception, phototransduction, transmission of nerve impulse, and photoreceptor cell maintenance (Supplementary Fig. 4B).
A considerable number of time-specific pA sites were identified across all the developmental stages (Fig. 2c). Most of the stage-specific pA sites were located in the 3′UTRs and extended 3′UTRs of protein-coding genes, rather than those of lncRNAs (Fig. 2d). The proportion of time-specific pA sites located in the extended 3′UTRs at postnatal stages is higher than those at embryonic stages (Fig. 2d), suggesting a preferential usage of distal pA sites at postnatal stages. GSEA analysis showed that the genes associated with embryonic stage-specific pA sites are enriched for cytoskeleton remodeling, cell cycle and G-protein signaling. Those associated with P0-specific pA sites are primarily involved in negative regulation of developmental process and apoptosis, while those associated with P6- and P21-specific pA sites are enriched in the visual pathway, including detection of stimulus involved in sensory perception, phototransduction, and neurophysiological process of visual perception (Fig. 3). The GSEA result thus suggests that the time-specific usage of pA sites is associated with both the retinal developmental process and the acquisition of visual perception.
Fig. 3.

Gene set enrichment analysis (GSEA) of the genes associated with time-specific pA sites. The significance of enrichment is represented by the negative log10-transformed FDR-corrected p values
Regulation of alternative polyadenylation during retinal development
To explore the change of the 3′UTR length for the protein-coding genes with APA, the RUD score was calculated. We observed a progressive increase in the median RUD over the course of retinal development, and the slope of the overall RUD across stages using a simple linear regression model (adjusted R 2 0.0010) is 0.012885 with a significant difference from 0 (p < 0.001), indicating a relatively higher abundance of the isoforms with a longer 3′UTR length resulted from the usage of distal pA sites at later developmental stages (Fig. 4a). The length of 3′UTR isoforms [44] was further quantified, and the median length was found to increase about 74 bp from 1238 at E13.5 to 1312 at P21. Compared to E13.5, the number of lengthened genes defined by a change of 100 nucleotides in 3′UTR length showed a gradual increase at each later stage, whereas the number of shortened genes displayed a slight downward trend over time (Fig. 4b; Supplementary Fig. S5A). We experimentally validated APA events for four randomly selected genes using the qRT-PCR assay and the results were consistent with APA events identified by PA-seq (Fig. 4c–f; Supplementary Fig. S5B–E). Figure 4 shows two representative genes Bcat1 (Fig. 4c, d) and Aak1 (Fig. 4e, f) as examples of the lengthened and shortened genes.
Fig. 4.

Dynamic changes of 3′UTR length. a Box plots of the RUD of the genes with APA during retinal development. Two-tailed pairwise t test was performed and revealed significant differences between all neighboring stages (***p < 0.001). b Number of the lengthened (blue)/shortened (red) genes that vary by 100 nt between E13.5 and later stages. c–f qRT-PCR validation of representative lengthened (Bcat, c, d) and shortened (Aak1, e, f) genes caused by differential usage of alternative pA sites. The height of each wiggle plot represents the number of PA-seq tags for the identified pA site (P proximal, D distal) at each developmental stage (c, e). The location of primer pairs used for PCR validation is indicated (c, e). The histograms represent the amount ratio of proximal/distal regions of the RNA transcript determined by qRT-PCR assays of retinal samples at the indicated developmental stages (d, f)
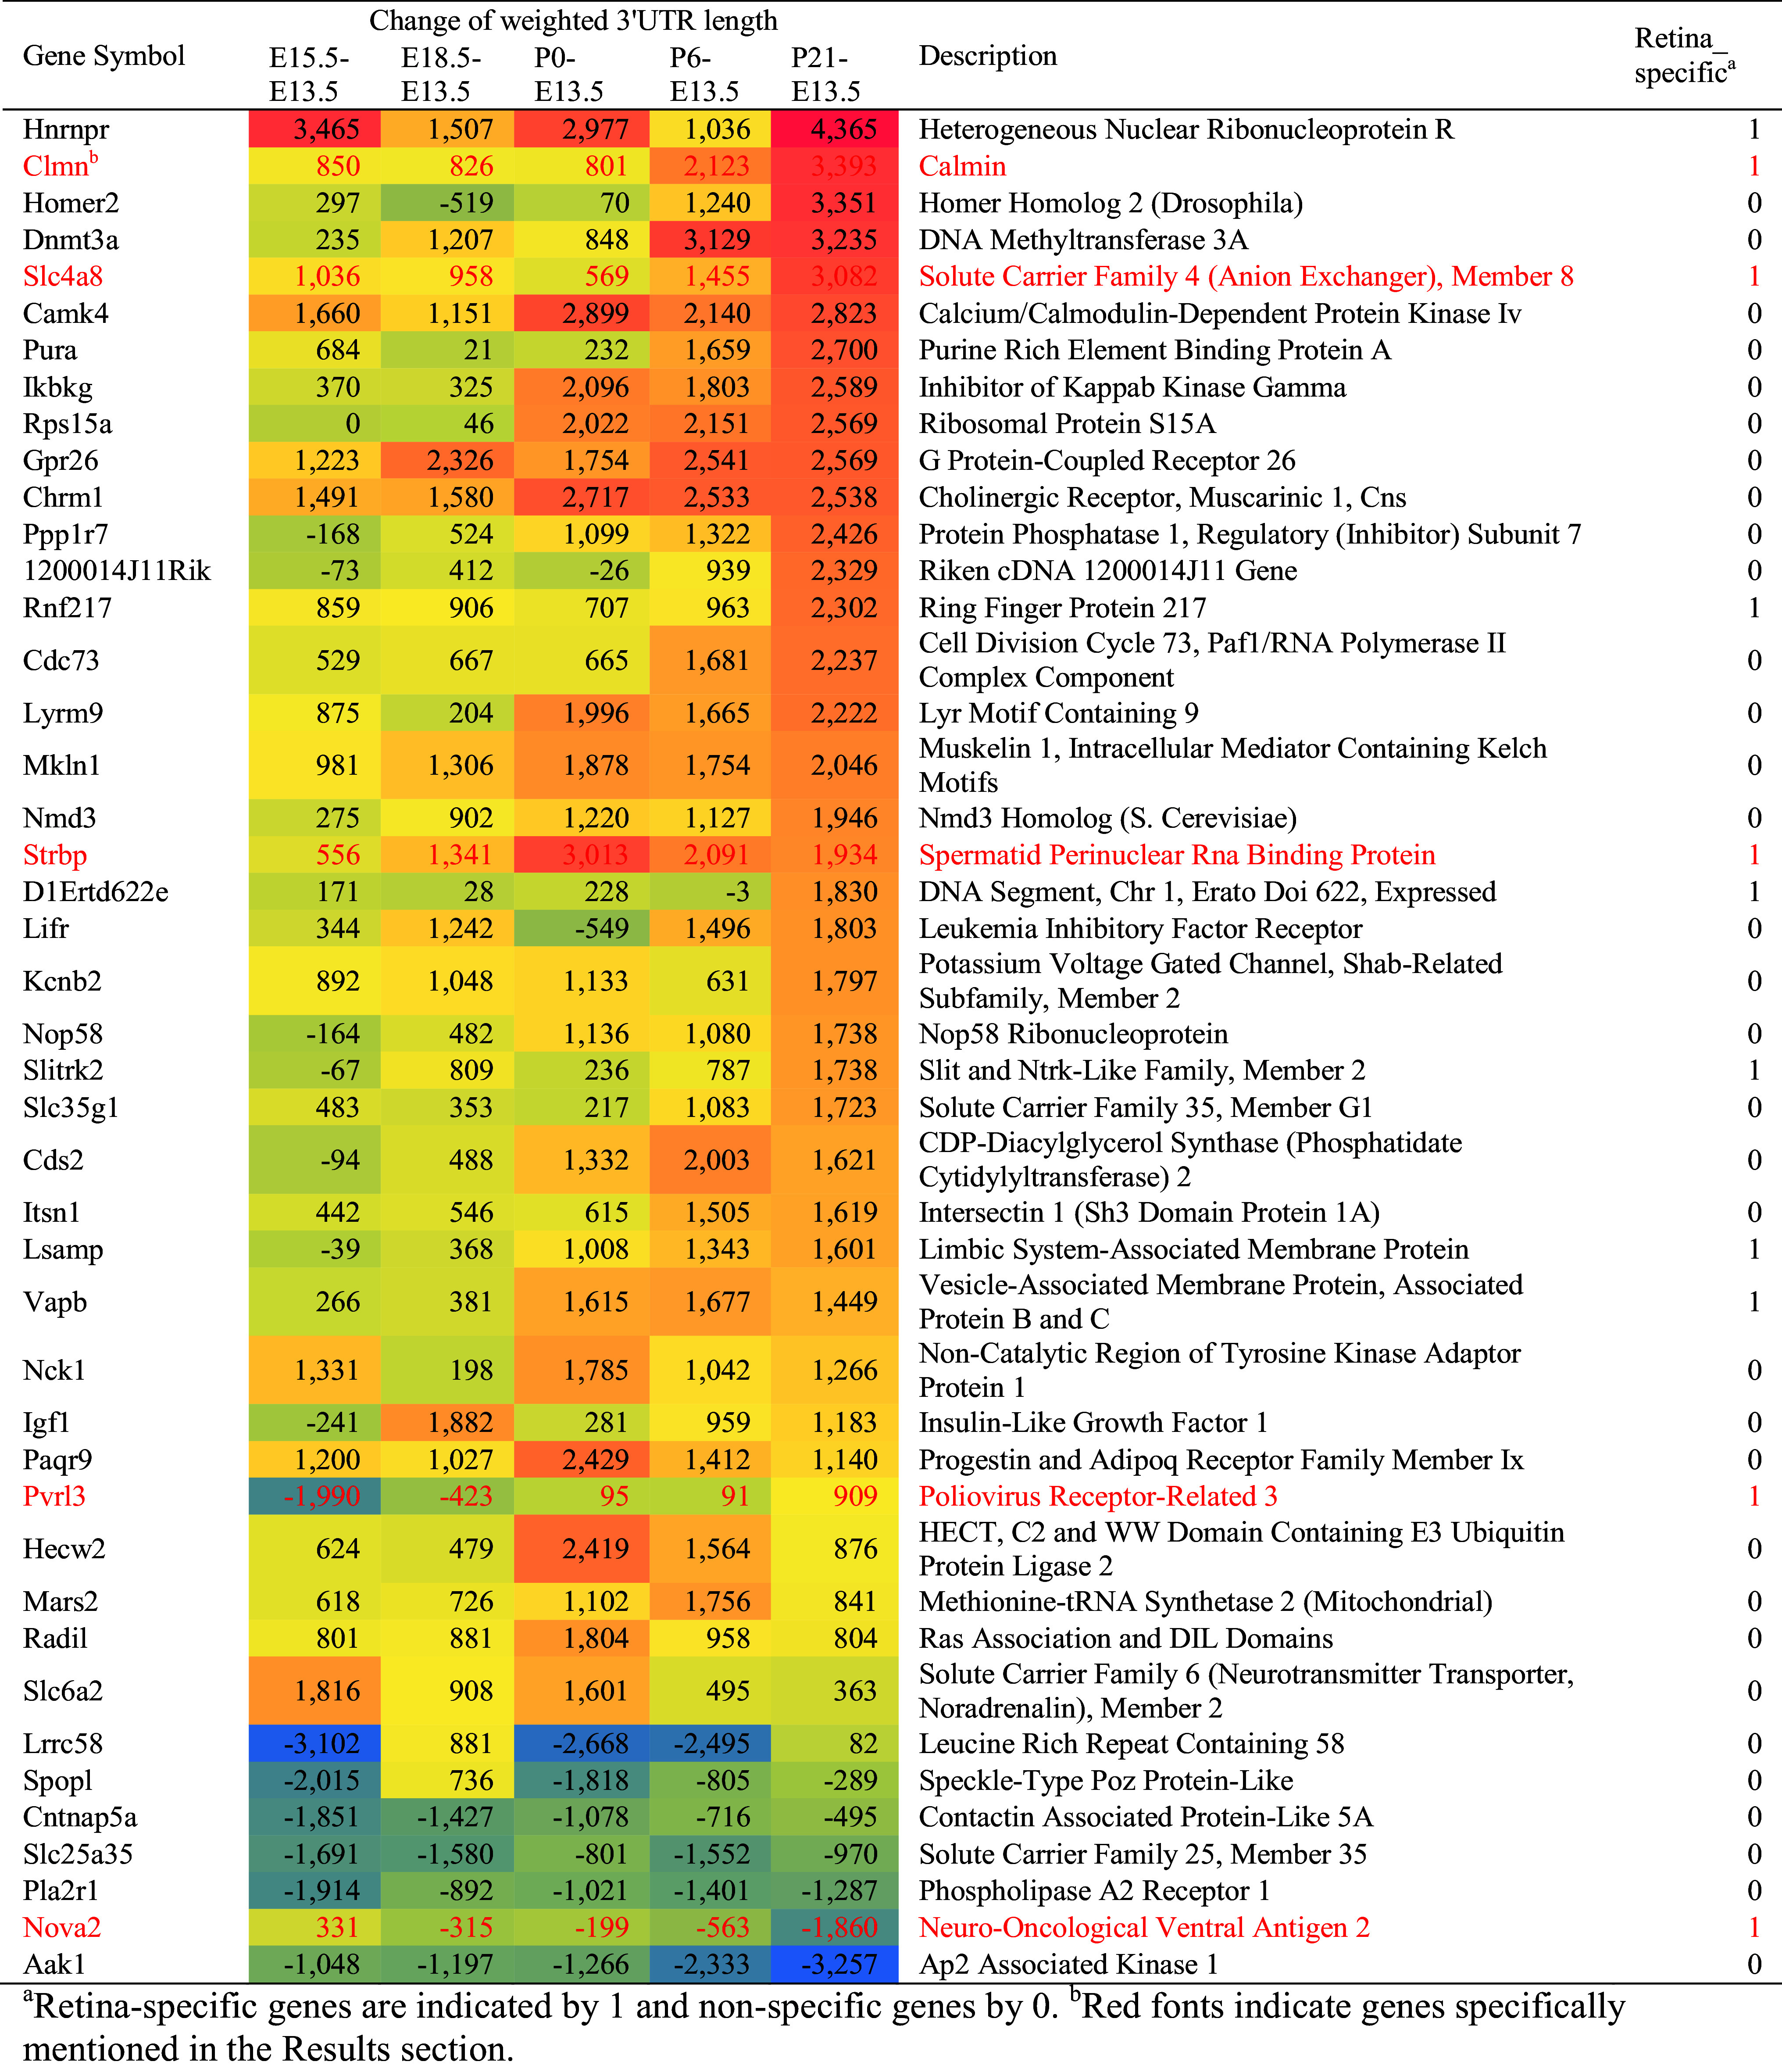
Overall, 44 genes showed notable changes of 3′UTR length, defined by lengthened/shortened by at least 1.6 kb at the later stages compared to E13.5 (Table 1). Among these genes, 11 were previously identified as “retina-specific” [64], indicating important roles of 3′UTR length in the regulation of retinal development and function. In particular, Clmn and Strbp were implicated in neural development [65, 66]; Nova2 regulated neuron-specific splicing [67, 68]; Slc4a8 was required for modulating pH-dependent glutamate release [69]; and Pvrl3 played an important role in lens and ciliary body formation [70].
Table 1.
Genes with a high degree of change in 3′UTR length (>1.6 kb) during retinal development
Aside from the APA events in 3′UTRs, we further investigated the pA sites located in other genomic regions [14, 71] (Fig. 5a). Using E13.5 as a baseline, we quantified the number of upregulated and downregulated pA sites located in the exons and introns as well as those located in the proximal, middle, and distal regions of 3′UTRs (Fig. 5b). Consistent with 3′UTR lengthening during retinal development, there is a trend of increase in the fraction of upregulated distal pA sites and a decrease in that of downregulated distal pA sites. For the proximal and middle pA sites, we observed an opposite trend (Fig. 5b). Moreover, there are more upregulated than downregulated intronic pA sites (Fig. 5b).
Fig. 5.

Preferential usage of weak proximal pA sites at the early developmental stages. a Schematic representation of different types of pA sites. E, I, P, M, and D indicate exonic, intronic, proximal, middle, and distal pA sites, respectively. b Number of downregulated (Down) and upregulated (Up) pA sites of different types when later stages are compared to E13.5. c Frequency of the PAS for different types of pA sites. d Hexamer sequence motif identified by MEME analysis of the upstream 10–30 nt region of the pA sites without canonical PAS or the 12 most common variants in human. The log-likelihood ratio (1421) and E value (2.9E−012) are significant compared with the zero-order Makov model using the background letter frequencies. e Heat map of fold change in expression level (RPM in logarithm scale) of 94 cleavage and polyadenylation-associated (CPA) factor genes when later stages are compared to E13.5. The expression level is approximated by the summed tags of the pA sites assigned to the same gene
Comparing PAS motifs of proximal and distal pA sites for the lengthened and shortened genes showed a conspicuous change in the usage of the canonical signal AAUAAA (Fisher’s exact test, p < 0.0001), where the usage of the canonical PAS at distal sites is 19% higher than that at the proximal sites (Fig. 5c). We also searched for the de novo sequence motif in the upstream 10–30 nt of the pA sites using the MEME suite. In addition to the canonical motif and 12 previously identified variants recovered by our motif analysis, we also identified a highly enriched motif (log-likelihood ratio of 1421 and E value of 2.9E−012) (Fig. 5d), indicating a possible new PAS in the mouse retinal tissue. Since the 3′UTR length displays a global increase during retinal development, the shorter 3′UTR isoforms are more abundantly produced at the early stages, suggesting a preferential usage of the weaker proximal pA sites. The expression of genes encoding cleavage and polyadenylation-associated (CPA) factors that are reported to participate in the regulation of pA site selection, including more than 80 proteins constituting the 3′ processing complex, such as the cleavage and polyadenylation specificity factor, cleavage stimulation factor, and poly(A) polymerase [16, 24, 35], was quantified by the summed PA-seq tags of all the pA sites corresponding to the same gene and compared between developmental stages. Most of the CPA genes showed higher expression at early embryonic stages (Fig. 5e), consistent with the finding from the previous studies indicating that increased expression levels of the CPA-associated factors may be correlated with the preference for the weaker proximal pA sites at the early stages [24, 35, 38].
Regulatory role of alternative polyadenylation in gene expression
Scatter plots revealed that the fold change of the transcript abundance between E13.5 and later stages showed progressively higher variance as retinal development progresses. This is in concordance with the gradually increased differences of the 3′UTR length (Fig. 6a), suggesting possible involvement of APA in regulating gene expression. Weak negative correlations between the 3′UTR length and the transcript abundance of the corresponding genes were observed at E13.5 (Fig. 6b), E15.5 (Fig. 6c), and E18.5 (−0.13, −0.12, and −0.11, respectively), whereas little correlations were observed at P0, P6, and P21 (−0.1, −0.07, and −0.03, respectively). The weak reverse correlation between 3′UTR length and gene expression level agrees with the previous studies in zebrafish and human [35, 44, 72].
Fig. 6.

Regulatory role of alternative polyadenylation in gene expression. a Scatter plots of the difference in 3′ UTR length and log10-transformed fold change in transcript abundance when later stages are compared to E13.5. b, c Scatter plots of the 3′UTR length and the expression estimated by the PA-seq tags of pA sites assigned to the same gene at E13.5 (b) and E15.5 (c)
The RNA-binding proteins (RBPs) and/or microRNAs (miRNAs) have been reported to interact with cis-regulatory elements in 3′UTRs, and the gain/loss of these elements during the change of 3′UTR length is related with RNA stability and/or translation efficiency [2, 3, 11, 20–23]. To examine possible involvement of RBPs and miRNAs in regulating gene expression, the binding motifs of RBPs and miRNAs were searched against the lengthened/shortened regions of 3′UTRs introduced by alternative usage of the distal PAS (see “Materials and methods” for details). We downloaded the binding motifs of 93 RBPs generated by RNA-binding protein microarrays [16]. In addition, we also retrieved a total of 1915 mouse miRNA sequences in the seed region from the miRBase database [56]. We found that 15 RBPs and six miRNAs were significantly enriched in the lengthened/shortened regions of 3′UTRs (Supplementary Tables S3 and S4). Among the 15 RBPs, U2af2 and Pabpc1 are known CPA factors [24, 73], and Hnrnpc has been reported to bind to 3′ UTRs to regulate the transcript abundance of target genes [16, 74, 75]. Thus, these RBPs and miRNAs may target 3′UTRs and play a role in RNA stabilization/destabilization, implicating a mechanism of gene regulation by APA through the gain/loss of RBP and miRNA-binding sites during retinal development.
Polyadenylated lncRNAs during retinal development
LncRNAs play important regulatory roles in neuronal development and disease [76, 77]. In this study, lncRNAs made up a considerable fraction of the polyadenylated transcripts in the mouse retina (Fig. 1a–d). We, therefore, sought to infer functions of lncRNAs by the pathway analysis of co-expressed protein-coding mRNAs, where the correlation of polyadenylated lncRNAs and mRNAs was calculated by Pearson correlation, and co-expression network was constructed based on the lncRNA/mRNA pairs with R > 0.9.
Through co-expression analysis, we identified 197 polyadenylated lncRNAs co-expressed with protein-coding genes involved in phototransduction, visual perception, neurophysiological processes, synaptogenesis, and synaptic transmission, etc. (fdr < 0.05). Figure 7 shows 51 lncRNAs with high expression level (log10 summed RPM > 2) and their associated functional pathways. The relevance of some lncRNAs in the network to retinal development has been shown in many previous studies. Six3os1 and Vax2os have been demonstrated to be natural antisense transcripts associated with genes involved in eye development [78], with the former regulating retinal development by modulating the activity of homeodomain transcription factor Six3 and the latter controlling the cell cycle progression of photoreceptor progenitors in the mouse retina [79, 80]. Rncr4 is involved in controlling the formation of proper retinal architecture by promoting timed pri-miR-183/96/182 maturation in postnatal photoreceptors [77]. LncRNA Cyrano (1700020I14Rik) is required for proper embryonic development, and knockdown of cyrano results in reduced brain and eye size and aberrant neural tube opening in zebrafish [81]. Malat1 regulates neuronal synaptogenesis and is significantly upregulated in retinas of diabetic mice as well as in the aqueous humor and fibrovascular membranes of diabetic patients [82, 83].
Fig. 7.

Polyadenylated lncRNA/mRNA co-expression network associated with retinal functions constructed using the Cytoscape program. The lncRNAs with a minimum expression level (log10 summed RPM) of 2 and a lncRNA-mRNA Pearson correlation coefficient larger than 0.9 were selected to draw the functional annotation network. The nodes indicate lncRNAs (green), biological processes of GO enrichment (BP, blue), KEGG (purple), and GeneGo (red) pathways. The transparency of the edges (yellow) represents the significance of the functional annotation. The text transparency and font size (black to light grey) of the lncRNA names are scaled to the estimated expression level of the corresponding lncRNAs
Discussion
As a part of CNS with easy accessibility and relative simplicity, retina has long provided an ideal system in which to study the molecular and cellular principles of CNS development as well as relevant mechanisms of gene regulation [41, 84]. The development of retina, like any other CNS tissue, is a precise and complex process that must be coordinately regulated at multiple levels, including transcriptional, post-transcriptional, and epigenetic. To investigate whether APA contributes to this important developmental process, we profiled genome-wide pA sites in the developing mouse retina from embryonic to postnatal stages by a PA-seq approach. We identified developmentally regulated APA events that may participate in stage-specific regulation of gene expression. As retinal development progresses, there is a preference for the usage of distal PASs over the proximal ones in 3′UTRs, resulting in overall lengthening of RNAs. Some RBP and miRNA-binding sites were found to be enriched in the lengthened/shortened regions of 3′UTRs, which may participate in the regulation of target gene expression. Moreover, a substantial number of polyadenylated lncRNAs showed a high level of co-expression with the protein-coding genes involved in phototransduction, visual perception, transmission of nerve impulse, neurophysiological processes, circadian rhythm, and so on. Thus, cleavage and polyadenylation events are regulated during retinal development and should be considered as an important mechanism of gene regulation underlying this delicate CNS developmental process.
From the PA-seq reads of all tested stages in our study, we found that approximately 60% of the distinct pA sites are novel pA sites that have not yet been annotated in the latest PolyA_DB or Gencode database (Fig. 1b; Supplementary Fig. S1). Most of the annotated pA sites are located in 3′UTR, which display a significantly higher expression of the associated transcripts than those in the other genomic regions (Fig. 1d, two-tailed test, p < 0.0001). Therefore, most of the currently annotated pA sites must be derived from abundantly expressed gene isoforms, in particular, protein-coding genes with a 3′UTR. In contrast, the novel pA sites are expressed in lower abundance than the annotated pA sites, consistent with the fact that 44% of them are located in the extended 3′UTR, intron, and exon of protein-coding and lncRNA genes (Fig. 1b). Indeed, it has been shown that transcripts terminated at the intronic pA site of the Zip3 gene and those at the exonic pA site of the reelin gene are expressed in low levels [85, 86]. Our results thus have identified numerous novel unannotated pA sites in the mouse genome and suggest that there are still many more to be discovered, particularly those associated with low-abundant transcripts.
We have identified stage-specific pA sites during mouse retinal development at most of the developmental stages we tested (Fig. 2), suggesting that RNA polyadenylation is highly regulated in development. For instance, embryonic retinas consist mostly of dividing progenitor cells and we found that the embryonic stage-specific pA sites are associated with genes involved in cell cycle and cytoskeleton remodeling. P6–P21 is a postnatal period characterized by the differentiation and maturation of photoreceptors [87, 88]. Indeed, we found that pA sites specific to P6 and P21 are particularly associated with genes involved in phototransduction, neurophysiological process of visual perception, and detection of stimulus involved in sensory perception. These results imply that APA may play an important role in controlling photoreceptor differentiation and function. Since dysfunction in RNA splicing machinery results in photoreceptor-related degenerative retinal disease retinitis pigmentosa [89], it is conceivable that disregulation in RNA polyadenylation may be involved in retinal degeneration as well.
Our study also revealed a progressively global lengthening of RNA transcripts due to the preferential usage of the distal PAS in the 3′UTR during retinal development. This temporal pattern is consistent with the previous findings that development and differentiation are associated with upregulation of long 3′UTR isoforms, whereas proliferating cells tend to express short 3′UTR isoforms [14, 19, 24]. We found that the PASs of distal pA sites in the 3′UTRs are more likely to be the stronger canonical signal AAUAAA than those of the proximal ones and that the expression of genes for cleavage and polyadenylation-associated factors tends to decrease as retinal development progresses (Fig. 5c, e). As such, the long transcripts with a stronger PAS would be more likely to be expressed than the short ones when the 3′ end processing activity is diminished. Thus, the strength of the PAS and 3′ end processing may be a major determinant of global changes in the length of RNA transcripts during development and differentiation [14]. Besides regulated APA events in the 3′UTR, interestingly, we found that retinal development is also accompanied by increased usage of intronic sites when compared with E13.5 (Fig. 5a, b). Previously, biased usage of the intronic pA sites has been shown to exist in different human tissues and during development and differentiation [14, 71].
The generation by APA of RNA transcript isoforms with different 3′UTR lengths provides a mechanism of post-transcriptional gene regulation via the gain or loss of cis-elements for miRNAs and RBPs, which often cause RNA degradation [90–93]. We observed a weak negative correlation between 3′UTR length and the expression level of the corresponding genes at E13.5, E15.5, and E18.5 (Fig. 6b, c), in agreement with the notion that 3′UTR lengthening leads to potential gain of binding sites for destabilizing transacting factors. However, 3′UTR lengthening does not necessarily result in downregulated gene expression. For instance, we failed to observe any correlation between 3′UTR length and the expression level of the corresponding genes at P0, P6, and P21 in retinal development. Similarly, there is only a weak reverse correlation between 3′ UTR length and gene expression level among human tissues [44]. There are at least two explanations for this phenomenon: (1) some RBPs can act as stabilizing factors for target RNAs; (2) some RBPs may antagonize the negative effect of miRNAs and/or other RBPs on RNA stability [17, 94]. Therefore, post-transcriptional gene regulation at 3′UTRs during retinal development may be combinatorial and complex, involving both positive and negative mechanisms. In addition to serving as a repository of cis-acting elements, some of the 3′UTR extensions might be processed into a range of small RNAs and long coding and non-coding RNAs, representing a regulated mechanism to diversify the transcriptome [33, 95].
In summary, this study is the first to survey and investigate in-depth the temporal landscape change of mRNA and lncRNA polyadenylation during the developmental process of a CNS tissue, the retina. We have identified stage-specific pA sites that are enriched for genes critical for retinal development and visual perception, as well as demonstrated 3′UTR lengthening and increased usage of intronic pA sites over development that would result in gaining many different RBP and/or miRNA target sites. These data reveal a dynamically regulated APA pattern during retinal development and maturation, and implicate an important contribution of APA to gene regulation underlying CNS development. Our findings provide a framework with which to further dissect the roles of APA, RBPs, miRNAs, and lncRNAs in retinal development and diseases.
Electronic supplementary material
Below is the link to the electronic supplementary material.
Acknowledgements
We thank Dr. Kangxin Jin for critical reading of and thoughtful comments on the manuscript. This work was supported by the China Postdoctoral Science Foundation (2015M582461) to HWY; the National Basic Research Program (973 Program) of China (2015CB964600), the National Institutes of Health (EY020849 and EY012020), and the Fundamental Research Funds of the State Key Laboratory of Ophthalmology, Sun Yat-sen University to MX; and the National Natural Science Foundation of China (31471232), Major Program of Science and Technology of Guangzhou (201607020001), Science and Technology Planning Projects of Guangdong Province (2014B030301040), and Joint Research Fund for Overseas Natural Science of China (3030901001222) to ZX.
Footnotes
W. Hu and S. Li contributed equally to this work.
Contributor Information
Zhi Xie, Phone: (86 20) 87335131, Email: xiezhi@gmail.com.
Mengqing Xiang, Phone: (86 20) 87334950, Email: xiangmq3@mail.sysu.edu.cn.
References
- 1.Darmanis S, Sloan SA, Zhang Y, Enge M, Caneda C, Shuer LM, Hayden Gephart MG, Barres BA, Quake SR. A survey of human brain transcriptome diversity at the single cell level. Proc Natl Acad Sci USA. 2015;112:7285–7290. doi: 10.1073/pnas.1507125112. [DOI] [PMC free article] [PubMed] [Google Scholar]
- 2.Di Giammartino DC, Nishida K, Manley JL. Mechanisms and consequences of alternative polyadenylation. Mol Cell. 2011;43:853–866. doi: 10.1016/j.molcel.2011.08.017. [DOI] [PMC free article] [PubMed] [Google Scholar]
- 3.Danckwardt S, Hentze MW, Kulozik AE. 3′ end mRNA processing: molecular mechanisms and implications for health and disease. EMBO J. 2008;27:482–498. doi: 10.1038/sj.emboj.7601932. [DOI] [PMC free article] [PubMed] [Google Scholar]
- 4.Edmonds M. A history of poly A sequences: from formation to factors to function. Prog Nucleic Acid Res Mol Biol. 2002;71:285–389. doi: 10.1016/S0079-6603(02)71046-5. [DOI] [PubMed] [Google Scholar]
- 5.Millevoi S, Vagner S. Molecular mechanisms of eukaryotic pre-mRNA 3′ end processing regulation. Nucleic Acids Res. 2010;38:2757–2774. doi: 10.1093/nar/gkp1176. [DOI] [PMC free article] [PubMed] [Google Scholar]
- 6.Colgan DF, Manley JL. Mechanism and regulation of mRNA polyadenylation. Genes Dev. 1997;11:2755–2766. doi: 10.1101/gad.11.21.2755. [DOI] [PubMed] [Google Scholar]
- 7.Conne B, Stutz A, Vassalli JD. The 3′ untranslated region of messenger RNA: a molecular ‘hotspot’ for pathology? Nat Med. 2000;6:637–641. doi: 10.1038/76211. [DOI] [PubMed] [Google Scholar]
- 8.Lutz CS, Moreira A. Alternative mRNA polyadenylation in eukaryotes: an effective regulator of gene expression. Wiley Interdiscip Rev RNA. 2011;2:22–31. doi: 10.1002/wrna.47. [DOI] [PubMed] [Google Scholar]
- 9.Proudfoot NJ, Furger A, Dye MJ. Integrating mRNA processing with transcription. Cell. 2002;108:501–512. doi: 10.1016/S0092-8674(02)00617-7. [DOI] [PubMed] [Google Scholar]
- 10.Pascale A, Govoni S. The complex world of post-transcriptional mechanisms: is their deregulation a common link for diseases? Focus on ELAV-like RNA-binding proteins. Cell Mol Life Sci. 2012;69:501–517. doi: 10.1007/s00018-011-0810-7. [DOI] [PMC free article] [PubMed] [Google Scholar]
- 11.Curinha A, Oliveira Braz S, Pereira-Castro I, Cruz A, Moreira A. Implications of polyadenylation in health and disease. Nucleus. 2014;5:508–519. doi: 10.4161/nucl.36360. [DOI] [PMC free article] [PubMed] [Google Scholar]
- 12.Rehfeld A, Plass M, Krogh A, Friis-Hansen L. Alterations in polyadenylation and its implications for endocrine disease. Front Endocrinol (Lausanne) 2013;4:53. doi: 10.3389/fendo.2013.00053. [DOI] [PMC free article] [PubMed] [Google Scholar]
- 13.Tian B, Hu J, Zhang H, Lutz CS. A large-scale analysis of mRNA polyadenylation of human and mouse genes. Nucleic Acids Res. 2005;33:201–212. doi: 10.1093/nar/gki158. [DOI] [PMC free article] [PubMed] [Google Scholar]
- 14.Hoque M, Ji Z, Zheng D, Luo W, Li W, You B, Park JY, Yehia G, Tian B. Analysis of alternative cleavage and polyadenylation by 3′ region extraction and deep sequencing. Nat Methods. 2013;10:133–139. doi: 10.1038/nmeth.2288. [DOI] [PMC free article] [PubMed] [Google Scholar]
- 15.Wang ET, Sandberg R, Luo S, Khrebtukova I, Zhang L, Mayr C, Kingsmore SF, Schroth GP, Burge CB. Alternative isoform regulation in human tissue transcriptomes. Nature. 2008;456:470–476. doi: 10.1038/nature07509. [DOI] [PMC free article] [PubMed] [Google Scholar]
- 16.Ray D, Kazan H, Cook KB, Weirauch MT, Najafabadi HS, Li X, Gueroussov S, Albu M, Zheng H, Yang A, Na H, Irimia M, Matzat LH, Dale RK, Smith SA, Yarosh CA, Kelly SM, Nabet B, Mecenas D, Li W, Laishram RS, Qiao M, Lipshitz HD, Piano F, Corbett AH, Carstens RP, Frey BJ, Anderson RA, Lynch KW, Penalva LO, Lei EP, Fraser AG, Blencowe BJ, Morris QD, Hughes TR. A compendium of RNA-binding motifs for decoding gene regulation. Nature. 2013;499:172–177. doi: 10.1038/nature12311. [DOI] [PMC free article] [PubMed] [Google Scholar]
- 17.Iadevaia V, Gerber AP. Combinatorial control of mRNA fates by RNA-binding proteins and non-coding RNAs. Biomolecules. 2015;5:2207–2222. doi: 10.3390/biom5042207. [DOI] [PMC free article] [PubMed] [Google Scholar]
- 18.Fabian MR, Sonenberg N, Filipowicz W. Regulation of mRNA translation and stability by microRNAs. Annu Rev Biochem. 2010;79:351–379. doi: 10.1146/annurev-biochem-060308-103103. [DOI] [PubMed] [Google Scholar]
- 19.Sandberg R, Neilson JR, Sarma A, Sharp PA, Burge CB. Proliferating cells express mRNAs with shortened 3′ untranslated regions and fewer microRNA target sites. Science. 2008;320:1643–1647. doi: 10.1126/science.1155390. [DOI] [PMC free article] [PubMed] [Google Scholar]
- 20.Elkon R, Ugalde AP, Agami R. Alternative cleavage and polyadenylation: extent, regulation and function. Nat Rev Genet. 2013;14:496–506. doi: 10.1038/nrg3482. [DOI] [PubMed] [Google Scholar]
- 21.Subtelny AO, Eichhorn SW, Chen GR, Sive H, Bartel DP. Poly(A)-tail profiling reveals an embryonic switch in translational control. Nature. 2014;508:66–71. doi: 10.1038/nature13007. [DOI] [PMC free article] [PubMed] [Google Scholar]
- 22.Berkovits BD, Mayr C. Alternative 3′ UTRs act as scaffolds to regulate membrane protein localization. Nature. 2015;522:363–367. doi: 10.1038/nature14321. [DOI] [PMC free article] [PubMed] [Google Scholar]
- 23.de Klerk E, ’t Hoen PA. Alternative mRNA transcription, processing, and translation: insights from RNA sequencing. Trends Genet. 2015;31:128–139. doi: 10.1016/j.tig.2015.01.001. [DOI] [PubMed] [Google Scholar]
- 24.Ji Z, Tian B. Reprogramming of 3′ untranslated regions of mRNAs by alternative polyadenylation in generation of pluripotent stem cells from different cell types. PLoS One. 2009;4:e8419. doi: 10.1371/journal.pone.0008419. [DOI] [PMC free article] [PubMed] [Google Scholar]
- 25.Mayr C, Bartel DP. Widespread shortening of 3′UTRs by alternative cleavage and polyadenylation activates oncogenes in cancer cells. Cell. 2009;138:673–684. doi: 10.1016/j.cell.2009.06.016. [DOI] [PMC free article] [PubMed] [Google Scholar]
- 26.Flavell SW, Kim TK, Gray JM, Harmin DA, Hemberg M, Hong EJ, Markenscoff-Papadimitriou E, Bear DM, Greenberg ME. Genome-wide analysis of MEF2 transcriptional program reveals synaptic target genes and neuronal activity-dependent polyadenylation site selection. Neuron. 2008;60:1022–1038. doi: 10.1016/j.neuron.2008.11.029. [DOI] [PMC free article] [PubMed] [Google Scholar]
- 27.Batra R, Charizanis K, Manchanda M, Mohan A, Li M, Finn DJ, Goodwin M, Zhang C, Sobczak K, Thornton CA, Swanson MS. Loss of MBNL leads to disruption of developmentally regulated alternative polyadenylation in RNA-mediated disease. Mol Cell. 2014;56:311–322. doi: 10.1016/j.molcel.2014.08.027. [DOI] [PMC free article] [PubMed] [Google Scholar]
- 28.Goodwin M, Mohan A, Batra R, Lee KY, Charizanis K, Gomez FJ, Eddarkaoui S, Sergeant N, Buee L, Kimura T, Clark HB, Dalton J, Takamura K, Weyn-Vanhentenryck SM, Zhang C, Reid T, Ranum LP, Day JW, Swanson MS. MBNL sequestration by toxic RNAs and RNA misprocessing in the myotonic dystrophy brain. Cell Rep. 2015;12:1159–1168. doi: 10.1016/j.celrep.2015.07.029. [DOI] [PMC free article] [PubMed] [Google Scholar]
- 29.Gennarino VA, Alcott CE, Chen CA, Chaudhury A, Gillentine MA, Rosenfeld JA, Parikh S, Wheless JW, Roeder ER, Horovitz DD, Roney EK, Smith JL, Cheung SW, Li W, Neilson JR, Schaaf CP. Zoghbi HY (2015) NUDT21-spanning CNVs lead to neuropsychiatric disease and altered MeCP2 abundance via alternative polyadenylation. Elife. 1078;4:e10782. doi: 10.7554/eLife.10782. [DOI] [PMC free article] [PubMed] [Google Scholar]
- 30.Bennett CL, Brunkow ME, Ramsdell F, O’Briant KC, Zhu Q, Fuleihan RL, Shigeoka AO, Ochs HD, Chance PF. A rare polyadenylation signal mutation of the FOXP3 gene (AAUAAA → AAUGAA) leads to the IPEX syndrome. Immunogenetics. 2001;53:435–439. doi: 10.1007/s002510100358. [DOI] [PubMed] [Google Scholar]
- 31.Bennett CL, Christie J, Ramsdell F, Brunkow ME, Ferguson PJ, Whitesell L, Kelly TE, Saulsbury FT, Chance PF, Ochs HD. The immune dysregulation, polyendocrinopathy, enteropathy, X-linked syndrome (IPEX) is caused by mutations of FOXP3 . Nat Genet. 2001;27:20–21. doi: 10.1038/83713. [DOI] [PubMed] [Google Scholar]
- 32.Hilgers V, Perry MW, Hendrix D, Stark A, Levine M, Haley B. Neural-specific elongation of 3′ UTRs during Drosophila development. Proc Natl Acad Sci USA. 2011;108:15864–15869. doi: 10.1073/pnas.1112672108. [DOI] [PMC free article] [PubMed] [Google Scholar]
- 33.Miura P, Shenker S, Andreu-Agullo C, Westholm JO, Lai EC. Widespread and extensive lengthening of 3′ UTRs in the mammalian brain. Genome Res. 2013;23:812–825. doi: 10.1101/gr.146886.112. [DOI] [PMC free article] [PubMed] [Google Scholar]
- 34.Shepard PJ, Choi EA, Lu J, Flanagan LA, Hertel KJ, Shi Y. Complex and dynamic landscape of RNA polyadenylation revealed by PAS-Seq. RNA. 2011;17:761–772. doi: 10.1261/rna.2581711. [DOI] [PMC free article] [PubMed] [Google Scholar]
- 35.Ulitsky I, Shkumatava A, Jan CH, Subtelny AO, Koppstein D, Bell GW, Sive H, Bartel DP. Extensive alternative polyadenylation during zebrafish development. Genome Res. 2012;22:2054–2066. doi: 10.1101/gr.139733.112. [DOI] [PMC free article] [PubMed] [Google Scholar]
- 36.Smibert P, Miura P, Westholm JO, Shenker S, May G, Duff MO, Zhang D, Eads BD, Carlson J, Brown JB, Eisman RC, Andrews J, Kaufman T, Cherbas P, Celniker SE, Graveley BR, Lai EC. Global patterns of tissue-specific alternative polyadenylation in Drosophila . Cell Rep. 2012;1:277–289. doi: 10.1016/j.celrep.2012.01.001. [DOI] [PMC free article] [PubMed] [Google Scholar]
- 37.Li Y, Sun Y, Fu Y, Li M, Huang G, Zhang C, Liang J, Huang S, Shen G, Yuan S, Chen L, Chen S, Xu A. Dynamic landscape of tandem 3′ UTRs during zebrafish development. Genome Res. 2012;22:1899–1906. doi: 10.1101/gr.128488.111. [DOI] [PMC free article] [PubMed] [Google Scholar]
- 38.Ji Z, Lee JY, Pan Z, Jiang B, Tian B. Progressive lengthening of 3′ untranslated regions of mRNAs by alternative polyadenylation during mouse embryonic development. Proc Natl Acad Sci USA. 2009;106:7028–7033. doi: 10.1073/pnas.0900028106. [DOI] [PMC free article] [PubMed] [Google Scholar]
- 39.Masland RH. The fundamental plan of the retina. Nat Neurosci. 2001;4:877–886. doi: 10.1038/nn0901-877. [DOI] [PubMed] [Google Scholar]
- 40.Masland RH. The neuronal organization of the retina. Neuron. 2012;76:266–280. doi: 10.1016/j.neuron.2012.10.002. [DOI] [PMC free article] [PubMed] [Google Scholar]
- 41.Livesey FJ, Cepko CL. Vertebrate neural cell-fate determination: lessons from the retina. Nat Rev Neurosci. 2001;2:109–118. doi: 10.1038/35053522. [DOI] [PubMed] [Google Scholar]
- 42.Agathocleous M, Harris WA. From progenitors to differentiated cells in the vertebrate retina. Annu Rev Cell Dev Biol. 2009;25:45–69. doi: 10.1146/annurev.cellbio.042308.113259. [DOI] [PubMed] [Google Scholar]
- 43.Xiang M. Intrinsic control of mammalian retinogenesis. Cell Mol Life Sci. 2013;70:2519–2532. doi: 10.1007/s00018-012-1183-2. [DOI] [PMC free article] [PubMed] [Google Scholar]
- 44.Ni T, Yang Y, Hafez D, Yang W, Kiesewetter K, Wakabayashi Y, Ohler U, Peng W, Zhu J. Distinct polyadenylation landscapes of diverse human tissues revealed by a modified PA-seq strategy. BMC Genom. 2013;14:615. doi: 10.1186/1471-2164-14-615. [DOI] [PMC free article] [PubMed] [Google Scholar]
- 45.Hafez D, Ni T, Mukherjee S, Zhu J, Ohler U. Genome-wide identification and predictive modeling of tissue-specific alternative polyadenylation. Bioinformatics. 2013;29:i108–i116. doi: 10.1093/bioinformatics/btt233. [DOI] [PMC free article] [PubMed] [Google Scholar]
- 46.Li H, Durbin R. Fast and accurate short read alignment with Burrows–Wheeler transform. Bioinformatics. 2009;25:1754–1760. doi: 10.1093/bioinformatics/btp324. [DOI] [PMC free article] [PubMed] [Google Scholar]
- 47.Boyle AP, Guinney J, Crawford GE, Furey TS. F-Seq: a feature density estimator for high-throughput sequence tags. Bioinformatics. 2008;24:2537–2538. doi: 10.1093/bioinformatics/btn480. [DOI] [PMC free article] [PubMed] [Google Scholar]
- 48.Schug J, Schuller WP, Kappen C, Salbaum JM, Bucan M, Jr, Stoeckert CJ. Promoter features related to tissue specificity as measured by Shannon entropy. Genome Biol. 2005;6:R33. doi: 10.1186/gb-2005-6-4-r33. [DOI] [PMC free article] [PubMed] [Google Scholar]
- 49.Brooks MJ, Rajasimha HK, Roger JE, Swaroop A. Next-generation sequencing facilitates quantitative analysis of wild-type and Nrl (−/−) retinal transcriptomes. Mol Vis. 2011;17:3034–3054. [PMC free article] [PubMed] [Google Scholar]
- 50.Trapnell C, Pachter L, Salzberg SL. TopHat: discovering splice junctions with RNA-Seq. Bioinformatics. 2009;25:1105–1111. doi: 10.1093/bioinformatics/btp120. [DOI] [PMC free article] [PubMed] [Google Scholar]
- 51.Anders S, Pyl PT, Huber W. HTSeq–a Python framework to work with high-throughput sequencing data. Bioinformatics. 2015;31:166–169. doi: 10.1093/bioinformatics/btu638. [DOI] [PMC free article] [PubMed] [Google Scholar]
- 52.Varemo L, Nielsen J, Nookaew I. Enriching the gene set analysis of genome-wide data by incorporating directionality of gene expression and combining statistical hypotheses and methods. Nucleic Acids Res. 2013;41:4378–4391. doi: 10.1093/nar/gkt111. [DOI] [PMC free article] [PubMed] [Google Scholar]
- 53.Retelska D, Iseli C, Bucher P, Jongeneel CV, Naef F. Similarities and differences of polyadenylation signals in human and fly. BMC Genom. 2006;7:176. doi: 10.1186/1471-2164-7-176. [DOI] [PMC free article] [PubMed] [Google Scholar]
- 54.Bailey TL, Elkan C. Fitting a mixture model by expectation maximization to discover motifs in biopolymers. Proc Int Conf Intell Syst Mol Biol. 1994;2:28–36. [PubMed] [Google Scholar]
- 55.CisBP-RNA database. http://cisbp-rna.ccbr.utoronto.ca/
- 56.Kozomara A, Griffiths-Jones S. miRBase: annotating high confidence microRNAs using deep sequencing data. Nucleic Acids Res. 2014;42:D68–D73. doi: 10.1093/nar/gkt1181. [DOI] [PMC free article] [PubMed] [Google Scholar]
- 57.McLeay RC, Bailey TL. Motif Enrichment Analysis: a unified framework and an evaluation on ChIP data. BMC Bioinform. 2010;11:165. doi: 10.1186/1471-2105-11-165. [DOI] [PMC free article] [PubMed] [Google Scholar]
- 58.Qiu F, Jiang H, Xiang M. A comprehensive negative regulatory program controlled by Brn3b to ensure ganglion cell specification from multipotential retinal precursors. J Neurosci. 2008;28:3392–3403. doi: 10.1523/JNEUROSCI.0043-08.2008. [DOI] [PMC free article] [PubMed] [Google Scholar]
- 59.Fujitani Y, Fujitani S, Luo H, Qiu F, Burlison J, Long Q, Kawaguchi Y, Edlund H, Macdonald RJ, Furukawa T, Fujikado T, Magnuson MA, Xiang M, Wright CV. Ptf1a determines horizontal and amacrine cell fates during mouse retinal development. Development. 2006;133:4439–4450. doi: 10.1242/dev.02598. [DOI] [PubMed] [Google Scholar]
- 60.Shannon P, Markiel A, Ozier O, Baliga NS, Wang JT, Ramage D, Amin N, Schwikowski B, Ideker T. Cytoscape: a software environment for integrated models of biomolecular interaction networks. Genome Res. 2003;13:2498–2504. doi: 10.1101/gr.1239303. [DOI] [PMC free article] [PubMed] [Google Scholar]
- 61.Lee JY, Yeh I, Park JY, Tian B. PolyA_DB 2: mRNA polyadenylation sites in vertebrate genes. Nucleic Acids Res. 2007;35:D165–D168. doi: 10.1093/nar/gkl870. [DOI] [PMC free article] [PubMed] [Google Scholar]
- 62.Jan CH, Friedman RC, Ruby JG, Bartel DP. Formation, regulation and evolution of Caenorhabditis elegans 3′UTRs. Nature. 2011;469:97–101. doi: 10.1038/nature09616. [DOI] [PMC free article] [PubMed] [Google Scholar]
- 63.Fu Y, Sun Y, Li Y, Li J, Rao X, Chen C, Xu A. Differential genome-wide profiling of tandem 3′ UTRs among human breast cancer and normal cells by high-throughput sequencing. Genome Res. 2011;21:741–747. doi: 10.1101/gr.115295.110. [DOI] [PMC free article] [PubMed] [Google Scholar]
- 64.Gene Expression Atlas database. https://www.ebi.ac.uk/gxa/home
- 65.Marzinke MA, Clagett-Dame M. The all-trans retinoic acid (atRA)-regulated gene Calmin (Clmn) regulates cell cycle exit and neurite outgrowth in murine neuroblastoma (Neuro2a) cells. Exp Cell Res. 2012;318:85–93. doi: 10.1016/j.yexcr.2011.10.002. [DOI] [PubMed] [Google Scholar]
- 66.Pires-daSilva A, Nayernia K, Engel W, Torres M, Stoykova A, Chowdhury K, Gruss P. Mice deficient for spermatid perinuclear RNA-binding protein show neurologic, spermatogenic, and sperm morphological abnormalities. Dev Biol. 2001;233:319–328. doi: 10.1006/dbio.2001.0169. [DOI] [PubMed] [Google Scholar]
- 67.Yano M, Hayakawa-Yano Y, Mele A, Darnell RB. Nova2 regulates neuronal migration through an RNA switch in disabled-1 signaling. Neuron. 2010;66:848–858. doi: 10.1016/j.neuron.2010.05.007. [DOI] [PMC free article] [PubMed] [Google Scholar]
- 68.Zhang C, Frias MA, Mele A, Ruggiu M, Eom T, Marney CB, Wang H, Licatalosi DD, Fak JJ, Darnell RB. Integrative modeling defines the Nova splicing-regulatory network and its combinatorial controls. Science. 2010;329:439–443. doi: 10.1126/science.1191150. [DOI] [PMC free article] [PubMed] [Google Scholar]
- 69.Sinning A, Liebmann L, Kougioumtzes A, Westermann M, Bruehl C, Hubner CA. Synaptic glutamate release is modulated by the Na+-driven Cl-/HCO(3)(–) exchanger Slc4a8. J Neurosci. 2011;31:7300–7311. doi: 10.1523/JNEUROSCI.0269-11.2011. [DOI] [PMC free article] [PubMed] [Google Scholar]
- 70.Lachke SA, Higgins AW, Inagaki M, Saadi I, Xi Q, Long M, Quade BJ, Talkowski ME, Gusella JF, Fujimoto A, Robinson ML, Yang Y, Duong QT, Shapira I, Motro B, Miyoshi J, Takai Y, Morton CC, Maas RL. The cell adhesion gene PVRL3 is associated with congenital ocular defects. Hum Genet. 2012;131:235–250. doi: 10.1007/s00439-011-1064-z. [DOI] [PMC free article] [PubMed] [Google Scholar]
- 71.Zhang H, Lee JY, Tian B. Biased alternative polyadenylation in human tissues. Genome Biol. 2005;6:R100. doi: 10.1186/gb-2005-6-12-r100. [DOI] [PMC free article] [PubMed] [Google Scholar]
- 72.Ji Z, Luo W, Li W, Hoque M, Pan Z, Zhao Y, Tian B. Transcriptional activity regulates alternative cleavage and polyadenylation. Mol Syst Biol. 2011;7:534. doi: 10.1038/msb.2011.69. [DOI] [PMC free article] [PubMed] [Google Scholar]
- 73.Shi Y, Di Giammartino DC, Taylor D, Sarkeshik A, Rice WJ, Yates JR, 3rd, Frank J, Manley JL. Molecular architecture of the human pre-mRNA 3′ processing complex. Mol Cell. 2009;33:365–376. doi: 10.1016/j.molcel.2008.12.028. [DOI] [PMC free article] [PubMed] [Google Scholar]
- 74.Sokolowski M, Schwartz S. Heterogeneous nuclear ribonucleoprotein C binds exclusively to the functionally important UUUUU-motifs in the human papillomavirus type-1 AU-rich inhibitory element. Virus Res. 2001;73:163–175. doi: 10.1016/S0168-1702(00)00238-0. [DOI] [PubMed] [Google Scholar]
- 75.Shetty S. Regulation of urokinase receptor mRNA stability by hnRNP C in lung epithelial cells. Mol Cell Biochem. 2005;272:107–118. doi: 10.1007/s11010-005-7644-2. [DOI] [PubMed] [Google Scholar]
- 76.Clark BS, Blackshaw S. Long non-coding RNA-dependent transcriptional regulation in neuronal development and disease. Front Genet. 2014;5:164. doi: 10.3389/fgene.2014.00164. [DOI] [PMC free article] [PubMed] [Google Scholar]
- 77.Krol J, Krol I, Alvarez CP, Fiscella M, Hierlemann A, Roska B, Filipowicz W. A network comprising short and long noncoding RNAs and RNA helicase controls mouse retina architecture. Nat Commun. 2015;6:7305. doi: 10.1038/ncomms8305. [DOI] [PMC free article] [PubMed] [Google Scholar]
- 78.Alfano G, Vitiello C, Caccioppoli C, Caramico T, Carola A, Szego MJ, McInnes RR, Auricchio A, Banfi S. Natural antisense transcripts associated with genes involved in eye development. Hum Mol Genet. 2005;14:913–923. doi: 10.1093/hmg/ddi084. [DOI] [PubMed] [Google Scholar]
- 79.Rapicavoli NA, Poth EM, Zhu H, Blackshaw S. The long noncoding RNA Six3OS acts in trans to regulate retinal development by modulating Six3 activity. Neural Dev. 2011;6:32. doi: 10.1186/1749-8104-6-32. [DOI] [PMC free article] [PubMed] [Google Scholar]
- 80.Meola N, Pizzo M, Alfano G, Surace EM, Banfi S. The long noncoding RNA Vax2os1 controls the cell cycle progression of photoreceptor progenitors in the mouse retina. RNA. 2012;18:111–123. doi: 10.1261/rna.029454.111. [DOI] [PMC free article] [PubMed] [Google Scholar]
- 81.Ulitsky I, Shkumatava A, Jan CH, Sive H, Bartel DP. Conserved function of lincRNAs in vertebrate embryonic development despite rapid sequence evolution. Cell. 2011;147:1537–1550. doi: 10.1016/j.cell.2011.11.055. [DOI] [PMC free article] [PubMed] [Google Scholar]
- 82.Yan B, Tao ZF, Li XM, Zhang H, Yao J, Jiang Q. Aberrant expression of long noncoding RNAs in early diabetic retinopathy. Invest Ophthalmol Vis Sci. 2014;55:941–951. doi: 10.1167/iovs.13-13221. [DOI] [PubMed] [Google Scholar]
- 83.Bernard D, Prasanth KV, Tripathi V, Colasse S, Nakamura T, Xuan Z, Zhang MQ, Sedel F, Jourdren L, Coulpier F, Triller A, Spector DL, Bessis A. A long nuclear-retained non-coding RNA regulates synaptogenesis by modulating gene expression. EMBO J. 2010;29:3082–3093. doi: 10.1038/emboj.2010.199. [DOI] [PMC free article] [PubMed] [Google Scholar]
- 84.Cepko C. Intrinsically different retinal progenitor cells produce specific types of progeny. Nat Rev Neurosci. 2014;15:615–627. doi: 10.1038/nrn3767. [DOI] [PubMed] [Google Scholar]
- 85.Urbanczyk A, Junemann A, Enz R. PKCzeta-interacting protein ZIP3 is generated by intronic polyadenylation, and is expressed in the brain and retina of the rat. Biochem J. 2011;433:43–50. doi: 10.1042/BJ20101111. [DOI] [PubMed] [Google Scholar]
- 86.Lambert de Rouvroit C, Bernier B, Royaux I, de Bergeyck V, Goffinet AM. Evolutionarily conserved, alternative splicing of reelin during brain development. Exp Neurol. 1999;156:229–238. doi: 10.1006/exnr.1999.7019. [DOI] [PubMed] [Google Scholar]
- 87.Morrow EM, Belliveau MJ, Cepko CL. Two phases of rod photoreceptor differentiation during rat retinal development. J Neurosci. 1998;18:3738–3748. doi: 10.1523/JNEUROSCI.18-10-03738.1998. [DOI] [PMC free article] [PubMed] [Google Scholar]
- 88.Zack DJ, Bennett J, Wang Y, Davenport C, Klaunberg B, Gearhart J, Nathans J. Unusual topography of bovine rhodopsin promoter-lacZ fusion gene expression in transgenic mouse retinas. Neuron. 1991;6:187–199. doi: 10.1016/0896-6273(91)90355-4. [DOI] [PubMed] [Google Scholar]
- 89.Liu MM, Zack DJ. Alternative splicing and retinal degeneration. Clin Genet. 2013;84:142–149. doi: 10.1111/cge.12181. [DOI] [PMC free article] [PubMed] [Google Scholar]
- 90.Cao X, Yeo G, Muotri AR, Kuwabara T, Gage FH. Noncoding RNAs in the mammalian central nervous system. Annu Rev Neurosci. 2006;29:77–103. doi: 10.1146/annurev.neuro.29.051605.112839. [DOI] [PubMed] [Google Scholar]
- 91.Szostak E, Gebauer F. Translational control by 3′-UTR-binding proteins. Brief Funct Genomics. 2013;12:58–65. doi: 10.1093/bfgp/els056. [DOI] [PMC free article] [PubMed] [Google Scholar]
- 92.He L, Hannon GJ. MicroRNAs: small RNAs with a big role in gene regulation. Nat Rev Genet. 2004;5:522–531. doi: 10.1038/nrg1379. [DOI] [PubMed] [Google Scholar]
- 93.Shyu AB, Wilkinson MF, van Hoof A. Messenger RNA regulation: to translate or to degrade. EMBO J. 2008;27:471–481. doi: 10.1038/sj.emboj.7601977. [DOI] [PMC free article] [PubMed] [Google Scholar]
- 94.Gardiner AS, Twiss JL, Perrone-Bizzozero NI. Competing interactions of RNA-binding proteins, microRNAs, and their targets control neuronal development and function. Biomolecules. 2015;5:2903–2918. doi: 10.3390/biom5042903. [DOI] [PMC free article] [PubMed] [Google Scholar]
- 95.Mercer TR, Dinger ME, Bracken CP, Kolle G, Szubert JM, Korbie DJ, Askarian-Amiri ME, Gardiner BB, Goodall GJ, Grimmond SM, Mattick JS. Regulated post-transcriptional RNA cleavage diversifies the eukaryotic transcriptome. Genome Res. 2010;20:1639–1650. doi: 10.1101/gr.112128.110. [DOI] [PMC free article] [PubMed] [Google Scholar]
Associated Data
This section collects any data citations, data availability statements, or supplementary materials included in this article.