Abstract
Introduction
Molecular imaging of the earliest events related to the development of acute lung injury (ALI)/acute respiratory distress syndrome (ARDS) could facilitate therapeutic development and patient management. We previously reported that 18F-fluoro-2-deoxyglucose (18F-FDG) PET identifies ALI/ARDS prior to radiographic abnormalities. The purpose of this study was to establish the time courses of 18F-FDG uptake, edema and neutrophil recruitment in an endotoxin-induced acute lung injury model and to examine molecular events required for 14C-2DG uptake in activated neutrophils.
Methods
Lung uptake of 18F-FDG was measured by PET in control male Sprague Dawley rats and at 2, 6 and 24 hours following the intraperitoneal injection of 10 mg/kg LPS. Lung edema (attenuation) was measured by microCT. Neutrophil influx into the lungs was measured by myeloperoxidase assay. Control and activated human donor neutrophils were compared for uptake of 14C-2DG, transcription and content of hexokinase and GLUT isoforms and for hexokinase (HK) activity.
Results
Significant uptake of 18F-FDG occurred by 2h following LPS, and progressively increased to 24h. Lung uptake of 18F-FDG preceded increased CT attenuation (lung edema). Myeloperoxidase activity in the lungs, supporting neutrophil influx, paralleled 18F-FDG uptake. Activation of isolated human neutrophils resulted in increased uptake of 14C-2DG, expression of GLUT 3 and GLUT 4 and expression and increased HK1 activity.
Conclusion
Systemic endotoxin-induced ALI results in very early and progressive uptake of 18F-FDG, parallels neutrophil accumulation and occurs earlier than lung injury edema. Activated neutrophils show increased uptake of 14C-2DG, expression of specific GLUT3, GLUT4 and HK1 protein and HK activity.
Advances in knowledge and implications for patient care
18F-FDG pulmonary uptake is an early biomarker of neutrophil recruitment in ALI and is associated with specific molecular events that mediate 14C-2DG uptake in activated neutrophils. 18F-FDG PET may provide a potential mechanism for early diagnosis and therapeutic assessment of ALI/ARDS.
Keywords: 18F-fluordeoxyglucose, FDG, neutrophils, ARDS, lipopolysaccharide, acute lung injury, platelet activating factor
1. Introduction
Acute lung injury (ALI) and its more severe consequence, acute respiratory distress syndrome (ARDS), are causes of respiratory failure characterized by acute lung inflammation with tissue injury, leukocyte infiltration, increased endothelial permeability, pulmonary edema, and gas exchange impairment [1,2]. ALI/ARDS occurs as a consequence of diverse insults including sepsis, trauma, multiple transfusions and gas inhalation. The diagnosis of ALI/ARDS is primarily based on clinical and radiological findings and on gas exchange parameters, but these are late events occurring after inflammatory molecular signaling causes inflammatory cells and fluid to accumulate in the lungs, which may herald irreversible lung damage. Traditional imaging methods, chest x-rays and computed tomography (CT), are insensitive and nonspecific for these molecular events and are not helpful in the early diagnosis of ALI/ARDS. Radiographic features are also limited for the stratification of patients on clinical trials or new therapies.
Sepsis is a severe systemic inflammatory syndrome resulting from infection [3]. It is mediated by a dysregulated host inflammatory response to the presence of bioactive chemicals produced by an infectious pathogen, such as lipopolysaccharide (LPS endotoxin) produced by gram-negative bacteria. Sepsis can result in multi-organ dysfunction and failure, and remains one of the most important risk factors for ALI/ARDS [4]. Current methods to treat sepsis and its important complications, such as ARDS, remain largely supportive and relatively ineffective, with mortality rates approaching 40–60%. ALI/ARDS alone has a mortality rate of over 20%, and surviving patients are often left with permanent lung damage. Research efforts focused on treating ALI/ARDS resulting from sepsis range in complexity from aspirin to mesenchymal stem cells and gene therapy [5,6,7,8]. However, sensitive early ways to identify patients at risk for ARDS/ALI and to assess the level of disease activity are critical to the development and real-time monitoring of the efficacy of novel therapies.
Positron emission tomographic (PET) imaging with 18F-fluorodeoxyglucose (18F-FDG) has emerged as a noninvasive and highly sensitive imaging technique to quantify pulmonary inflammation [9,10]. New applications of PET imaging have been proposed to study a wide variety of respiratory inflammatory diseases, including asthma, COPD, tuberculosis and infectious pneumonias [11,12,13,14,15,16,17]. Uptake of 18F-FDG detected by PET has been described in clinical and experimental ALI/ARDS [18–21]. We have previously reported the use of 18F-FDG by PET to predict the development of ARDS in patients with thoracic trauma, prior to the development of radiographic changes [22]. Others have also reported increased 18F-FDG uptake in ARDS in normally aerated portions of the lung [23]. 18F-FDG PET may serve as a marker of level of disease activity in ALI/ARDS [24]. Together, these findings suggest that 18F-FDG PET may quantify early molecular and cellular events prior to development of clinical manifestations of ARDS, and may serve to monitor disease activity and therapeutic efficacy.
Recently, it has been recognized that increased expression of neutrophil related genes may represent one of the earliest events in sepsis-induced ALI/ARDS. This has lead to investigation of proteomic or genomic methods to identify ALI/ARDS in its earliest stages [25]. However, these methods may be limited by heterogeneity in expression of biomarkers. Previous studies have indicated infiltration of neutrophils may represent the major component of 18F-FDG uptake in lung parenchyma in ALI [26,27]. The goal of this study was to characterize the time course for pulmonary uptake of 18F-FDG relative to neutrophil influx and to compare this to development of increased tomographic density (pulmonary edema) in a rat model of endotoxin (LPS)-induced ALI. An additional objective was to characterize, in activated human neutrophils, the molecular events related to uptake of 14C-2-deoxyglucose (2DG).
2. Materials and methods
2.1 Overall study design
Acute lung injury was induced in rats by a single high dose (10 mg/kg) of intraperitoneally administered E. Coli lipopolysaccharide endotoxin (LPS). Control rats receiving no injection. Uptake of 18F-FDG PET by the lungs at 2, 6 and 24h post LPS was measured by microPET. Lung parenchymal densities (edema) in control and LPS-treated animals were measured by CT attenuation (Hounsfield units). Neutrophil migration into the lungs was assessed by myeloperoxidase assays performed on whole lung tissues. Cellular uptake of 14C-2DG was compared in isolated control human normal donor neutrophil and those activated with platelet activating factor (PAF). Changes in expression of glucose transporters (GLUT) and hexokinase (HK) isoforms with neutrophil activation were also assessed. In control and PAF-activated human neutrophils, relative differences in protein content of GLUT1, 2, 3 and 4 in membrane and cytosolic cellular fractions was compared by western blot (protein immunoblot) analysis. The effect of PAF-activation of neutrophils on total cellular GLUT3 and GLUT4 protein levels was determined by flow cytometry and by confocal microscopy (for GLUT3). Differences in hexokinase (HK) 1, 2, and 3 protein content were assessed by western blot in mitochondrial fractions. Hexokinase activity was also measured in mitochondrial fractions. For the two isoforms showing greatest changes in protein expression with PAF activation (GLUT3 and HK 1), transcriptional differences between control and PAF-activated human donor neutrophils were measured by real time polymerase chain reaction (qPCR).
2.2 Study site and assurances
All experiments were conducted at the University of Utah, Salt Lake City, UT. Animal experiments were performed with the approval of University of Utah Institutional Animal Care and Use Committee (protocol #08-01006), with adherence to the National Institutes of Health Guide for the Care and Use of Laboratory Animals. All efforts were made to minimize animal suffering. Human donor neutrophils were collected according to a University of Utah IRB-approved protocol (protocol #392).
2.3 Animals
A total of 18 male Sprague Dawley rats weighing between 200 and 300g were obtained from Charles River Laboratories, Inc. (Cambridge, MA). Rats were housed 2 per cage in HEPA-filtered clear plastic Theron #8 expanded rat cages (Theron Caging Systems, Inc, Hazelton, PA) with paper chip bedding (Shepard Specialty Papers, Watertown, TN) under pathogen free conditions within a room operating on a 12 hour light/dark cycle (light onset at 7:00 am). Water and food were freely available. Animal welfare and body weight were assessed daily. Animals were utilized experimentally as below.
2.4 Stimulus for acute lung injury
Acute lung injury/inflammation was induced by a single intraperitoneal injection of 10 mg/kg of E. coli lipopolysaccharide endotoxin (LPS, Sigma Aldrich, St. Louis, MO). Control animals received no injection.
2.5 MicroPET/CT
Food was withheld overnight prior to microPET/CT imaging. Water was provided ad libitum. Rats were scanned with an Inveon multimodality small animal PET/CT scanner (Siemens Medical Solutions USA, Knoxville, TN). Each rat underwent only one PET/CT imaging session and was thereafter euthanized. Six LPS-treated rats each were scanned at each time point following LPS (2h, 6h and 24h). Five control rats were also scanned. 4 uCi (0.148 Mbq) per gram body weight of 18F-FDG was injected intravenously by tail vein under gentle restraint.
The animals were then allowed to move freely for a 60-minute interval following injection. 10 minutes prior to imaging, animals were anesthetized with a single IP injection of a ketamine (90 mg/kg)/xylazine (10 mg/kg) cocktail. The rats were positioned in the scanner and a CT scan was acquired of the chest for anatomic localization and attenuation correction using the following parameters: 80 kVp, 0.5 mA, 220 ms/projection, 120 projections, and 220 degrees. At the conclusion of the CT scan, a 30-minute static PET scan was acquired. All images were corrected for detector normalization, photon attenuation, dead-time, and decay, and were reconstructed with OSEM3D/MAP with following parameters: zoom 2, 2 iterations, 16 subsets, and map_beta 0.00228. Image analysis was performed using the Inveon Research Workplace Image Analysis software.
Regions of interest were selected by CT, based on the absence of prominent vascular structures and not on visual background attenuation or metabolic activity. PET-CT images were first generated using attenuation-corrected PET images. The PET information was visually removed from coronal PET-CT images. A 10 px diameter circular (not volumetric) region of interest was placed in the upper and lower lung zones bilaterally on the coronal CT image, avoiding obvious vascular structures. The visual PET information was then added back to the fused images to insure that the lower regions had not been placed over the liver. The average of these 4 regions was calculated for each animal (+/− standard error of the mean). Pulmonary 18F-FDG activity (Bq/ml) and CT attenuation (Hounsfield units) were measured within in the same ROI. 118F-FDG activity (Bq/ml) between animals was directly comparable since each animal received the same FDG activity (4 uCi (0.148 Mbq) per gm body weight. Final 18F-FDG activity was adjusted for slight differences in actual injected dose from syringe measurements pre and post injection. Animals were euthanized by CO2 inhalation following microPET/CT imaging and lung tissues removed for analysis. To illustrate lung radioactivity without background tissues, representative ex-vivo lungs were inflated via intratracheal instillation of Tissue-Tek O.C.T. Compound (Sakura Finetek, USA), flash frozen in isobutene and embedded at −23°C. 20 um cryomicrotome sections were mounted on glass slides, dried and exposed by digital phosphor imaging (BAS-5000, FUJIFILM Life Sciences, Stamford, CT).
2.6 Isolation of human neutrophils
Blood samples were collected from normal human donors. Neutrophils were isolated by histopaque centrifugation and suspended in glucose transport buffer (129 mM NaCl, 4.7 mM KCl, 1.2 mM KH2PO4, 1.2 mM MgSO4, 2.0 mM CaCl2, 5 mM NaHCO3 and 10 mM HEPES, pH 7.4) with 3 mM glucose and 0.5% human albumin at concentration of 4 x 10⁶ cells/ml. The cells were incubated at 37°C in a water bath for additional determinations (below).
2.7 Activation of isolated neutrophils
Neutrophils were activated by a well-characterized stimulus [28]. Neutrophils were incubated with 10 nM platelet activating factor (PAF) (Sigma Aldrich, USA) for 30 min at 37 ° C in the above buffer. Control neutrophils were incubated in the same buffer, for the same interval, but without PAF.
2.8 Protein assays
Protein assays were performed by Pierce BCA Protein Assay Kit (ThermoFisher Scientific, Rockford, IL) according to the manufacturers protocol.
2.9 Uptake of 14C-2DG by isolated PAF-activated and control neutrophils
The neutrophils from 9 donors were isolated. 14C-2DG was added at 0.6 uCi/ml (22.2 kBq/ml) to control and PAF-activated neutrophils and incubated at 37°C for 15 min. The cells were washed through oil (Dow Corning 550 oil mixture, d=1.03). The radioactivity in pellets was quantified by liquid scintillation counting. Activity was expressed as dpm/mg protein.
2.10 Assay of Myeloperoxidase (MPO) in lung tissue
Neutrophil accumulation in the lungs resulting from LPS administration was assessed by a MPO assay. Lungs were removed from euthanized control rats and from rats at 2, 4 and 24h post IP LPS administration and were frozen at −80°C (n=3 for each cohort). MPO was extracted from whole lung tissues using 3 freeze-thaw cycles in hexadecyltrimethylammoniun bromide. MPO activity was assayed using a kinetic spectrophotometric technique [29]. Using O-dianisidine as a substrate, the absorbance change at 460 nm was measured using kinetic mode at 30 sec intervals for 12 time points. The lungs from 8 control and 6 LPS-treated rats were evaluated at each time point (2h, 6h and 24h), each in triplicate. The relative MPO activity was expressed as the reaction slope (changes in OD460/min/mg protein), using the Omega data analysis software.
2.11 Fractionation of isolated neutrophils
Control and PAF activated isolated human neutrophils were centrifuged at 1200 rpm for 10 min to harvest pellets and immediately frozen using dry ice and stored in −80°C freezer. The cells were re-suspended in homogenizing buffer (0.25 M sucrose, 50 mM Tris, 1 mM EDTA, 150 mM KCl, 5 mM MgCl2 and proteinase inhibitors) at the concentration of 5 x 10⁷ cells/ml. The cells were homogenized at 2000 rpm for 15 strokes and centrifuged at 200 x g for 5 min at 4°C to remove nuclei and unbroken cells. The resultant cytoplasmic supernatant fraction was collected, or, depending on the requirements of specific assays, layered in centrifuge tubes contained with 3 ml of 30% sucrose and 3 ml of 50% sucrose in homogenizing buffer and ultra-centrifuged using a Beckman SW41 Ti rotor at 30000 rpm for 1 h at 4°C. The cytosolic, membrane and cytoplasmic (mitochondrial-containing) fractions were separately collected.
2.12 Western Blot analysis
Protein levels of high affinity glucose transporters (GLUT) isoforms (GLUT 1, 3, 4, 6) and hexokinase isoforms (HK 1, 2, 3) were measured by western blot analysis using specific monoclonal antibodies (Santa Cruz Biotechnology, Dallas, TX) and Amersham ECL Plus Western Blotting Detection Reagents and corresponding protocol (GE Healthcare Life Sciences, Pittsburgh, PA). Cell fractions were dissolved in RIPA lysis and extraction buffer (Thermo Fisher Scientific) and protein concentrations were measured using BCA reagents. For GLUT isoforms, western blot analyses were performed separately on membrane and cytosolic fractions. For HK isoforms, western blots were performed on mitochondrial-containing (cytoplasmic) fractions. Western blot analyses were performed on control and activated neutrophils from 6 different human donors. Samples of equal protein content were mixed with loading buffer and heated at 75°C for 10 min. The mixtures were loaded on 8% (hexokinase) or 10% (GLUT transporters) SDS-PAGE gels and subjected to electrophoresis. The protein bands were transferred to nitrocellulose membranes for immunoblotting. Relative intensities of the bands in activated neutrophil samples were measured using a Fujifilm LAS-3000 imaging system (Fuji Photo Film, Tokyo, Japan) and quantified relative to control levels using Multi Gauge software, normalized to β-actin content in the same samples.
2.13 Confocal microscopy of GLUT3 expression by human neutrophils
Control and PAF-activated isolated human neutrophils from were fixed with 2% paraformaldehyde and 0.2% glutaraldehyde for 30 min at 37°C and cytospun onto glass slides. The cells were washed with PBS and blocked with 10% serum in PBS. (Santa Cruz Biotechnologies, Santa Cruz, CA) or rabbit polyclonal GLUT-3 antibodies (abCam Inc, Cambridge, MA) linked to 488 Alexa green (fluorescence). The cells were fixed a second time and washed. The images were taken using a confocal laser-scanning microscope (Olympus FV1000). The florescence intensities were analyzed using “Image J” software (NIH) in 93 regions of control cells (100,564 cells) and 57 regions of PAF activated cells (94,015 cells) from a total of 6 donors.
2.14 Flow cytometry of GLUT3 and GLUT4 expression by human neutrophils
Control and PAF-activated human neutrophils from 6 donors were fixed with 2% paraformaldehyde and 0.2% glutaraldehyde for 30 min at 37°C. The cells were washed and blocked with 1% bovine serum albumin (BSA) in PBS. Cells were immunolabeled (1h, 37°C) with PE-CD16 mouse anti-human monoclonal antibody (red florescence, BD Biosciences, San Jose, CA) and either monoclonal anti-GLUT4 (Santa Cruz Biotechnologies, Santa Cruz, CA) or rabbit polyclonal anti-GLUT3 antibodies (abCam Inc, Cambridge, MA) linked to 488 Alexa (green florescence). The cells were washed and re-suspended in 0.5 ml 1% BSA in PBS. Flow cytometry was performed (4 runs per sample) with a two-color analysis protocol. The results were analyzed using “FCS Express 3” software (De Novo Software).
2.15 Real-time polymerase chain reaction (qPCR)
The transcription of mRNA for GLUT3 and HK1 (the two isoforms showing greatest increase in protein with LPS by Western Blot and flow cytometry) was compared in control and PAF-activated human neutrophils from 5 donors by qPCR. Isolation human neutrophils were incubated in glucose transport buffer (above) at 4 x 10⁶ cells/ml. The cells were treated with 10 nM PAF for 1 hr (control cells incubated without PAF). Total RNA was isolated using Qiagen RNeasy Plus mini columns. The mRNA analysis was performed using two-step qRT-PCR, with GAPDH gene as an endogenous control. To minimize DNA contamination, 0.01U/ul uracil-N-glycosylase (UNG) was utilized to clear any dUTP-containing PCR products carried over into the reaction. The first strands of cDNA were synthesized using 2 ug of RNA and TaqMan reverse transcription reagents in total volume of 100 ul. The reactions were performed at 25°C for 10 min, 48°C for 30 min and 95°C for 5 min. These cDNAs were used for qPCR.
qPCR was performed according to the TaqMan MGB (minor grove-binder) method (AB Applied Biosystems, Thermo Fisher). The mRNA sequences of each gene were examined in the GeneBank. The probe and primers were designed according to the gene intron-exon structure and instructions for TaqMan MGB labeling. Sequences for forward and reverse primers, probes constructs and amplicon sizes for all examined GLUT-3 and HK-1 isoforms are as follows.
GLUT3: forward primer AACACTGGGGTCATCAATGCTC, reverse primer AGAGACGTGAGCAGCACCTCA, probe CTGAGAAGATCATAAAGGAAT, amplicon 88 bp.
HKI: forward primer GGATCCCTCAACCCTGGAA, reverse primer CCATCTTGACTAGGATCAGTCGAA, probe CTGTTTGAGAAGATGGTCAGT, amplicon 67 bp.
Fam was used as a fluorescent reporter dye bound at 5’ of probe and MGB and NFQ (non fluorescent quencher) bound at the 3’ end of the probe. GAPDH probe and primer were obtained from AB Applied Biosystems (Thermo Fisher Sci, Foster City, CA). Samples included a Blank (no cDNA) and two target genes (e.g. GLUT3 and GAPDH) in triplicates. The reactions, in a volume of 20 ul per well, were performed on Applied Biosystem Real Time PCR cycler (Thermo Fisher Sci, Foster City, CA), with a hold time of 20 min at 95°C, and cycled at 95°C for 1 min and 60°C for 2 min, for a total of 40 cycles. Fluorescent products were analyzed using Applied Biosystems’ “StepOne” software and expressed relative to GAPDH.
2.16 Hexokinase (HK) activity assay
HK activity was measured enzymatically in mitochondrial fractions of control and PAF-activated human neutrophils by the method of Scheer in which the downstream product of reaction (NADPH) is quantified spectrophotometrically [30]. Cell fractions from isolated human neutrophils were diluted to 400 ug protein/ml. The reaction was initiated in 96 well plates. To eliminate endogenous contamination, each sample had blank tubes without ATP, glucose or G6PD. The absorbance at 340 nm was recorded every 10 min using Fluostar Omega microplate reader (FLUOstar Omega, BMG Labtech, Cary, NC). The assay was conducted for 60 min at 30°C. The reaction slopes (changes in OD340/hr) were calculated using the Omega data analysis software. Relative hexokinase activities were expressed as a percent of control levels. The assay was repeated 3 times in triplicate for both control and PAF-activated neutrophils from 4 separate donors.
2.17 Statistical analysis
Differences in mean values between cohorts of animals (control vs. LPS), and between control and PAF-activated neutrophils were compared by one-way ANOVA analysis with type I error protection by Bonferroni or Dunnett (against control) tests. A statistically significant difference was defined as p < 0.05.
3. Results
3.1 Comparison of uptake of 18F-FDG and parenchymal density (edema) in the lungs following systemic administration of LPS (micro PET/CT)
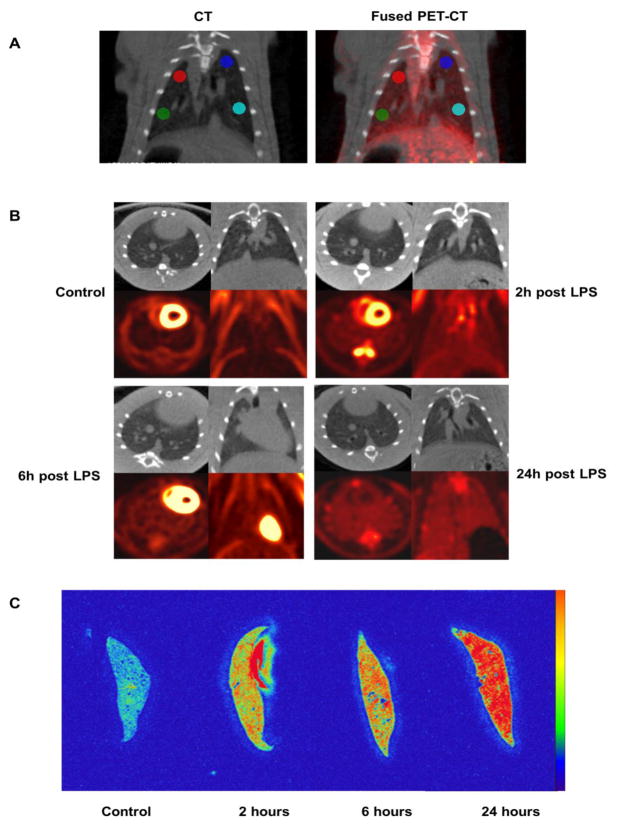
LPS was administered to rats intraperitoneally as a single high dose (10 mg/kg) that mimics the endotoxemia that accompanies gram-negative sepsis. This resulted in rapid and progressive uptake of 18F-FDG by the lungs. However, the development of pulmonary edema, as measured by increased lung parenchymal attenuation on CT (HU), was slower to occur and of lower magnitude. Results are summarized in Table 1 and representative microPET/CT scans and phosphor images are shown in Figure 1A and 1B. Compared to controls, the mean 18F-FDG uptake in the lungs of LPS rats was 1.70-fold greater at 2h (SE 0.14, p < .002), 2.31-fold greater at 6h (SE 0.38, p = 0.012), and 2.74-fold greater at 24h (SE 0.30, p < 0.002). There was no change in lung attenuation of LPS-treated rats, compared to controls, at 2h and 6h. At 24h, there was a small (mean 10%) but statistically significant (p = 0.043) increase in lung attenuation compared to controls.
Table 1.
18F-FDG uptake and CT lung attenuation (edema) in the lungs of control and LPS-treated rats. 18F-FDG activity between animals was normalized to dose injected and body weight.
| Control | 2h post LPS | 6h post LPS | 24h post LPS | |
|---|---|---|---|---|
| 18F-FDG Bq/ml mean | 28.78 | 49.00 | 66.34 | 78.80 |
| 18F-FDG Bq/ml +/− standard error | 1.47 | 3.91 | 10.84 | 10.26 |
| 18F-FDG LPS vs control, p | < 0.002 | 0.012 | < 0.002 | |
| CT Hounsfield units mean | −512.93 | −519.88 | −537.08 | −462.69 |
| CT Hounsfield units +/− standard error | 13.12 | 15.18 | 31.89 | 28.52 |
| CT Hounsfield units LPS vs control, p | 0.398 | 0.979 | 0.043 | |
| Number or rats, N | 5 | 6 | 6 | 6 |
Fig. 1.
Changes in uptake of 18F-FDG and lung attenuation (edema) in controls and 3 separate cohorts of rats receiving an intraperitoneal injection of LPS as a single high dose (10 mg/kg). The cohorts of rats were imaged at 2, 4, and 6 hours post LPS injection. (A) Placement method of regions of interest (example from a rat at 6h post injection of LPS). PET-CT images were first generated using attenuation-corrected PET images. The PET information was visually removed from coronal PET-CT images. A 10 px diameter circular (not volumetric) region of interest was placed in the upper and lower lung zones bilaterally on the CT image, avoiding major vascular structures. The PET information was then added back to the fused images to visually insure that the lower regions of interest had not been placed over the liver. Quantitative information was derived from the CT (HU) and PET images for the same regions. (B) Micro PET/CT images show a rapid and progressive uptake of 18F-FDG by the lungs. However, the development of pulmonary edema as measured by lung attenuation (HU), another hallmark of ALI, was slower to occur and of lower magnitude. Compared to controls, 18F-FDG uptake in the lungs of LPS rats was 1.70-fold greater at 2h (SE 0.38, p < .002), increasing to 2.74-fold by 24h (SE 0.30, p < 0.002). There was no change in lung attenuation of LPS rats at 2h and 6h but a small (mean 10%) but statistically significant (p = 0.043) increase in lung attenuation at 24h, compared to controls. (C). Representative ex-vivo digital phosphor images of lungs in control animals and those at 2, 6 and 24h following LPS administration, showing progressive uptake of 18F-FDG.
3.2 Neutrophil accumulation in the lungs in response to LPS endotoxemia (MPO assay)
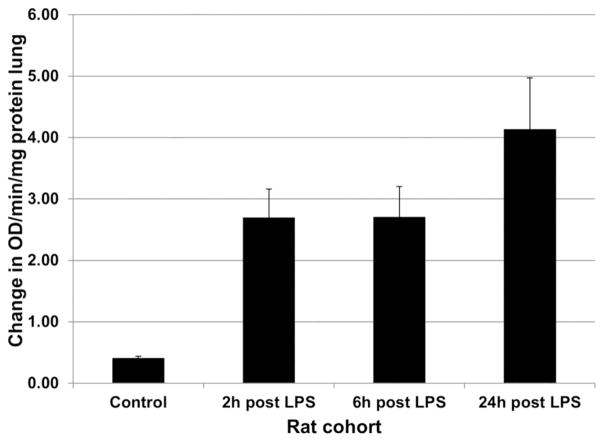
Increasing uptake of 18F-FDG following systemically administered LPS paralleled neutrophil localization in the lungs. The results are graphically shown in Figure 2. MPO activity in the lungs, as defined by the mean reaction slope (change in OD460/min/ug protein) was 0.41 (SE = 0.03) for control rats and 2.70 (SE = 0.46) at 2h post LPS administration, which represented a 6.58 increase over control values (p < 0.001). At 6h post LPS, the mean reaction slope was 2.71 (SE = 0.50), a difference of 6.61-fold over controls (p < 0.001). At 24h post LPS, the mean reaction slope was 4.14 (SE = 0.84), which represented a difference of 10.09-fold greater than control rats (p < 0.001).
Fig. 2.
Myeloperoxidase activity (neutrophils) in lung tissue of control and LPS-treated rats. Following IP administration of a single high dose of 10 mg/kg LPS, there was a rapid and progressive increase in neutrophil accumulation in the lungs. MPO activity in the lungs represented a 6.58 increase over control values at 2h (p < 0.001), a 6.61-fold over controls at 6h (p < 0.001), and a 10.09-fold over control rats at 24h (p < 0.001), differences that were statistically significant.
3.3 Accumulation of 14C-2DG by control and PAF-activated neutrophils
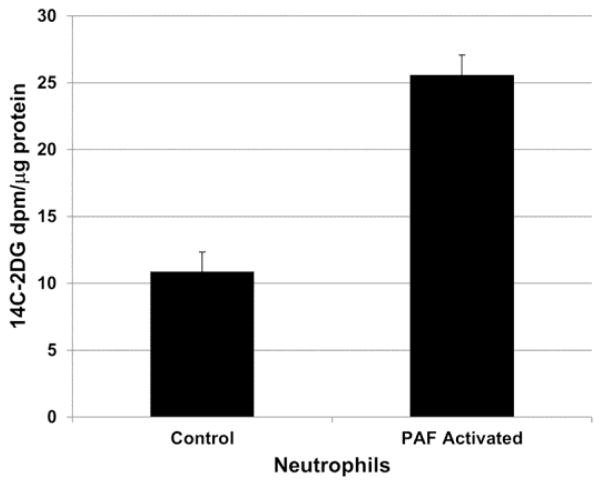
To interrogate the effect of neutrophil activation on uptake of 14C-2DG, normal human donor neutrophils were isolated and activated by incubation with PAF. Cellular uptake of 14C-2DG was measured in control neutrophils and was compared to those activated by 30 minutes of incubation with 10 nM PAF. As shown in Figure 3, PAF-stimulated neutrophils demonstrated a 2.35-fold increase in uptake of 14C-2DG compared to control neutrophils, a statistically significant difference (p < 0.001). Control neutrophils showed a mean uptake of 14C-2DG of 10.88 dpm/ug protein (SE = 1.47). PAF stimulated neutrophils demonstrated a mean uptake of 14C-2DG of 25.59 dpm/ug protein (SE = 1.48).
Fig. 3.
Uptake of 14C-2 deoxyglucose (2DG) by control and PAF-activate human donor neutrophils. Cellular uptake of 14C-2DG was measured in control neutrophils and was compared to those activated by 30 minutes of incubation with 10 nM PAF. PAF-stimulated neutrophils demonstrated a 2.35-fold increase in uptake of 14C-2DG compared to control neutrophils, a statistically significant difference (p < 0.001).
3.4 Expression of hexokinase (HK) isoforms by control and PAF activated neutrophils (western blot)
Hexokinase1 protein was increased in neutrophils following activation by 10 nM PAF at 37°C x 30 min. Western blot analysis of HK1, HK2, and HK3 isoforms was compared in mitochondrial containing (cytoplasmic) fractions in control and PAF-activated human donor neutrophils. As shown in a representative blot in Figure 4, PAF activated neutrophils showed a mean increase in expression of HK1 of 1.49-fold (SE < 0.09) over control neutrophils, a statistically significant difference (p < 0.001). For HK2 and HK3, there was no change in expression with PAF activation (data not shown).
Fig. 4.
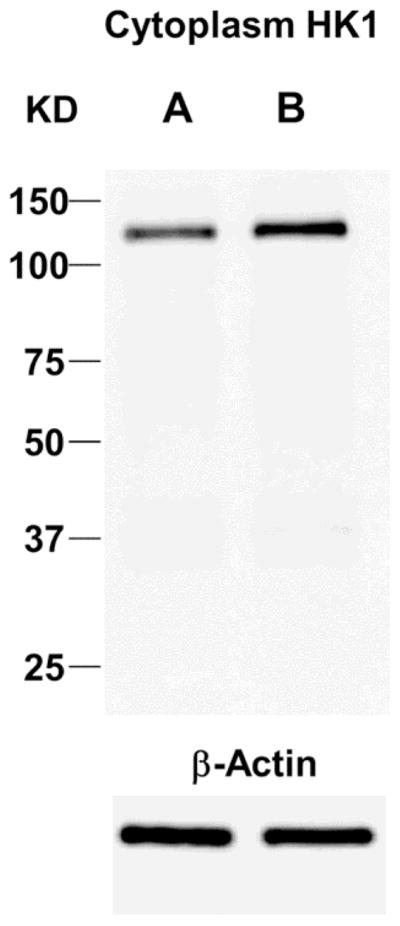
Representative western blot for HK1 protein expression in control (A) and PAF-activated (B) human donor neutrophils. Mitochondrial-containing/cytoplasmic fractions PAF activated neutrophils showed a mean increase in expression of HK1 in of 1.49-fold (SE = 0.09) over control neutrophils, a statistically significant difference (p < 0.001).
3.5 Expression of GLUT isoforms by cytosolic and membrane fractions in control and PAF activated neutrophils (western blot)
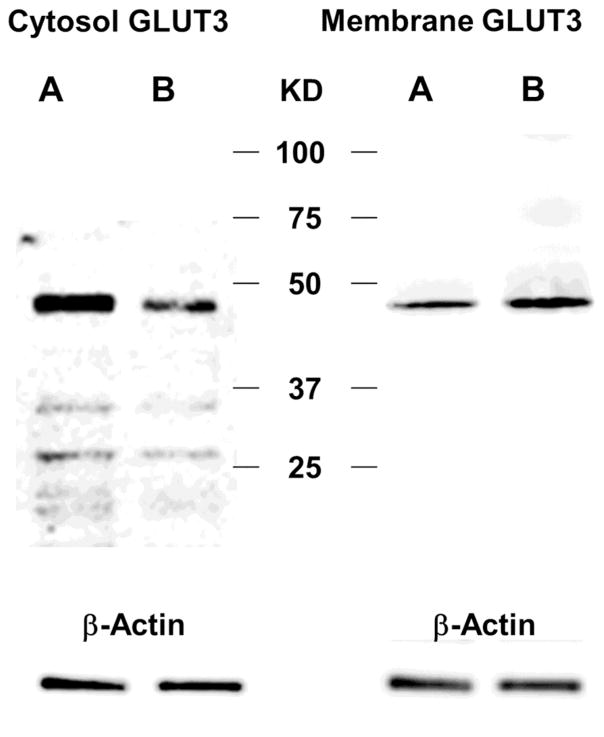
Western blot analysis was performed on both membrane and cytosolic fractions isolated human neutrophils to identify changes in location of expression of GLUT1, GLUT3, GLUT4 and GLUT6 protein levels between control neutrophils and those activated with 10 nM PAF at 37°C x 30 min. The membrane content of both GLUT3 and GLUT4 increased with PAF activation while cytosolic expression of the proteins decreased, compared to controls, suggesting translocation of internal pools from the cytosol to the membrane with activation. With activation, membrane fractions of neutrophils demonstrated a mean increase in GLUT3 protein of 2.37-fold (SE = 0.27) over control levels, a difference that was statistically significant (p < 0.001). Cytosolic levels of GLUT3 showed a mean decrease in expression with PAF activation of 0.51-fold (SE = 0.08) when compared to control levels, also a statistically significant difference (p < 0.001). A representative western blot of GLUT3 expression is shown in Figure 5. With PAF activation, membrane fractions of neutrophils also demonstrated a mean increase in GLUT4 of 1.94-fold (SE = 0.28) over control levels, a difference that was statistically significant (p < 0.01). Cytosolic levels of GLUT3 showed a mean decrease in expression with PAF activation of 0.63 fold (SE = 0.09) when compared to control levels, a statistically significant difference (p < 0.002). There was no change in either membrane or cytosolic expression of GLUT1 and GLUT6 with PAF activation (data not shown).
Fig. 5.
Representative western blots for GLUT3 protein expression in control (A) and PAF-activated (B) human donor neutrophils. Cytosolic levels of GLUT3 (left) showed a mean decrease in expression with PAF activation of 0.51-fold (SE = 0.075) when compared to control levels, a statistically significant difference (p < 0.0001). With PAF activation, membrane fractions (right) of human donor neutrophils demonstrated a mean increase in GLUT3 protein of 2.37-fold (SE = 0.27) over control levels, a difference that was statistically significant (p = 0.0003). This is consistent with translocation of GLUT3 receptors from the cytosol to the membrane with PAF activation.
3.6 Total cellular expression of GLUT 3 and 4 in control and activated neutrophils (flow cytometry)
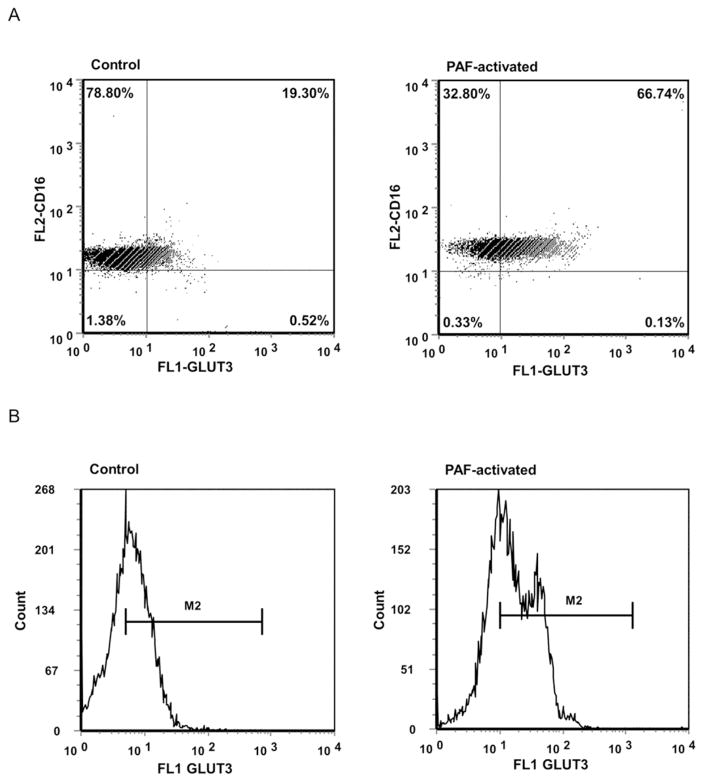
While western blot analysis showed a translocation of GLUT3 and GLUT4 from the cytosol to the cell membrane, flow cytometry also showed significant overall increases in intensity of cellular immunostaining for both GLUT3 and GLUT4 (greatest for GLUT3) with PAF activation of human donor neutrophils. Flow cytometry of control and PAF-activated human donor permeabilized neutrophils was performed using antibodies for GLUT3 or GLUT4, both co-immunostained for CD16. As illustrated in Figure 6, fluorescent intensity with PAF-activation for GLUT3 increased 2.51-fold over control levels: control mean = 5.15 a.u. (SE = 0.41), PAF mean = 12.91 a.u (SE = 0.65), with a difference that was statistically significant (p < 0.001). The percent of cells immunostaining strongly for both GLUT3 and CD16 increased 2.83-fold between control and PAF-activated donor neutrophils: control mean = 20.09% (SE = 2.23), PAF mean = 56.86% (SE = 2.92), a difference that was statistically significant (p < 0.001). PAF activation also increased immunofluorescent intensity for GLUT4 by 1.83-fold over control levels: control mean = 7.38 a.u. (SE = 0.35), PAF mean = 13.82 a.u, (SE = 0.76), with a difference that was statistically significant (p < 0.001). The percent of cells staining strongly with both GLUT4 and CD16 increased 1.90-fold between control and PAF-activated donor neutrophils: control mean = 33.82% (SE = 3.71), PAF mean = 64.20% (SE = 3.89), a difference that was also statistically significant (p < 0.001).
Fig. 6.
Total cellular expression of GLUT3 protein expression by PAF-activated and control human donor neutrophils: flow cytometry. Shown are dot blot (6A) and histograms (6B) profiles of the cells. The percent of neutrophils immunostaining strongly for both GLUT3 and CD16 increased 2.83-fold with PAF activation, a statistically significant difference (p < 0.001). The mean fluorescent intensity per cell also increased 2.51 fold with activation (p < 0.001).
3.7 Visualization of differences in GLUT3 expression and cellular morphology in control and PAF activated neutrophils (confocal microscopy)
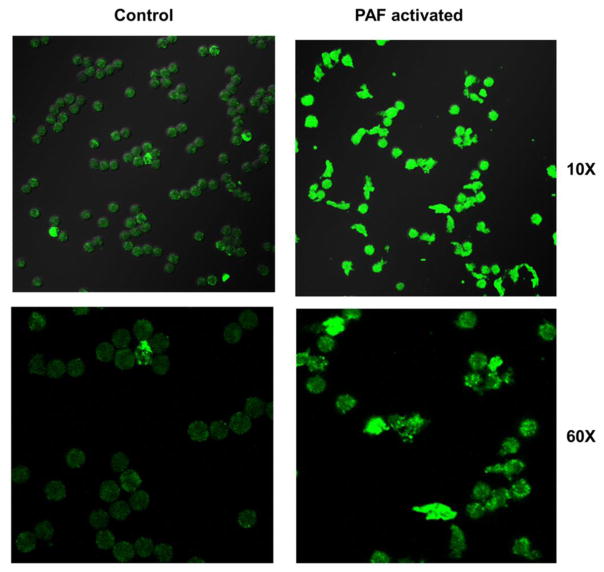
For GLUT3, the isoform showing greatest increase with PAF activation of neutrophils, confocal microscopy was also performed to compare morphological changes and GLUT3 expression following PAF activation. Human donor neutrophils became larger, more amoeboid (amorphous) in shape, and demonstrated increased immunostaining for GLUT3 with PAF activation. With PAF activation, the mean diameter of neutrophils was 22.92 um (SE = 7.35), while that of control neutrophils was smaller (mean = 18.57 um, SE = 5.43), a statistically significant difference (p < 0.002). Confocal microscopy also confirmed an increase in overall immunostaining for GLUT3 following PAF activation of neutrophils. With PAF activation, there was a 2.17-fold increase in cellular fluorescent GLUT3 immunostaining: controls mean = 14.89 a.u., (SE = 0.57), PAF mean = 32.35 a.u. (SE = 1.63), a statistically significant difference (p < 0.001). Representative confocal microscopy images for GLUT3 are shown in Figure 7.
Fig. 7.
Differences in conformation, size and expression of GLUT3 in PAF activated human donor neutrophils (confocal microscopy). Compared to control neutrophils (left), PAF activated human donor neutrophils (right) became larger, more amoeboid (amorphous) in shape, and demonstrated increased immunostaining for GLUT3 with PAF activation. With PAF activation, the mean diameter of a neutrophil was 1.23 fold larger than control cells (p < 0.002), and the cellular GLUT3 fluorescence was 2.17 fold greater, (p < 0.002), differences that were statistically significant.
3.8 GLUT3 transcriptional differences with PAF neutrophil activation (qPCR)
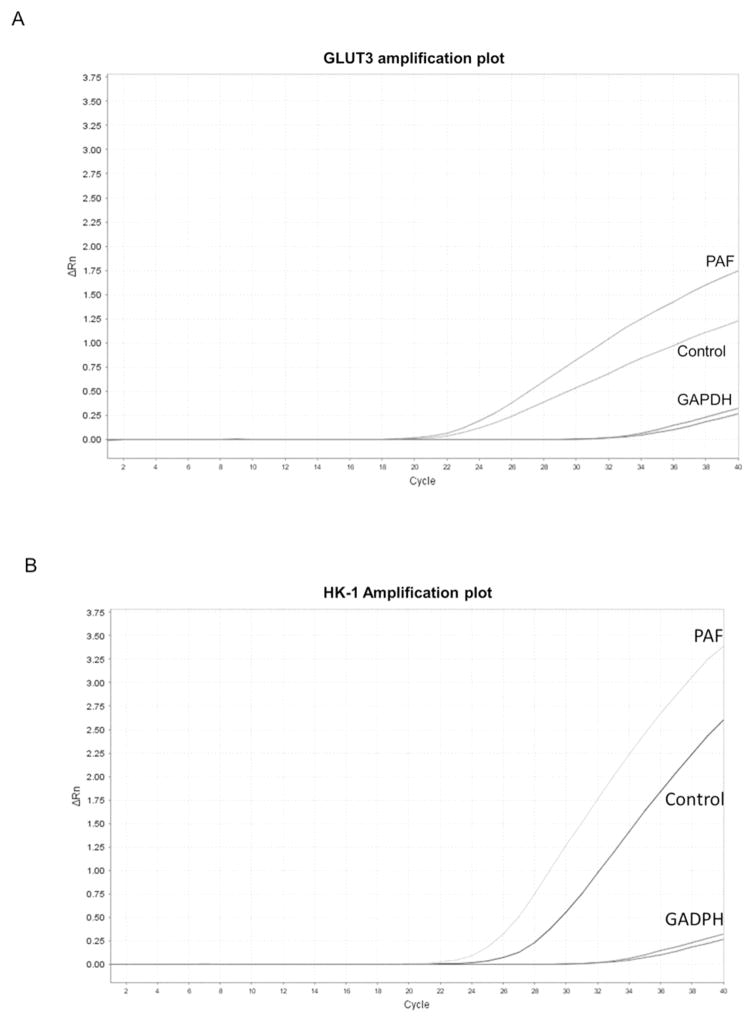
Transcriptional changes in HK1, as well as GLUT3, the GLUT isoform showing the greatest increase in protein by PAF stimulation, were measured by qPCR in control and PAF-activated human donor neutrophils. As shown in a representative amplification plot in Figure 8A, PAF activation of neutrophils resulted in a mean increase in GLUT3 mRNA transcription of 1.86-fold (SE = 0.35) over control levels, a statistically significant difference (p = 0.04). Transcriptional changes in HK 1 were also measured between control and PAF-activated neutrophils. As shown in a representative amplification plot in Figure 8B, HK1 mRNA was 1.63-fold higher (SE = 0.31) in activated neutrophils that control cells, although the difference did not quite achieve statistical significance (p = 0.07).
Fig. 8.
Transcriptional differences of HK1 and GLUT3 with PAF activation of human neutrophils (qPCR). (A). Representative amplification plot of GLUT3 transcription differences between control and PAF-activated human donor neutrophils. PAF activation of neutrophils resulted in a mean increase in GLUT3 mRNA transcription of 1.86-fold over control levels, a statistically significant difference (p = 0.04). (B). Representative amplification plot of HK1 transcription differences between control and PAF-activated human donor neutrophils. HK1 mRNA was 1.63-fold higher (SE = 0.31) in activated neutrophils that control cells, although the difference did not quite achieve statistical significance (p = 0.07). Amplification plots for GADPH, an endogenous reference gene, are included.
3.9 Changes in HK activity with PAF activation of neutrophils
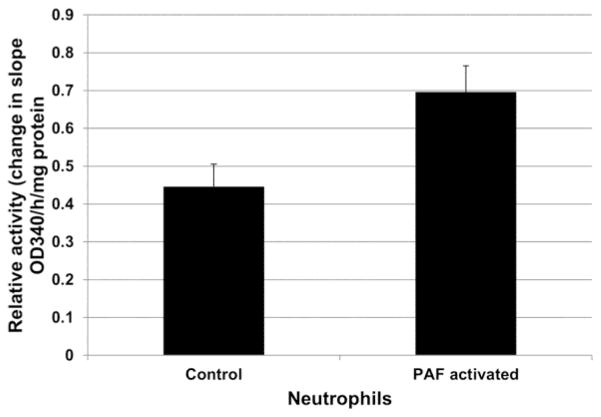
Hexokinase activity also increased PAF-activated human donor neutrophils (10 nM PAF at 37°C x 30 min), compared to controls. As shown in Figure 9, the mitochondrial containing fractions of activated cells demonstrated an average 1.60-fold increase in HK activities when compared to controls. Mean HK activity in control cells (change in slope of OD 340/h/mg protein) was 0.45 (SE = 0.06). The mean HK activity in PAF-activated neutrophils was 0.70 (SE = 0.07). The difference in HK activity between PAF-activated and control neutrophils was statistically significant (p < 0.05).
Fig. 9.
Hexokinase activity in control and PAF-activated human donor neutrophils. The mitochondrial containing fractions of activated cells demonstrated an average 1.60-fold increase in HK activities when compared to controls, a statistically significant difference (p = 0.033).
4. Discussion
There is substantial evidence that neutrophil activation and recruitment are among the earliest and most critical events in the development of ALI and ARDS and, as such, may represent one of the most direct and important targets of therapeutic intervention [1,25,31]. Methods to quantify early neutrophil activation and recruitment would be valuable in informing the development and efficacy of novel therapies. Lung uptake of 18F-FDG on PET is well recognized as a hallmark of ALI/ARDS [18,19,22,23]. 18F-FDG uptake by the lungs and has been shown to correlate with neutrophil influx into the lungs in a variety of experimental pulmonary inflammatory lesions [21,26,27,32,33]. Previously we demonstrated, in a small clinical series, that diffuse lung uptake of 18F-FDG PET was present 1–3 days prior to the point at which the clinical diagnostic criteria for ARDS were met [22]. Similar findings have been subsequently reported by others [23] and suggest that earlier identification of ARDS, or the subjects most vulnerable to the development of the syndrome, could be possible with 18F-FDG PET. However, validation of 18F-FDG PET as an early biomarker of the ALI/ARDS requires confirmation of the cellular and molecular events that associate 18F-FDG uptake with neutrophil activation and pulmonary recruitment early in the course of ALI. This is particularly necessary in the case of sepsis, where lung injury is the indirect consequence of systemic factors, rather than the result of direct pulmonary insults (such as inhalation of a toxin or pathogen, or of barotrauma). The focus of this study was to validate 18F-FDG PET as an early biomarker to ALI in a systemic endotoxin model and to compare the time course for 18F-FDG uptake in the lungs detected by PET with the development of lung injury and consequent edema, as defined by increased attenuation in the lungs by CT.
The current report complements the literature in a number of ways. First, it tracks the temporal changes, over 24h, in both FDG uptake and CT attenuation (development of pulmonary edema) in an experimental model of endotoxemia-induced lung injury, showing that pulmonary uptake of 18F-FDG is an earlier and more robust marker of LPS-induced ALI than is increased lung attenuation on CT. Diffuse increased uptake of 18F-FDG in the lungs occurs as early as 2h post LPS-injection, whereas measurable changes in CT attenuation by the lungs are not apparent until 24h. This supports the hypothesis that 18F-FDG PET may provide a very early and non-invasive biomarker of a pathophysiological state that contributes to ALI. The current report also confirms, by MPO assay, that neutrophil recruitment in the lungs is occurring during the same time-course as is 18F-FDG uptake. It should be noted that these findings do not exclude the possibility, as supported by others, that other inflammatory cells [34,35], cellular structures [36,37] or non-cellular mechanisms, such as accumulation in extravascular fluid [38], may also contribute to overall 18F-FDG uptake in lung injury.
We also delineate critical cellular and molecular changes that occur with experimental activation of human neutrophils by PAF that facilitate the uptake of 2DG. Although a variety of stimuli have been shown to result in neutrophil activation, including PAF, interleukin 8, formyl peptides, and LPS, PAF was chosen as the neutrophil activating stimulus because, pathophysiologically, it represents one of the earliest points of convergence of multiple inflammatory stimuli [28]. LPS stimulates production of PAF. As a G-protein coupled receptor ligand, PAF is part of the innate host defense-signaling cascade, resulting in multiple molecular and cellular inflammatory sequelae [41]. Dysregulated PAF activity in sepsis is well supported, contributes to the severity of the systemic septic syndrome, and has been the focus of a number of therapeutic strategies [40, 41]. PAF has also long been recognized to mediate LPS-induced mobilization and activation of neutrophils and endotoxin-induced lung injury [42,43,44].
With human neutrophil activation by PAF, two specific high affinity glucose transporters, GLUT3 and GLUT4, each undergo both an increase in total cellular content, as well as externalization of an internal pool of receptors with PAF-induced neutrophil activation. For GLUT3, the isoform showing greatest increased in expression with neutrophil activation, mRNA levels were also measured and were increased in PAF-activated neutrophils. (GLUT4 transcript levels were not measured.) Previous reports suggest that the GLUT4 transporter is insulin responsive [45]. However, no insulin was included in the incubation mixture for the experiments described in the current report, supporting that insulin-independent modulation of GLUT3 and GLUT4 may also occur with neutrophil activation. It should be noted that Schuster et al reported a translocation from cytoplasm to membrane of GLUT1 (without an increase in overall GLUT1 content), but no change in GLUT3 or GLUT4 with endotoxin activation of mouse neutrophils [46]. Therefore, species-specific differences in profiles of specific molecular determinants of glucose uptake with neutrophil activation may exist.
Cellular levels of hexokinase, which phosphorylates and traps 2DG analogs, were increased in PAF activated neutrophils. Hexokinase activity was also increased, due solely to the HK1 isoform. An increase in hexokinase mRNA in activated neutrophils was observed, with a trend toward statistical significance. This is finding is consistent with metabolic activation of neutrophils that accompanies other activation responses [33] and I8F-FDG uptake.
Increases in CT attenuation values in the lungs could theoretically increase quantitative or semi-quantitative measurements of FDG activity. However, we do not believe that attenuation correction errors contributed to any significant degree to increases in FDG uptake in the lungs of LPS-treated animals. Attenuation (HU) in the lungs did not increase over that of control rats despite an increase in FDG activity of 1.70 fold at 2h and a 2.31-fold increase at 6h post LPS. Furthermore, at 24h post LPS, the average attenuation in the lungs increased by less than 10% compared to average HU in control lungs, whereas the FDG activity increased by 274% (2.74 fold change). Differences in SUVmax within normal lung tissue between non-contrast-enhanced CT (NCCT) and contrast enhanced CT (CECT) have been published. In one report, the percent increase in SUVmax between NCCT and CECT ranged from 13.19%–15.23% (p< 0.001) [47]. In another report, the percent difference in SUVmax between NCCT and CECT was less than 0.01%, (not significantly different) [48]. In the later publication, the difference in lung attenuation between NCCT and CECT was reported to be 26.1%, which is considerably greater than the increase in attenuation observed in our series of rats 24h following LPS administration. Therefore, it is unlikely that the increases in FDG activity observed following LPS administration are due to attenuation correction error.
It has been previously suggested that some washout 18F-FDG from inflammatory tissues may occur at later time points due to glucose-6-phosphatase mediated dephosphorylation, which allows 18F-FDG to leave the cell (49). In these experiments, no sequential PET-CT acquisitions were performed following administration of 18F-FDG to measure washout of FDG by the lungs over time. Glucose-6-phosphatase levels were not measured in the neutrophils or lung tissues. All PET images were acquired 1 hour following intravenous injection of 18F-FDG. Future studies may be indicated to establish the optimal interval from injection of 18F FDG to PET-CT imaging for identification of acute lung injury.
Together, our results validate that 18F-FDG PET is a very early (as early as 2h) biomarker of neutrophil activation and of neutrophil recruitment in systemic endotoxin-induced ALI. Using micro18F-FDG PET/CT in the LPS-induced acute lung injury model, we have shown that the uptake of 18F-FDG occurs 22h prior to the development of CT evidence of acute pulmonary edema. Uptake of 14C-2-DG by activated neutrophils is associated with specific molecular and cellular events that control the transport and trapping of glucose analogs.
6. Conclusion
Systemic LPS endotoxin-induced ALI in the rat results in very early uptake of 18F-FDG, which precedes the development of increased attenuation of the lung parenchyma on CT. The increase in uptake of 18F-FDG detected by PET parallels neutrophil influx. Activated human neutrophils show increased uptake of 2DG analogs, altered expression of specific GLUT3, GLUT4 and HK1 proteins, and increased HK activity. These findings support the hypothesis that 18F-FDG PET may be a useful tool for the early diagnosis of ALI/ARDS prior to development of other radiographic features, and for noninvasive assessment of key inflammatory events in this common and lethal syndrome.
Acknowledgments
This work was partially supported by the National Center for Research Resources and the National Center for Advancing Translational Sciences, National Institutes of Health (NIH), through Grant 5UL1TR001067-02. Additional support was provided by the Center for Quantitative Cancer Imaging, Huntsman Cancer Institute, University of Utah. R.S.R. was supported by a Coordenacao de Aperfeicoamento de Pessoal de Nivel Superior (CAPES) fellowship and F.A.B. by a Conselho Nacional de Pesquisa (CNPq) fellowship. G.A.Z. was supported by NIH R37 HL044525 and U54 HL112311 and a Science Without Borders Professorship from CNPq. The authors declare no competing financial interests.
Footnotes
Publisher's Disclaimer: This is a PDF file of an unedited manuscript that has been accepted for publication. As a service to our customers we are providing this early version of the manuscript. The manuscript will undergo copyediting, typesetting, and review of the resulting proof before it is published in its final citable form. Please note that during the production process errors may be discovered which could affect the content, and all legal disclaimers that apply to the journal pertain.
References
- 1.Matthay MA, Ware LB, Zimmerman GA. The acute respiratory distress syndrome. J Clin Invest. 2012;122:2731–2740. doi: 10.1172/JCI60331. [DOI] [PMC free article] [PubMed] [Google Scholar]
- 2.Donahoe M. Acute respiratory distress syndrome: A clinical review. Pulm Circ. 2011;1:192–211. doi: 10.4103/2045-8932.83454. [DOI] [PMC free article] [PubMed] [Google Scholar]
- 3.Sagy M, Al-Qaqaa Y, Kim P. Definitions and pathophysiology of sepsis. Curr Probl Pediatr Adolesc Health Care. 2013;43:260–263. doi: 10.1016/j.cppeds.2013.10.001. [DOI] [PubMed] [Google Scholar]
- 4.Rubenfeld GD, Caldwell E, Peabody E, Weaver J, Martin DP, Neff M, et al. Incidence and outcomes of acute lung injury. N Engl J Med. 2005;353:1685–1693. doi: 10.1056/NEJMoa050333. [DOI] [PubMed] [Google Scholar]
- 5.Toner P, McAuley DF, Shyamsundar M. Aspirin as a potential treatment in sepsis or acute respiratory distress syndrome. Crit Care. 2015;19:374. doi: 10.1186/s13054-015-1091-6. [DOI] [PMC free article] [PubMed] [Google Scholar]
- 6.Lin X, Dean DA. Gene therapy for ALI/ARDS. Crit Care Clin. 2011;27:705– 718. doi: 10.1016/j.ccc.2011.04.002. Review. [DOI] [PMC free article] [PubMed] [Google Scholar]
- 7.Gotts JE, Matthay MA. Mesenchymal stem cells and acute lung injury. Crit Care Clin. 2011;27:719–733. doi: 10.1016/j.ccc.2011.04.004. [DOI] [PMC free article] [PubMed] [Google Scholar]
- 8.Walter J, Ware LB, Matthay MA. Mesenchymal stem cells: mechanisms of potential therapeutic benefit in ARDS and sepsis. Lancet Respir Med. 2014;2:1016–1026. doi: 10.1016/S2213-2600(14)70217-6. [DOI] [PubMed] [Google Scholar]
- 9.Bellani G, Amigoni M, Pesenti A. Positron emission tomography in ARDS: a new look at an old syndrome. Minerva Anestesiol. 77:439–447. 201. Review. [PubMed] [Google Scholar]
- 10.Chen DL, Schuster DP. Imaging pulmonary inflammation with positron emission tomography: a biomarker for drug development. Mol Pharm. 2006;3:488–495. doi: 10.1021/mp060050w. Review. [DOI] [PubMed] [Google Scholar]
- 11.Madsen PH, Hess S, Høilund-Carlsen PF, Alavi A. Positron emission tomography in chronic obstructive pulmonary disease. Hell J Nucl Med. 2013;16:121–124. Review. [PubMed] [Google Scholar]
- 12.Harris RS, Venegas JG, Wongviriyawong C, Winkler T, Kone M, Musch G, et al. 18F-FDG uptake rate is a biomarker of eosinophilic inflammation and airway response in asthma. J Nucl Med. 2011;52:1713–1720. doi: 10.2967/jnumed.110.086355. [DOI] [PMC free article] [PubMed] [Google Scholar]
- 13.Coleman MT, Chen RY, Lee M, Lin PL, Dodd LE, Maiello P, et al. PET/CT imaging reveals a therapeutic response to oxazolidinones in macaques and humans with tuberculosis. Sci Transl Med. 2014;6:265ra167. doi: 10.1126/scitranslmed.3009500. [DOI] [PMC free article] [PubMed] [Google Scholar]
- 14.Coleman MT, Maiello P, Tomko J, Frye LJ, Fillmore D, Janssen C, et al. Early Changes by (18)Fluorodeoxyglucose positron emission tomography coregistered with computed tomography predict outcome after Mycobacterium tuberculosis infection in cynomolgus macaques. Infect Immun. 2014;82:2400–2404. doi: 10.1128/IAI.01599-13. [DOI] [PMC free article] [PubMed] [Google Scholar]
- 15.Kono M, Yamashita H, Kubota K, Kano T, Mimori A. FDG PET Imaging in Pneumocystis Pneumonia. Clin Nucl Med. 2015;40:679–681. doi: 10.1097/RLU.0000000000000831. [DOI] [PubMed] [Google Scholar]
- 16.Bakheet SM, Saleem M, Powe J, Al-Amro A, Larsson SG, Mahassin Z. F-18 fluorodeoxyglucose chest uptake in lung inflammation and infection. Clin Nucl Med. 2000;25:273–278. doi: 10.1097/00003072-200004000-00007. [DOI] [PubMed] [Google Scholar]
- 17.Schuster DP, Kozlowski J, Hogue L. Imaging lung inflammation in a murine model of Pseudomonas infection: a positron emission tomography study. Exp Lung Res. 2003;29:45–57. doi: 10.1080/01902140303760. [DOI] [PubMed] [Google Scholar]
- 18.Jacene HA, Cohade C, Wahl RL. F-18 FDG PET/CT in acute respiratory distress syndrome: a case report. Clin Nucl Med. 2004;29:786–788. doi: 10.1097/00003072-200412000-00002. [DOI] [PubMed] [Google Scholar]
- 19.Bellani G, Amigoni M, Pesenti A. Positron emission tomography in ARDS: a new look at an old syndrome. Minerva Anestesiol. 2011;77:439–447. Review. [PubMed] [Google Scholar]
- 20.de Prost N, Tucci MR, Melo MF. Assessment of lung inflammation with 18F-FDG PET during acute lung injury. AJR Am J Roentgenol. 2010;195:292–300. doi: 10.2214/AJR.10.4499. Review. [DOI] [PMC free article] [PubMed] [Google Scholar]
- 21.Chen DL, Rosenbluth DB, Mintun MA, Schuster DP. FDG-PET imaging of pulmonary inflammation in healthy volunteers after airway instillation of endotoxin. J Appl Physiol (1985) 2006;100:1602–1609. doi: 10.1152/japplphysiol.01429.2005. [DOI] [PubMed] [Google Scholar]
- 22.Rodrigues RS, Miller PR, Bozza FA, Marchiori E, Zimmerman GA, Hoffman JM, et al. FDG-PET in patients at risk for acute respiratory distress syndrome: a preliminary report. Intensive Care Med. 2008;34:2273–2278. doi: 10.1007/s00134-008-1220-7. [DOI] [PubMed] [Google Scholar]
- 23.Bellani G, Messa C, Guerra L, Spagnolli E, Foti G, Patroniti N, et al. Lungs of patients with acute respiratory distress syndrome show diffuse inflammation in normally aerated regions: a [18F]-fluoro-2-deoxy-D-glucose PET/CT study. Crit Care Med. 2009;37:2216–2222. doi: 10.1097/CCM.0b013e3181aab31f. [DOI] [PubMed] [Google Scholar]
- 24.Chen DL, Bedient TJ, Kozlowski J, Rosenbluth DB, Isakow W, Ferkol TW, et al. [18F]fluorodeoxyglucose positron emission tomography for lung antiinflammatory response evaluation. Am J Respir Crit Care Med. 2009;180:533–539. doi: 10.1164/rccm.200904-0501OC. [DOI] [PMC free article] [PubMed] [Google Scholar]
- 25.Kangelaris KN, Prakash A, Liu KD, Aouizerat B, Woodruff PG, Erle DJ, et al. Increased expression of neutrophil-related genes in patients with early sepsis-induced ARDS. Am J Physiol Lung Cell Mol Physiol. 2015;308:L1102–1113. doi: 10.1152/ajplung.00380.2014. [DOI] [PMC free article] [PubMed] [Google Scholar]
- 26.Chen DL, Schuster DP. Positron emission tomography with [18F]fluorodeoxyglucose to evaluate neutrophil kinetics during acute lung injury. Am J Physiol Lung Cell Mol Physiol. 2004;286:L834–840. doi: 10.1152/ajplung.00339.2003. [DOI] [PubMed] [Google Scholar]
- 27.Zambelli V, Di Grigoli G, Scanziani M, Valtorta S, Amigoni M, Belloli S, et al. Time course of metabolic activity and cellular infiltration in a murine model of acid-induced lung injury. Intensive Care Med. 2012;38:694–701. doi: 10.1007/s00134-011-2456-1. [DOI] [PubMed] [Google Scholar]
- 28.Zimmerman GA, McIntyre TM, Prescott SM, Stafforini DM. The platelet-activating factor signaling system and its regulators in syndromes of inflammation and thrombosis. Crit Care Med. 2002;30:S294–301. doi: 10.1097/00003246-200205001-00020. Review. [DOI] [PubMed] [Google Scholar]
- 29.Goldblum SE, Wu KM, Jay M. Lung myeloperoxidase as a measure of pulmonary leukostasis in rabbits. J Appl Physiol (1985) 1985;59(6):1978–1985. doi: 10.1152/jappl.1985.59.6.1978. [DOI] [PubMed] [Google Scholar]
- 30.Scheer WD, Lehmann HP, Beeler MF. An improved assay for hexokinase activity in human tissue homogenates. Anal Biochem. 1978;91:451–63. doi: 10.1016/0003-2697(78)90531-6. [DOI] [PubMed] [Google Scholar]
- 31.Grommes J, Soehnlein O. Contribution of neutrophils to acute lung injury. Mol Med. 2011;17:293–307. doi: 10.2119/molmed.2010.00138. Review. [DOI] [PMC free article] [PubMed] [Google Scholar]
- 32.de Prost N, Feng Y, Wellman T, Tucci MR, Costa EL, Musch G, et al. 18F-FDG kinetics parameters depend on the mechanism of injury in early experimental acute respiratory distress syndrome. J Nucl Med. 2014;55:1871–1877. doi: 10.2967/jnumed.114.140962. [DOI] [PMC free article] [PubMed] [Google Scholar]
- 33.Musch G, Venegas JG, Bellani G, Winkler T, Schroeder T, Petersen B, et al. Regional gas exchange and cellular metabolic activity in ventilator-induced lung injury. Anesthesiology. 2007;106:723–735. doi: 10.1097/01.anes.0000264748.86145.ac. [DOI] [PubMed] [Google Scholar]
- 34.Paik JY, Lee KH, Choe YS, Choi Y, Kim BT. Augmented 18F-FDG uptake in activated monocytes occurs during the priming process and involves tyrosine kinases and protein kinase C. J Nucl Med. 2004;45:124–128. [PubMed] [Google Scholar]
- 35.Shozushima M, Tsutsumi R, Terasaki K, Sato S, Nakamura R, Sakamaki K. Augmentation effects of lymphocyte activation by antigen-presenting macrophages on FDG uptake. Ann Nucl Med. 2003;17:555–560. doi: 10.1007/BF03006668. [DOI] [PubMed] [Google Scholar]
- 36.Saha D, Takahashi K, de Prost N, Winkler T, Pinilla-Vera M, Baron RM, et al. Micro-autoradiographic assessment of cell types contributing to 2-deoxy-2-[(18)F]fluoro-D-glucose uptake during ventilator-induced and endotoxemic lung injury. Mol Imaging Biol. 2013;15:19–27. doi: 10.1007/s11307-012-0575-x. [DOI] [PMC free article] [PubMed] [Google Scholar]
- 37.Zhou Z, Kozlowski J, Goodrich AL, Markman N, Chen DL, Schuster DP. Molecular imaging of lung glucose uptake after endotoxin in mice. Am J Physiol Lung Cell Mol Physiol. 2005;289:L760–768. doi: 10.1152/ajplung.00146.2005. [DOI] [PubMed] [Google Scholar]
- 38.Dittrich AS, Winkler T, Wellman T, de Prost N, Musch G, Harris RS, et al. Modeling 18F-FDG kinetics during acute lung injury: experimental data and estimation errors. PLoS One. 2012;7:e47588. doi: 10.1371/journal.pone.0047588. [DOI] [PMC free article] [PubMed] [Google Scholar]
- 40.Horkheimer I, Schuster DP. The role of platelet-activating factor in sepsis: A bench-to-bedside review. Advances in Sepsis. 2002;2:2–7. [Google Scholar]
- 41.Yost CC, Weyrich AS, Zimmerman GA. The platelet activating factor (PAF) signaling cascade in systemic inflammatory responses. Biochimie. 2010;92:692–697. doi: 10.1016/j.biochi.2010.02.011. Review. [DOI] [PMC free article] [PubMed] [Google Scholar]
- 42.Miotla JM, Jeffery PK, Hellewell PG. Platelet-activating factor plays a pivotal role in the induction of experimental lung injury. Am J Respir Cell Mol Biol. 1998;18:197–204. doi: 10.1165/ajrcmb.18.2.2846. [DOI] [PubMed] [Google Scholar]
- 43.Bozza PT, Castro-Faria-Neto HC, Silva AR, Larangeira AP, Silva PM, Martins MA, et al. Lipopolysaccharide-induced pleural neutrophil accumulation depends on marrow neutrophils and platelet-activating factor. Eur J Pharmacol. 1994;270:143–149. doi: 10.1016/0926-6917(94)90056-6. [DOI] [PubMed] [Google Scholar]
- 44.Anderson BO, Poggetti RS, Shanley PF, Bensard DD, Pitman JM, Nelson DW, et al. Primed neutrophils injure rat lung through a platelet-activating factor-dependent mechanism. J Surg Res. 1991;50:510–514. doi: 10.1016/0022-4804(91)90033-i. [DOI] [PubMed] [Google Scholar]
- 45.Watson RT, Pessin JE. Intracellular organization of insulin signaling and GLUT4 translocation. Recent Prog Horm Re. 2001;56:175–193. doi: 10.1210/rp.56.1.175. Review. [DOI] [PubMed] [Google Scholar]
- 46.Schuster DP, Brody SL, Zhou Z, Bernstein M, Arch R, Link D, et al. Regulation of lipopolysaccharide-induced increases in neutrophil glucose uptake. Am J Physiol Lung Cell Mol Physiol. 2007;292:L845–851. doi: 10.1152/ajplung.00350.2006. [DOI] [PubMed] [Google Scholar]
- 47.An YS, Sheen SS, Oh YJ, Hwang SC, Yoon JK. Nonionic intravenous contrast agent does not cause clinically significant artifacts to 18F-FDG PET/CT in patients with lung cancer. Ann Nucl Med. 2007;21:585–592. doi: 10.1007/s12149-007-0066-3. [DOI] [PubMed] [Google Scholar]
- 48.Yau YY, Chan WS, Tam YM, Vernon P, Wong S, Coel M, Chu SK. Application of intravenous contrast in PET/CT: does it really introduce significant attenuation correction error? J Nucl Med. 2005;46:283–291. [PubMed] [Google Scholar]
- 49.Houshmand S, Salavati A, Segtnan EA, Grupe P, Høilund-Carlsen PF, Alavi A. Dual-time-point Imaging and delayed-time-point fluorodeoxyglucose-PET/computed tomography imaging in various clinical settings. PET Clin. 2016;11:65–84. doi: 10.1016/j.cpet.2015.07.003. [DOI] [PubMed] [Google Scholar]


