

Abstract
Purpose
Pituitary adenomas are the second most common primary brain tumor, yet their genetic profiles are incompletely understood.
Experimental Design
We performed whole-exome sequencing of 42 pituitary macroadenomas and matched normal DNA. These adenomas included hormonally active and inactive tumors, ones with typical or atypical histology, and ones that were primary or recurrent.
Results
We identified mutations, insertions/deletions, and copy number alterations. Nearly one-third of samples (29%) had chromosome arm-level copy-number alterations across large fractions of the genome. Despite such widespread genomic disruption, these tumors had few focal events, which is unusual among highly disrupted cancers. The other 71% of tumors formed a distinct molecular class, with somatic copy-number alterations involving less than 6% of the genome. Among the highly disrupted group, 75% were functional adenomas or atypical null-cell adenomas, whereas 87% of the less-disrupted group were nonfunctional adenomas. We confirmed this association between functional subtype and disruption in a validation dataset of 87 pituitary adenomas. Analysis of previously published expression data from an additional 50 adenomas showed that arm-level alterations significantly impacted transcript levels, and that the disrupted samples were characterized by expression changes associated with poor outcome in other cancers. Arm-level losses of chromosomes 1, 2, 11, and 18 were significantly recurrent. No significantly recurrent mutations were identified, suggesting no genes are altered by exonic mutations across large fractions of pituitary macroadenomas.
Conclusion
These data indicate that sporadic pituitary adenomas have distinct copy number profiles that associate with hormonal and histologic subtypes and influence gene expression.
Introduction
Pituitary adenomas are the second most common primary brain tumor, with a rising incidence in recent years, likely related to increased detection (1, 2). Although most pituitary adenomas are benign, they can confer considerable morbidity. A majority of these tumors are “functional,” and secrete excess levels of hormones that can produce debilitating endocrine syndromes. Tumors that produce growth hormone (GH) cause acromegaly, prolactin secreting tumors are associated with amenorrhea-galactorrhea, and those that produce adrenocorticotropic hormone (ACTH) cause Cushing’s disease. The result is often irreversible multi-system derangement and increased risk of premature mortality (3). In contrast, other pituitary tumors are “nonfunctional.” Although they do not secrete hormones, these tumors often compress adjacent neurovascular structures, leading to visual loss, pituitary dysfunction, and cranial neuropathies.
Pituitary tumors can often be treated by surgery alone, or, as in the case of prolactinomas and growth hormone producing adenomas, may be managed medically. Surgical resection carries risks, including spinal fluid leakage, meningitis, hypopituitarism, and diabetes insipidus, and up to 15% of benign adenomas will recur despite optimal treatment (3). In the recurrent setting, adjuvant medical treatments in functioning and non-functioning tumors are only variably effective in achieving durable tumor control. The efficacy of adjuvant radiotherapy for recurrent disease can be limited by the proximity of pituitary tumors to the optic nerves in some cases. Other difficult to manage subclasses of pituitary tumors include atypical adenomas, which are often more aggressive, and those that invade the neighboring cavernous sinuses. There are limited non-surgical adjuvant treatment options for clinically challenging pituitary tumors.
Elucidation of the biologic underpinnings for these tumors may expand diagnostic and therapeutic strategies in predicting and managing clinical behavior. Traditional histopathology suggests that pituitary adenomas arise from clonal proliferation, and molecular markers and X-chromosome inactivation are distributed homogeneously across specimens (4). Germline mutations in several genes have been identified in association with familial predispositions to developing pituitary adenomas. These include AIP, MEN1, CDKN1B, and PRKAR1A (5–8). Recently, somatic mutations in the deubiquitinase gene USP8 and a G-protein-coupled receptor GPR101 on a microduplicated region of Xq26.3 have been identified in Cushing’s disease and young-onset acromegaly, respectively, along with GNAS mutations in a subset of GH tumors (9–11). For the majority of pituitary tumors, however, genetic events that contribute to tumorigenesis remain unknown.
Here, we describe a comprehensive genomic characterization of the largest mixed cohort of pituitary macroadenomas to date, including hormonally active and atypical adenomas. Our findings indicate that somatic copy number alterations affecting whole chromosome arms are the most frequent somatic genetic events affecting pituitary tumors, that these alterations are concentrated among functional and atypical adenomas relative to their non-functioning and typical counterparts, and that no single gene is affected by exonic mutations across a large fraction of pituitary macroadenomas.
Materials and Methods
Sample selection and preparation
This study was reviewed and approved by the human subjects institutional review boards (IRBs) of the Dana-Farber/Brigham and Women’s Cancer Center (DF/BWCC), the Brigham and Women’s Hospital, and the Broad Institute. Written informed consent was obtained from all participants. Histopathologic diagnosis based on WHO criteria and tumor purity >80% was confirmed in all samples selected for study by two board-certified neuropathologists (S.S., M.A.). Tumors were classified by their immunohistochemical expression of hormones (null, prolactin, ACTH, GH, FSH/LH, and TSH) as well as by the associated serum levels of the corresponding hormone. Corticotroph, somatotroph (including plurihormonal cases), and lactotroph adenomas were considered functional in our analyses whereas gonadotroph and null cell adenomas were considered nonfunctional. We classified tumors as nonfunctional in cases where there was immunohistologic staining for one or more hormones, but serum levels remained normal and there were no clinical signs of endocrinopathy. DNA was extracted from fresh-frozen tissue shavings and paired blood buffy coat preparations using standard protocols (Qiagen, Valencia, CA) and quantified using the PicoGreen system (Invitrogen). The tumor-normal pairs for the discovery cohort were confirmed by mass spectrometric genotypying with an established 48-SNP panel (Sequenom, San Diego, CA) (12).
Whole-exome sequencing
42 pituitary adenomas underwent whole exome sequencing, along with DNA from matched normal blood, as previously described (13). DNA was sonicated to 250 bp fragments, size selected with Agencourt AMPure XP beads, and ligated to specific barcoded adaptors (Illumina TruSeq; Illumina Inc., San Diego, CA) for multiplexed analysis. Exome hybrid capture was performed using the Agilent SureSelect hybrid capture kit (Whole Exome_v4; Agilent Technologies, Santa Clara, CA) and sequenced on a HiSeq 2500 system (Illumina Inc., San Diego, CA). All samples achieved at least 80X coverage in exons (mean coverage = 108X).
Sequence data were aligned to the hg19 (b37) reference sequence using the Burrows-Wheeler Aligner (14). Sample reads were sorted, duplicate-marked, and indexed using SAMtools and Picard. Bias in base quality score assignments due to flowcell, lane, dinucleotide context and machine cycle were analyzed and recalibrated, and local realignment around insertions or deletions (indels) was achieved using the Genome Analysis Toolkit (GATK) (15, 16). All paired samples underwent quality control testing to ensure accuracy of tumor-normal pairs. All sequencing files are available for download from the European Genome-phenome Archive (EGA) under accession EGAS00001001714.
Genomic analyses
Somatic mutations, insertions, and deletions were detected using MuTect (17) and IndelLocator (18, 19). These were annotated to genes and compared to events in the Catalogue of Somatic Mutations in Cancer (COSMIC) using Oncotator and also verified through visualization in the Integrated Genome Viewer (IGV). Mutations with allelic fractions below 10%, as well as those likely due to alignment errors, were discarded after manual review. Significance of identified genetic alterations was assayed using MutSig.
To analyze somatic copy number alterations from whole exome data, we used ReCapseg, which assesses homologue-specific copy ratios (HSCRs) from segmental estimates of multipoint allelic copy-ratios at heterozygous loci incorporating the statistical phasing software (BEAGLE) and population haplotype panels (HAPMAP3) (20–22). Allele-specific somatic copy number alterations and tumor ploidy status were assessed with ABSOLUTE (22). For copy-number alteration significance analysis, segmented copy-number data were analyzed by GISTIC 2.0, which separately assesses the significance of recurrent focal and arm-level SCNAs by comparing their rates of alteration to the overall genome-wide alteration rate. In the case of arm-level events, it controls for the tendency for short arms to undergo more frequent alterations (23).
Rearrangement detection was performed using Breakpointer/dRanger (24), however, exome sequencing has little power to detect rearrangements, and none were observed.
Validation cohort copy number analysis
87 patients with pituitary adenoma underwent somatic mutation profiling of 300 canonical cancer-associated genes as part of the DF/BWCC PROFILE clinical research study. Copy number analysis was performed using one of two internally developed algorithms. Both algorithms, VisCapCancer and RobustCNV, calculate copy number using a normalized read depth of coverage against a panel of normal (non-cancer) samples. VisCapCancer compares the tumor sample coverage to a median value from the panel of normals. Circular binary segmentation (CBS) is used to segment the data; segments are called via strict thresholding; the algorithm is configurable for different tumor fractions. RobustCNV performs a robust linear regression against the panel of normals to calculate copy ratios. CBS is again used to segment the data and calling is performed based on the observed variance of the data points. Estimated copy number was calculated using the following published formula: CR = (TC/2)*P + (2/2)(1-P), where CR = median copy ratio for all intervals in a gene; TC = number of copies in the tumor sample; P = Purity (22). Coverage plots of sequence reads were individually inspected for all samples by two independent reviewers to confirm chromosome-level copy number variations. Chromosomal gain or loss was defined by a 0.5 or greater log-fold change. Samples with at least 2 arm-level gains or losses were scored as disrupted.
Fluorescence in-situ hybridization (FISH)
Four-micron tissue microarray (TMA) or whole tissue sections were mounted on standard glass slides and baked at 60°C for at least two hours, then de-paraffinized and digested using methods previously described (25). The following DNA probes were co-hybridized: CDK4 (labeled in red; Empire Genomics), which maps to 12q14.1; CEP2 (labeled in aqua; Empire Genomics); and, CEP12 (labeled in green; Abbott Molecular/Vysis, Inc.). Final probe concentrations and hybridization conditions followed manufacturer’s recommendations. Tissue sections and probes were co-denatured, hybridized at least 16 hrs at 37°C in a darkened humid chamber, washed in 2X SSC at 70°C for 10 min, rinsed in room temperature 2X SSC, and counterstained with DAPI (4′,6-diamidino-2-phenylindole, Abbott Molecular/Vysis, Inc.). Slides were imaged using an Olympus BX51 fluorescence microscope. Individual images were captured using an Applied Imaging system running CytoVision Genus version 3.9.
Gene expression analysis
GEO dataset GSE22812 was downloaded from the NCBI GEO database (26). Probes were collapsed to genes using CollapseDataset (27). Cytoband information was obtained from the GSEA c1 gene sets, and was used to group genes (28). Arm-level alterations reported in the original publication were tallied, and the nine unique alterations that occurred in at least three separate samples were analyzed. For each gene within the region of interest, we calculated the log2 fold change between the average gene expression value for samples with the alteration and those without. We then performed a single sample t-test to assess whether the distribution of log fold change values was significantly different from zero in the expected direction.
To infer CNAs from coordinated gene expression biases, the e-karyotyping protocol was applied to an additional three studies (GSE26966, GSE51618 and GSE46311) (29, 30). RMA5 normalized data were further processed using the R statistical software (http://www.r-project.org/), as following: probe sets were organized by their chromosomal location, and probe sets without annotated chromosomal location were removed. For genes with multiple probe sets, all the probe sets of the gene were averaged (as well as the chromosomal location), in order to obtain one intensity value per gene. Next, using a threshold expression value of 5.5, probe sets not expressed in > 20% of the samples within a batch were removed, and all probe sets were floored to the threshold level. Finally, the 10% of the probe sets with the most variable expression levels were excluded, to reduce expression noise.
For each study separately, the median expression of each gene across all tumor samples was subtracted from the expression value of that gene in each sample in order to obtain a comparative value. The data were processed using a comparative genomic hybridization (CGH) analysis software program, CGH-Explorer (http://heim.ifi.uio.no/bioinf/Projects/CGHExplorer/). Gene expression regional biases were detected using the program’s piecewise constant fit (PCF) algorithm, with the following set of parameters: Least allowed deviation = 0.15; Least allowed aberration size = 30; Winsorize at quantile = 0.001; Penalty = 12; Threshold = 0.01.
We used the Euclidian distance between samples as a proxy for their relatedness. The dist function in R was used to compute all pairwise distances. The aggregated distances between disrupted and quiet samples were then compared.
To calculate enrichment for the 70 genes previously associated with genomic instability, we computed z-scores for each gene across all functional samples (31). We performed a Wilcox log rank test to determine whether the sum of gene expression z-score values was significantly elevated in disrupted tumors.
Results
We performed whole-exome sequencing on tumors and paired blood from 42 pituitary macroadenomas from 41 patients to a mean depth of coverage of 108X. To interrogate the heterogeneity intrinsic to pituitary adenomas, we analyzed a cohort that included a spectrum of histopathologic subtypes, de novo and recurrent tumors, and ones with wide-ranging MIB-1 proliferative indices (Supplementary Table 1). Null cell adenomas comprised 62% (26/42) of the cohort, followed by ACTH- and GH-expressing tumors (12% each), and tumors expressing FSH/LH (7%) and prolactin (7%). This represents a larger fraction of null-cell adenomas than observed in the population, in part because of the macroadenoma bias in this cohort. We characterized somatic copy-number alterations (SCNAs), mutations, insertions, and deletions across the genome.
Somatic copy number analysis reveals two distinct subsets of pituitary adenomas
We first evaluated SCNAs and found two classes of pituitary tumors based upon the fraction of the genome disrupted (Fig. 1A–B). The first class, comprising thirty tumors (71%), had SCNAs involving less than 6% of the genome (mean 0.5%). The second class, composed of the remaining twelve tumors (29%), exhibited much greater levels of genomic disruption, with up to 99% of the genome involved (mean 39%). The disruption in these samples was almost entirely due to arm-level SCNAs of at least half a chromosome arm. We detected at most 1% of the genome involved in more focal SCNAs.
Figure 1.

Genomic disruption in pituitary adenomas. (A) Heatmap of copy-number alterations spanning the genome (y-axis) across 42 pituitary adenomas (x-axis). Features associated with each sample are indicated along the top. (B) Histogram of fraction of genome disrupted across these pituitary tumors. The red line indicates the threshold we use to distinguish the class of tumors with minimal to no genome disruption from those with extensive disruption. (C) Differences in fraction of genome disrupted between functional (ACTH, GH, PRL-expressing) and typical and atypical nonfunctional pituitary adenomas. * indicates p<0.05.
Levels of genomic disruption were associated with tumor phenotype (Fig. 1C). Among the less disrupted group, 87% (26/30) were clinically nonfunctional adenomas; 75% (9/12) of the disrupted group were clinically functional adenomas (6/12) or atypical null-cell adenomas (3/12) (p<0.001). The genomically disrupted class trended towards higher MIB-1 proliferative indices (p=0.06).
To validate our findings, we analyzed an independent cohort of 87 pituitary adenomas with molecular profiling (Supplementary Table 2). We found that 31% (27/87) of these tumors exhibited genomic disruption. These included 52% (16/31) of the functional and atypical tumors but only 20% (11/56) of the nonfunctional group (p=0.003).
The propensity of the tumors exhibiting widespread genomic disruption by arm-level events to have few focal events is rare among tumor types. We compared rates of arm-level and focal genomic disruption between the pituitary tumors in our discovery cohort and 12 cancer types, including 11 that had been profiled by TCGA (32), along with a cohort of high-grade meningiomas which we had analyzed separately (Bi et al., manuscript in preparation) (Fig. 2A). Rates of arm-level alteration among genomically quiet pituitary tumors were markedly lower than all the other cancer types; in comparison, the class of genomically disrupted pituitary tumors harbored greater levels of genome disruption than almost all the other cancer types, comparable only to squamous cell lung and ovarian cancer. Conversely, rates of focal alteration across even the highly disrupted pituitary tumors were 95% lower than the average rate of focal disruption among the other 12 cancer types (Fig. 2B). It is possible that some of this discrepancy is due to differences in experimental technique (the TCGA samples were profiled by SNP arrays). However, the meningiomas were profiled using the same experimental techniques as the pituitary tumors and exhibited much higher levels of focal disruption in the setting of similar levels of arm-level disruption.
Figure 2.

Genome disruption across cancers. (A) Extent of genomic disruption (y-axis) among minimally- and extensively-disrupted pituitary tumors (Pit_quiet and Pit_disrupted, respectively) and 12 other tumor types (x-axis). (B) Ratio between the fraction of the genome disrupted by focal copy-number alterations (involving less than half a chromosome arm) and the fraction disrupted by larger (arm-level) events (y-axis) across these same tumor types. Samples with ratios greater than two, typically resulting from lack of arm-level events and including all Pit_quiet samples, are not shown. Each dot indicates a single tumor; bars and whiskers indicate means and standard errors of the mean (SEMs). AML, acute myeloid leukemia; GBM, glioblastoma multiform; hg Meningioma, high grade meningioma; Lung sc, lung squamous cell.
Among the 12 highly disrupted pituitary tumors in our discovery cohort, five (40%) exhibited patterns consistent with whole-genome doubling and one appeared to be haploid (Fig. 3A–B). We imputed whole-genome doubling using previously published methods that consider absolute allelic copy-numbers genome-wide (22). The finding that 40% of these highly disrupted tumors exhibit signs of whole-genome doubling is in line with other disrupted tumor types such as head and neck squamous cell cancers, breast cancers, and colorectal cancers (32).
Figure 3.

Copy number alterations in pituitary tumors. Genome-wide profile of homologous copy ratios in 3 samples of pituitary adenoma processed using ABSOLUTE, demonstrating a (A) tetraploid (genome-doubled) and (B) haploid state. Color scheme indicates low (blue), high (red), and balanced (purple) levels of alleles, with homologous copy ratio histogram to the right of the plot. (C) Significance (as False Discovery Rate q-values; x-axis) of chromosomal gains (right, red) and losses (left, blue) across the genome (y-axis) among 41 pituitary adenomas from unique patients. The dotted line indicates q=0.1. (D) Copy neutral loss of heterozygosity (LOH) of chromosome 11 was also observed in an otherwise genomically quiet tumor, as illustrated by allelic copy number analysis.
Pituitary adenomas harbor recurrent copy-number alterations
The most significantly recurrent SCNAs were losses of chromosomes 1p and 11, followed by losses of chromosomes 1q, 2, and 18. We also observed less frequent alterations of chromosomes 4, 7, 10, 14, and 15 (Fig. 3C). No gains or focal events reached our significance threshold. Chromosome 1p was lost in 11 of 42 cases (26%) and chromosome 11 was lost in 9 of 42 cases (21%), with co-occurrence in 7 cases. We also observed copy-neutral loss of heterozygosity (LOH) of chromosome 11q in two cases (Fig. 3D).
All tumors with whole-genome doubling exhibited copy-loss of chromosome 1 (p=0.0006). All tumors with chromosome 1p deletion also harbored other broad SCNAs. Both chromosome 1p and 11 losses were associated with hormonally active and atypical adenomas (p=0.003 and 0.004, respectively).
Chromosome 11 losses have been implicated in pituitary tumorigenesis in familial pituitary adenoma syndromes in which MEN1 or AIP, tumor suppressors on chromosome 11q, are mutated in germline DNA. Loss of chromosome 11 thus leads to biallelic inactivation of the multiple endocrine neoplasia I (MEN1) or aryl hydrocarbon receptor interacting protein (AIP) genes. However, among our cohort of sporadic adenomas, we did not observe any non-synonymous somatic MEN1 or AIP mutations. The data therefore do not support a genetic mechanism for biallelic inactivation of MEN1 or AIP; however, this does not exclude epigenetic loss of tumor suppressor expression or function.
We observed chromosome 12 gains in 5 tumors. A prominent amplified oncogene on chromosome 12 is CDK4 (33), and CDK4 mutations have been associated with pituitary tumors in mouse models (34). We therefore performed fluorescence in-situ hybridization (FISH) for CDK4 and for the centromeres of chromosomes 12 and 2 (cen12 and cen2, respectively) across 37 pituitary adenomas, including four tumors with exome data indicating chromosome 12 amplification. In all four cases, we observed that both cen12 and CDK4 were present at greater than 2 copies, and in greater numbers than cen2, validating the arm-level gains of 12q observed in the exome data (Fig. 4). We also observed apparent gains of CDK4 (in two cases extending to cen2) in an additional three of the 33 tumors without exome data. We saw no convincing evidence of focal high-level amplifications of CDK4 in any tumor.
Figure 4.
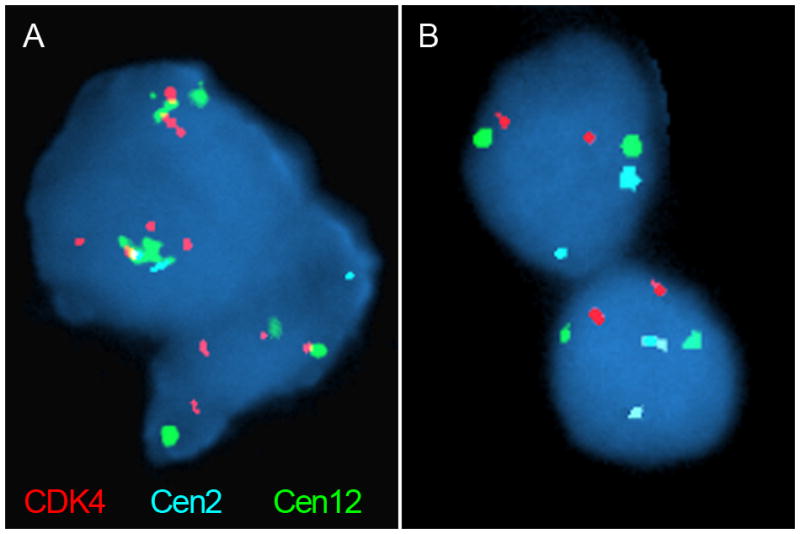
Fluorescence in situ hybridization using probes to CDK4 (red) and the centromeres of chromosomes 2 and 12 (cen2 and cen12; aqua and green, respectively). (A) A pituitary tumor with chromosome 12 gains, as indicated by greater staining of CDK4 and cen12 relative to cen2. (B) A tumor sample without chromosome 12 gains, as indicated by equal staining of all probes.
Copy number alterations in pituitary tumors influence transcript-level gene expression
Previous work across a number of different tumor types has shown that changes in copy number often influence gene expression (35, 36). However, this has not been systematically assayed in pituitary adenomas. We aggregated previously published gene expression data from four studies, representing 50 unique adenomas (29 functional, 21 nonfunctional), to assess the impact of SCNAs on expression levels (37–40). We initially focused our efforts on 13 samples with paired copy number and expression data. Among these, nine arm-level SCNAs were observed in at least three samples, and eight of these events were associated with a significant change in expression of genes located on the chromosome arm (p<0.002 for each; Supplementary Table 3).
We used the expression data from the 37 pituitary adenomas without copy number data to impute copy number alterations genome-wide and combined this with the data from the 13 tumors that did have paired copy-number calls. We found that 59% (17/29) of functional adenomas exhibited genomic disruption, compared to 5% (1/21) of nonfunctional adenomas (p=0.0001), confirming the association between functional subclass and disruption that we had observed in our DNA sequencing datasets (Supplementary Fig. 1A–B and Supplementary Table 4).
The differences in transcriptomic profiles between disrupted and quiet tumors extend beyond the genes involved in SCNAs themselves. First, disrupted tumors demonstrated increased variability in gene expression profiles. We compared expression profiles within both quiet and disrupted tumors. The magnitude of the difference between disrupted tumors was significantly larger than the magnitude of difference between quiet tumors (p<2×10⁻¹²; Fig. 5). These findings suggest that the biological mechanisms that result in unstable genomes also produce divergent transcriptomes.
Figure 5.

Magnitude of differences (y-axis) within expression profiles from disrupted and quiet tumors (x-axis) (38, 40).
Second, we found that the disrupted tumors shared a transcriptomic signature relative to quiet tumors. We focused on a panel of 70 genes across 18 chromosomes that have previously been associated with chromosomal instability (Supplementary Table 5A) (31). We found that the 17 tumors with genomic disruption had significantly higher expression levels of these 70 genes compared to quiet tumors (p=0.01, Supplementary Table 5B). Enrichment of this signature was associated with poor outcomes across a variety of cancer types (31); its potential as a prognostic indicator in pituitary tumors merits further study.
Pituitary adenomas harbor few recurrent mutations
We identified a median of 0.6 mutations per coding Mb (range 0.14–4.42), for a median of 12.5 nonsynonymous mutations per sample. The burden of genetic alterations was similar to craniopharyngiomas, adrenal corticoid tumors, and grade I meningiomas, and much smaller than that seen in head and neck squamous cell carcinomas and melanomas (Fig. 6A) (13, 41). The average burden of somatic mutations did not differ significantly between the samples classified as having low or high levels of SCNA disruption (p = 0.68).
Figure 6.

Characteristics of mutations in pituitary adenomas. (A) Mutation rates (y-axis) across pituitary-related and unrelated neoplasms (x-axis). (B) Power to detect mutations as recurrent in our cohort (y-axis) as a function of the fraction of pituitary adenomas that harbor the mutation (x-axis).
We found no significantly recurrent somatic mutations. Six genes exhibited mutations or insertions/deletions in more than one sample (ATAD3B, BHLHE22, KDM2B, OR5M1, TTN, and VPS13B; Supplementary Table 6), and of those, only TTN was mutated in more than two. Among these six genes, two (OR5M1, TTN) frequently exhibit non-driver mutations in other cancer types. Both genes have low expression levels and are replicated late in mitosis. These features are known to correlate with high mutation rates, suggesting mutations in these genes may be mechanistically favored rather than selected (42). ATAD3B encodes a mitochondrial ATPase essential for embryonic development, which has been implicated in control of proliferation in cancer cell line models (43). The CNS-specific transcription factor BHLHE22 contributes to cell fate determination and proliferation, although its role in oncogenesis remains to be established (44, 45). VPS13B is a membrane transport protein that has been reported to be recurrently mutated in small cell lung cancer and colorectal cancer (46).
The chromatin modifier KDM2B was mutated in two samples. KDM2B has been reported to be required for cancer stem cell renewal and knockdown in breast cancer models reduces proliferation by inducing senescence and apoptosis (47). Increasing levels of KDM2B in human pancreatic cancer correlated with disease progression (48). We also observed isolated mutations in other chromatin modifiers (DKM2B, DKM6B, and ARID4A). Of note, we did not observe somatic mutations in AIP, MEN1, GNAS, and USP8 in this cohort, which is likely related to sample selection.
The finding that only TTN exhibited mutations in more than two samples indicates that no driver genes are likely affected by nonsynonymous mutations in >15% of pituitary tumors. We calculated the power to detect at least three mutations in a given gene across a cohort of 41 patients (Fig. 6B). Our cohort achieved 95% power to detect genes mutated in 15% of patients, 80% power to detect genes mutated in 10% of patients, and 50% power to detect genes mutated in 6.5% of patients. Considering only those tumors with nonfunctional status (n=29), we had 95% power to detect genes mutated in 21% of patients and 80% power to detect genes mutated in 15% of patients.
Discussion
We performed the largest genomic analysis to date of a diverse cohort of 178 pituitary adenomas, including 42 adenomas profiled by whole-exome sequencing, 87 by targeted sequencing, and 50 with previously published expression data. We identified the degree of genomic disruption as a key differentiator between two subtypes, and were able to correlate disruption with phenotypic subtypes. Our classification was robust across platforms, correlated with changes in transcript levels, and was associated with a gene expression signature of aneuploidy. We found that arm level losses of chromosome 1p and 11 were the most common somatic alterations in the cohort, but that focal amplifications or deletions were largely absent. Despite our large cohort, we found no significantly recurrent alterations in any gene and did not detect more than three mutations in any gene.
Molecular stratification based on extent of genomic alterations has been reported in multiple tumors, including meningiomas, adrenal carcinomas, ependymomas, medulloblastomas, and endometrial and prostate cancers, with correlation to clinical outcome (49–54). Classical cytogenetic studies have demonstrated differences in degree of chromosomal alterations among pituitary adenomas, but the results are inconsistent (55, 56).
We report here two distinct molecular classes of sporadic pituitary adenomas stratified by copy number aberrations. Our analysis is the first to link level of disruption with functional subtype, likely because of the substantial power of our cohort to detect such associations. The first class is composed of highly genomically disrupted pituitary tumors, which are most often functional or atypical adenomas, and frequently harbored losses of chromosomes 1p or 11. Additionally, half of the tumors in this class were non-diploid (5 tetraploid, 1 triploid). The second class is composed of genomically quiet tumors with rare copy number gains or losses. The correlation of genomic disruption with functional status could indicate differing mechanisms of tumorigenesis between these two classes; the causes and consequences of this stratification are not clear. Interestingly, three of four “silent ACTH” tumors in our cohort were disrupted. This subset of ACTH-expressing tumors does not lead to Cushing’s disease and hence, are not considered “functional” but are historically aggressive. This finding highlights the role that genomic disruption may play in the behavior of tumors where hormone levels are not pathologically elevated. Long-term longitudinal studies with larger cohorts will be necessary to determine whether genomic disruption in pituitary tumors correlates with progression-free survival or other clinical features.
We analyzed previously published expression data to assess the robustness of these molecular subclasses. We confirmed a significant enrichment for disrupted tumors among functional adenomas using inferred copy number changes, and found that these tumors were enriched in a gene expression signature that has been shown to correlate with poor outcomes in other tumor types (31). Longitudinal studies have demonstrated that functional adenomas are more likely to recur than nonfunctional adenomas (3). The biological basis of this difference has remained largely unexplained.
Previous work has found a variety of differences in expression patterns between functional and nonfunctional adenomas. A recent study found that GH-secreting adenomas demonstrated significant upregulation of hedgehog pathway members (57), and a number of cancer-associated genes have been found to be upregulated in specific hormonal subtypes of adenomas (58, 59). However, none of these differences has been associated with outcomes, and none was observed across all subtypes of functioning adenomas. Our finding that genomically disrupted adenomas, which are more frequently functional, are enriched for a signature that correlates with poor outcomes in other tumor types may help to explain part of this difference in recurrence rates.
Of note, across the 178 samples analyzed in this study, 58% of functional adenomas were disrupted, suggesting that additional factors aside from genomic disruption contribute to the biology of hormone-secreting tumors. Further investigation will be necessary to determine the potential clinical relevance of genomic disruption as a criterion for patient stratification.
Alterations of chromosome 11q have been extensively investigated in pituitary tumors because of the identification of a broad spectrum of mutations in MEN1 and AIP, both located on chromosome 11q. Furthermore, 30% of sporadic pituitary adenomas exhibit loss of heterozygosity (LOH) involving chromosome 11q13, a further indication of the important role this region likely plays in pituitary tumorigenesis. In our cohort, loss of heterozygosity of chromosome 11, either through copy-loss or acquired uniparental disomy, was one of the two most frequent genomic abnormalities observed, but no somatic mutations in MEN1 or AIP were noted.
In a mouse model, expression of mutant CDK4 contributed to pituitary tumorigenesis (34). Copy number gain of chromosome 12 as noted from whole-exome sequencing, as well as focal relative gain of CDK4 as verified by FISH, was a frequent event across the cohort, occurring in 21% of samples, with high overlap with concurrent chromosome 11 loss. However, the chromosome 12 gains were large, making it difficult to attribute the gain of any one specific gene to tumorigenesis.
We observed very low rates of focal amplification and deletion in our cohort despite frequent arm-level gains and losses. Chromosome arm-level events generally result from errors in mitosis, specifically missegregation during anaphase at the level of centromeres (60). In contrast, there are a variety of mechanisms that can produce focal CNAs (61), such as homologous repair (HR) of double-strand breaks (DSBs) via the canonical Holliday junction, or break-induced repair (BIR), as well as non-homologous end joining (NHEJ). Our data suggest that pituitary tumors tend to suffer frequent missegregation events, but rarely undergo double-strand break and misrepair. Further investigation of the specific mechanisms responsible for the preponderance of large-scale genomic events will be necessary to elucidate the biology driving this bias, as well as to discover any tumor-specific vulnerabilities that may arise as a result.
We found no significantly recurrent mutations in this cohort. Our power to detect such mutations was strong, making it unlikely that a single driver gene is mutated in a substantial fraction of all pituitary tumors. However, our power to detect subtype-specific mutations was more limited due to the relatively small number of each subtype profiled. It is likely that there are driver events that are not shared among subtypes, and that there is substantial genetic diversity in pituitary tumor driver events, both with potentially important translational implications. Alternatively, it may be that balanced translocations, intergenic and intronic mutations, epigenetic alterations, or the presence of nucleic acids from oncogenic pathogens are responsible for pituitary tumorigenesis, as these are not well-assessed by the exome sequencing strategy pursued in this study. Whole genome sequencing and epigenetic profiling, including deeper analyses of individual subtypes, on larger cohorts of pituitary tumors may further elucidate the prevalence and impact of alternative oncogenic events.
Supplementary Material
Translational Relevance.
Molecular stratification has allowed clinicians to make more informed decisions about the relative risks and benefits of surgery, radiation, and targeted therapies in a variety of cancers. We demonstrate a statistically significant association between genetic determinants (degree of chromosomal disruption) and the corresponding phenotype (functional adenomas) in pituitary tumors. We validated this association between genomic disruption and functional subtype in two additional sample sets, and found that these alterations also affect gene expression levels. We observed no significantly recurrent mutations across this cohort of macroadenomas, suggesting that a single driver gene is unlikely to be mutated in a substantial fraction of pituitary macroadenomas and by extension, that no single targeted therapy is likely to be effective against large fractions of pituitary tumors. Our data enables a more systematic, genetic basis for the classification and treatment of pituitary tumors.
Acknowledgments
Financial support: Brain Science Foundation (I.F. Dunn), Sontag Foundation (R. Beroukhim), Voices Against Brain Cancer (R. Beroukhim), Gray Matters Brain Cancer Foundation (R. Beroukhim)
We are grateful to Marian Slaney and Sebastian Valentino for histopathologic assistance; the Center for Cancer Genome Discovery and Broad Institute for sequencing support; Sherry Iuliano and Bob Wiemann for patient identification. We are also grateful to the Brain Science Foundation, Voices Against Brain Cancer Foundation, Gray Matters Brain Cancer Foundation, and the Sontag Foundation for funding support.
Footnotes
Disclosures: RB is a consultant for Novartis; PKB is a consultant for Genentech and Merck; MA is a co-founder of CI Diagnostics
References
- 1.Gittleman H, Ostrom QT, Farah PD, Ondracek A, Chen Y, Wolinsky Y, et al. Descriptive epidemiology of pituitary tumors in the United States, 2004–2009. J Neurosurg. 2014:1–9. doi: 10.3171/2014.5.JNS131819. [DOI] [PubMed] [Google Scholar]
- 2.Ostrom QT, Gittleman H, Fulop J, Liu M, Blanda R, Kromer C, et al. CBTRUS Statistical Report: Primary Brain and Central Nervous System Tumors Diagnosed in the United States in 2008–2012. Neuro-oncology. 2015;17(Suppl 4):iv1–iv62. doi: 10.1093/neuonc/nov189. [DOI] [PMC free article] [PubMed] [Google Scholar]
- 3.Jane JA, Jr, Laws ER., Jr The surgical management of pituitary adenomas in a series of 3,093 patients. J Am Coll Surg. 2001;193:651–9. doi: 10.1016/s1072-7515(01)01101-2. [DOI] [PubMed] [Google Scholar]
- 4.Herman V, Fagin J, Gonsky R, Kovacs K, Melmed S. Clonal origin of pituitary adenomas. J Clin Endocrinol Metab. 1990;71:1427–33. doi: 10.1210/jcem-71-6-1427. [DOI] [PubMed] [Google Scholar]
- 5.Kirschner LS, Carney JA, Pack SD, Taymans SE, Giatzakis C, Cho YS, et al. Mutations of the gene encoding the protein kinase A type I-alpha regulatory subunit in patients with the Carney complex. Nat Genet. 2000;26:89–92. doi: 10.1038/79238. [DOI] [PubMed] [Google Scholar]
- 6.Marx SJ. Molecular genetics of multiple endocrine neoplasia types 1 and 2. Nat Rev Cancer. 2005;5:367–75. doi: 10.1038/nrc1610. [DOI] [PubMed] [Google Scholar]
- 7.Vierimaa O, Georgitsi M, Lehtonen R, Vahteristo P, Kokko A, Raitila A, et al. Pituitary adenoma predisposition caused by germline mutations in the AIP gene. Science. 2006;312:1228–30. doi: 10.1126/science.1126100. [DOI] [PubMed] [Google Scholar]
- 8.Tichomirowa MA, Lee M, Barlier A, Daly AF, Marinoni I, Jaffrain-Rea ML, et al. Cyclin-dependent kinase inhibitor 1B (CDKN1B) gene variants in AIP mutation-negative familial isolated pituitary adenoma kindreds. Endocr Relat Cancer. 2012;19:233–41. doi: 10.1530/ERC-11-0362. [DOI] [PubMed] [Google Scholar]
- 9.Trivellin G, Daly AF, Faucz FR, Yuan B, Rostomyan L, Larco DO, et al. Gigantism and acromegaly due to Xq26 microduplications and GPR101 mutation. N Engl J Med. 2014;371:2363–74. doi: 10.1056/NEJMoa1408028. [DOI] [PMC free article] [PubMed] [Google Scholar]
- 10.Reincke M, Sbiera S, Hayakawa A, Theodoropoulou M, Osswald A, Beuschlein F, et al. Mutations in the deubiquitinase gene USP8 cause Cushing’s disease. Nat Genet. 2015;47:31–8. doi: 10.1038/ng.3166. [DOI] [PubMed] [Google Scholar]
- 11.Ronchi CL, Peverelli E, Herterich S, Weigand I, Mantovani G, Schwarzmayr T, et al. Landscape of somatic mutations in sporadic GH-secreting pituitary adenomas. European journal of endocrinology/European Federation of Endocrine Societies. 2016;174:363–72. doi: 10.1530/EJE-15-1064. [DOI] [PubMed] [Google Scholar]
- 12.Demichelis F, Greulich H, Macoska JA, Beroukhim R, Sellers WR, Garraway L, et al. SNP panel identification assay (SPIA): a genetic-based assay for the identification of cell lines. Nucleic acids research. 2008;36:2446–56. doi: 10.1093/nar/gkn089. [DOI] [PMC free article] [PubMed] [Google Scholar]
- 13.Brastianos PK, Horowitz PM, Santagata S, Jones RT, McKenna A, Getz G, et al. Genomic sequencing of meningiomas identifies oncogenic SMO and AKT1 mutations. Nat Genet. 2013;45:285–9. doi: 10.1038/ng.2526. [DOI] [PMC free article] [PubMed] [Google Scholar]
- 14.Li H, Durbin R. Fast and accurate short read alignment with Burrows-Wheeler transform. Bioinformatics. 2009;25:1754–60. doi: 10.1093/bioinformatics/btp324. [DOI] [PMC free article] [PubMed] [Google Scholar]
- 15.McKenna A, Hanna M, Banks E, Sivachenko A, Cibulskis K, Kernytsky A, et al. The Genome Analysis Toolkit: a MapReduce framework for analyzing next-generation DNA sequencing data. Genome Res. 2010;20:1297–303. doi: 10.1101/gr.107524.110. [DOI] [PMC free article] [PubMed] [Google Scholar]
- 16.DePristo MA, Banks E, Poplin R, Garimella KV, Maguire JR, Hartl C, et al. A framework for variation discovery and genotyping using next-generation DNA sequencing data. Nat Genet. 2011;43:491–8. doi: 10.1038/ng.806. [DOI] [PMC free article] [PubMed] [Google Scholar]
- 17.Cibulskis K, Lawrence MS, Carter SL, Sivachenko A, Jaffe D, Sougnez C, et al. Sensitive detection of somatic point mutations in impure and heterogeneous cancer samples. Nat Biotechnol. 2013;31:213–9. doi: 10.1038/nbt.2514. [DOI] [PMC free article] [PubMed] [Google Scholar]
- 18.Berger MF, Lawrence MS, Demichelis F, Drier Y, Cibulskis K, Sivachenko AY, et al. The genomic complexity of primary human prostate cancer. Nature. 2011;470:214–20. doi: 10.1038/nature09744. [DOI] [PMC free article] [PubMed] [Google Scholar]
- 19.Chapman MA, Lawrence MS, Keats JJ, Cibulskis K, Sougnez C, Schinzel AC, et al. Initial genome sequencing and analysis of multiple myeloma. Nature. 2011;471:467–72. doi: 10.1038/nature09837. [DOI] [PMC free article] [PubMed] [Google Scholar]
- 20.Browning BL, Yu Z. Simultaneous genotype calling and haplotype phasing improves genotype accuracy and reduces false-positive associations for genome-wide association studies. American journal of human genetics. 2009;85:847–61. doi: 10.1016/j.ajhg.2009.11.004. [DOI] [PMC free article] [PubMed] [Google Scholar]
- 21.International HapMap C. Altshuler DM, Gibbs RA, Peltonen L, Altshuler DM, Gibbs RA, et al. Integrating common and rare genetic variation in diverse human populations. Nature. 2010;467:52–8. doi: 10.1038/nature09298. [DOI] [PMC free article] [PubMed] [Google Scholar]
- 22.Carter SL, Cibulskis K, Helman E, McKenna A, Shen H, Zack T, et al. Absolute quantification of somatic DNA alterations in human cancer. Nature biotechnology. 2012;30:413–21. doi: 10.1038/nbt.2203. [DOI] [PMC free article] [PubMed] [Google Scholar]
- 23.Beroukhim R, Mermel CH, Porter D, Wei G, Raychaudhuri S, Donovan J, et al. The landscape of somatic copy-number alteration across human cancers. Nature. 2010;463:899–905. doi: 10.1038/nature08822. [DOI] [PMC free article] [PubMed] [Google Scholar]
- 24.Sun R, Love MI, Zemojtel T, Emde AK, Chung HR, Vingron M, et al. Breakpointer: using local mapping artifacts to support sequence breakpoint discovery from single-end reads. Bioinformatics. 2012;28:1024–5. doi: 10.1093/bioinformatics/bts064. [DOI] [PubMed] [Google Scholar]
- 25.Firestein R, Bass AJ, Kim SY, Dunn IF, Silver SJ, Guney I, et al. CDK8 is a colorectal cancer oncogene that regulates beta-catenin activity. Nature. 2008;455:547–51. doi: 10.1038/nature07179. [DOI] [PMC free article] [PubMed] [Google Scholar]
- 26.Barrett T, Wilhite SE, Ledoux P, Evangelista C, Kim IF, Tomashevsky M, et al. NCBI GEO: archive for functional genomics data sets--update. Nucleic Acids Res. 2013;41:D991–5. doi: 10.1093/nar/gks1193. [DOI] [PMC free article] [PubMed] [Google Scholar]
- 27.Reich M, Liefeld T, Gould J, Lerner J, Tamayo P, Mesirov JP. GenePattern 2.0. Nat Genet. 2006;38:500–1. doi: 10.1038/ng0506-500. [DOI] [PubMed] [Google Scholar]
- 28.Subramanian A, Tamayo P, Mootha VK, Mukherjee S, Ebert BL, Gillette MA, et al. Gene set enrichment analysis: a knowledge-based approach for interpreting genome-wide expression profiles. Proc Natl Acad Sci U S A. 2005;102:15545–50. doi: 10.1073/pnas.0506580102. [DOI] [PMC free article] [PubMed] [Google Scholar]
- 29.Ben-David U, Mayshar Y, Benvenisty N. Virtual karyotyping of pluripotent stem cells on the basis of their global gene expression profiles. Nat Protoc. 2013;8:989–97. doi: 10.1038/nprot.2013.051. [DOI] [PubMed] [Google Scholar]
- 30.Ben-David U, Ha G, Khadka P, Jin X, Wong B, Franke L, et al. The landscape of chromosomal aberrations in breast cancer mouse models reveals driver-specific routes to tumorigenesis. Nature communications. 2016;7:12160. doi: 10.1038/ncomms12160. [DOI] [PMC free article] [PubMed] [Google Scholar]
- 31.Carter SL, Eklund AC, Kohane IS, Harris LN, Szallasi Z. A signature of chromosomal instability inferred from gene expression profiles predicts clinical outcome in multiple human cancers. Nat Genet. 2006;38:1043–8. doi: 10.1038/ng1861. [DOI] [PubMed] [Google Scholar]
- 32.Zack TI, Schumacher SE, Carter SL, Cherniack AD, Saksena G, Tabak B, et al. Pan-cancer patterns of somatic copy number alteration. Nature genetics. 2013;45:1134–40. doi: 10.1038/ng.2760. [DOI] [PMC free article] [PubMed] [Google Scholar]
- 33.He J, Allen JR, Collins VP, Allalunis-Turner MJ, Godbout R, Day RS, 3rd, et al. CDK4 amplification is an alternative mechanism to p16 gene homozygous deletion in glioma cell lines. Cancer research. 1994;54:5804–7. [PubMed] [Google Scholar]
- 34.Sotillo R, Dubus P, Martin J, de la Cueva E, Ortega S, Malumbres M, et al. Wide spectrum of tumors in knock-in mice carrying a Cdk4 protein insensitive to INK4 inhibitors. EMBO J. 2001;20:6637–47. doi: 10.1093/emboj/20.23.6637. [DOI] [PMC free article] [PubMed] [Google Scholar]
- 35.Schoch C, Kohlmann A, Dugas M, Kern W, Hiddemann W, Schnittger S, et al. Genomic gains and losses influence expression levels of genes located within the affected regions: a study on acute myeloid leukemias with trisomy 8, 11, or 13, monosomy 7, or deletion 5q. Leukemia. 2005;19:1224–8. doi: 10.1038/sj.leu.2403810. [DOI] [PubMed] [Google Scholar]
- 36.Tsafrir D, Bacolod M, Selvanayagam Z, Tsafrir I, Shia J, Zeng Z, et al. Relationship of gene expression and chromosomal abnormalities in colorectal cancer. Cancer research. 2006;66:2129–37. doi: 10.1158/0008-5472.CAN-05-2569. [DOI] [PubMed] [Google Scholar]
- 37.Michaelis KA, Knox AJ, Xu M, Kiseljak-Vassiliades K, Edwards MG, Geraci M, et al. Identification of growth arrest and DNA-damage-inducible gene beta (GADD45beta) as a novel tumor suppressor in pituitary gonadotrope tumors. Endocrinology. 2011;152:3603–13. doi: 10.1210/en.2011-0109. [DOI] [PMC free article] [PubMed] [Google Scholar]
- 38.Wierinckx A, Roche M, Raverot G, Legras-Lachuer C, Croze S, Nazaret N, et al. Integrated genomic profiling identifies loss of chromosome 11p impacting transcriptomic activity in aggressive pituitary PRL tumors. Brain Pathol. 2011;21:533–43. doi: 10.1111/j.750-3639.2011.00476.x. Epub 2011 Feb 23. [DOI] [PMC free article] [PubMed] [Google Scholar]
- 39.Feng JHL, Zhang YZ. Gene expression profiling of non-invasion and invasion NFPAs. GEO: NCBI. 2013 p. Available from: http://www.ncbi.nlm.nih.gov/geo/query/acc.cgi?acc=GSE51618.
- 40.Lekva TUT, Berg JP, Bollerslev J, Olstad OK. Gene expression analysis of growth hormone producing somatotroph pituitary adenomas. GEO: NCBI. 2013 p. Available from: http://www.ncbi.nlm.nih.gov/geo/query/acc.cgi?acc=GSE46311.
- 41.Brastianos PK, Taylor-Weiner A, Manley PE, Jones RT, Dias-Santagata D, Thorner AR, et al. Exome sequencing identifies BRAF mutations in papillary craniopharyngiomas. Nat Genet. 2014;46:161–5. doi: 10.1038/ng.2868. [DOI] [PMC free article] [PubMed] [Google Scholar]
- 42.Lawrence MS, Stojanov P, Polak P, Kryukov GV, Cibulskis K, Sivachenko A, et al. Mutational heterogeneity in cancer and the search for new cancer-associated genes. Nature. 2013;499:214–8. doi: 10.1038/nature12213. [DOI] [PMC free article] [PubMed] [Google Scholar]
- 43.Li S, Rousseau D. ATAD3, a vital membrane bound mitochondrial ATPase involved in tumor progression. Journal of bioenergetics and biomembranes. 2012;44:189–97. doi: 10.1007/s10863-012-9424-5. [DOI] [PubMed] [Google Scholar]
- 44.Xu ZP, Dutra A, Stellrecht CM, Wu C, Piatigorsky J, Saunders GF. Functional and structural characterization of the human gene BHLHB5, encoding a basic helix-loop-helix transcription factor. Genomics. 2002;80:311–8. doi: 10.1006/geno.2002.6833. [DOI] [PubMed] [Google Scholar]
- 45.Joshi PS, Molyneaux BJ, Feng L, Xie X, Macklis JD, Gan L. Bhlhb5 regulates the postmitotic acquisition of area identities in layers II-V of the developing neocortex. Neuron. 2008;60:258–72. doi: 10.1016/j.neuron.2008.08.006. [DOI] [PMC free article] [PubMed] [Google Scholar]
- 46.An CH, Kim YR, Kim HS, Kim SS, Yoo NJ, Lee SH. Frameshift mutations of vacuolar protein sorting genes in gastric and colorectal cancers with microsatellite instability. Hum Pathol. 2012;43:40–7. doi: 10.1016/j.humpath.2010.03.015. [DOI] [PubMed] [Google Scholar]
- 47.Kottakis F, Foltopoulou P, Sanidas I, Keller P, Wronski A, Dake BT, et al. NDY1/KDM2B functions as a master regulator of polycomb complexes and controls self-renewal of breast cancer stem cells. Cancer research. 2014;74:3935–46. doi: 10.1158/0008-5472.CAN-13-2733. [DOI] [PMC free article] [PubMed] [Google Scholar]
- 48.Tzatsos A, Paskaleva P, Ferrari F, Deshpande V, Stoykova S, Contino G, et al. KDM2B promotes pancreatic cancer via Polycomb-dependent and -independent transcriptional programs. The Journal of clinical investigation. 2013;123:727–39. doi: 10.1172/JCI64535. [DOI] [PMC free article] [PubMed] [Google Scholar]
- 49.Witt H, Mack SC, Ryzhova M, Bender S, Sill M, Isserlin R, et al. Delineation of two clinically and molecularly distinct subgroups of posterior fossa ependymoma. Cancer cell. 2011;20:143–57. doi: 10.1016/j.ccr.2011.07.007. [DOI] [PMC free article] [PubMed] [Google Scholar]
- 50.Jones DT, Jager N, Kool M, Zichner T, Hutter B, Sultan M, et al. Dissecting the genomic complexity underlying medulloblastoma. Nature. 2012;488:100–5. doi: 10.1038/nature11284. [DOI] [PMC free article] [PubMed] [Google Scholar]
- 51.Cancer Genome Atlas Research N. Kandoth C, Schultz N, Cherniack AD, Akbani R, Liu Y, et al. Integrated genomic characterization of endometrial carcinoma. Nature. 2013;497:67–73. doi: 10.1038/nature12113. [DOI] [PMC free article] [PubMed] [Google Scholar]
- 52.Assie G, Letouze E, Fassnacht M, Jouinot A, Luscap W, Barreau O, et al. Integrated genomic characterization of adrenocortical carcinoma. Nat Genet. 2014;46:607–12. doi: 10.1038/ng.2953. [DOI] [PubMed] [Google Scholar]
- 53.Williams JL, Greer PA, Squire JA. Recurrent copy number alterations in prostate cancer: an in silico meta-analysis of publicly available genomic data. Cancer genetics. 2014;207:474–88. doi: 10.1016/j.cancergen.2014.09.003. [DOI] [PubMed] [Google Scholar]
- 54.Aizer AA, Abedalthagafi M, Linda Bi W, Horvath MC, Arvold ND, Al-Mefty O, et al. A prognostic cytogenetic scoring system to guide the adjuvant management of patients with atypical meningioma. Neuro-oncology. 2016;18:269–74. doi: 10.1093/neuonc/nov177. [DOI] [PMC free article] [PubMed] [Google Scholar]
- 55.Szymas J, Schluens K, Liebert W, Petersen I. Genomic instability in pituitary adenomas. Pituitary. 2002;5:211–9. doi: 10.1023/a:1025313214951. [DOI] [PubMed] [Google Scholar]
- 56.Pack SD, Qin LX, Pak E, Wang Y, Ault DO, Mannan P, et al. Common genetic changes in hereditary and sporadic pituitary adenomas detected by comparative genomic hybridization. Genes Chromosomes Cancer. 2005;43:72–82. doi: 10.1002/gcc.20162. [DOI] [PubMed] [Google Scholar]
- 57.Yavropoulou MP, Maladaki A, Topouridou K, Kotoula V, Poulios C, Daskalaki E, et al. Expression pattern of the Hedgehog signaling pathway in pituitary adenomas. Neurosci Lett. 2016;611:94–100. doi: 10.1016/j.neulet.2015.10.076. [DOI] [PubMed] [Google Scholar]
- 58.Evans CO, Young AN, Brown MR, Brat DJ, Parks JS, Neish AS, et al. Novel patterns of gene expression in pituitary adenomas identified by complementary deoxyribonucleic acid microarrays and quantitative reverse transcription-polymerase chain reaction. J Clin Endocrinol Metab. 2001;86:3097–107. doi: 10.1210/jcem.86.7.7616. [DOI] [PubMed] [Google Scholar]
- 59.Morris DG, Musat M, Czirjak S, Hanzely Z, Lillington DM, Korbonits M, et al. Differential gene expression in pituitary adenomas by oligonucleotide array analysis. European journal of endocrinology/European Federation of Endocrine Societies. 2005;153:143–51. doi: 10.1530/eje.1.01937. [DOI] [PubMed] [Google Scholar]
- 60.Ganem NJ, Godinho SA, Pellman D. A mechanism linking extra centrosomes to chromosomal instability. Nature. 2009;460:278–82. doi: 10.1038/nature08136. [DOI] [PMC free article] [PubMed] [Google Scholar]
- 61.Hastings PJ, Lupski JR, Rosenberg SM, Ira G. Mechanisms of change in gene copy number. Nature reviews Genetics. 2009;10:551–64. doi: 10.1038/nrg2593. [DOI] [PMC free article] [PubMed] [Google Scholar]
Associated Data
This section collects any data citations, data availability statements, or supplementary materials included in this article.