

Abstract
Background
Host immune response may predict the course of colorectal cancer (CRC). We examined the survival of 468 CRC patients associated with two tumor-infiltrating immune biomarkers – the number of cytotoxic T lymphocytes (CTL) and the activated CTLs, as reflected by the number of cells expressing granzyme B (GZMB) in the prospective Iowa Women's Health Study.
Methods
Using paraffin-embedded tissue samples, we constructed and immunostained tumor microarrays with CD8 (for CTL) and GZMB antibodies. We scored CTL and GZMB densities in tumor epithelial and stromal tissues and also created a composite score for each biomarker (sum of the scores across tissue compartments). Cox regression estimated the hazard ratio (HR) and 95% CI for all-cause and CRC-specific death associated with each composite score.
Results
CTL and GZMB composite scores were positively correlated (r = 0.65) and each biomarker was inversely correlated with stage at diagnosis. Both composite scores were higher in proximal colon tumors and tumors characterized by MSI-high, CIMP-high or BRAF mutation status. HR (95%CI) were 0.53 (0.38-0.75; P-trend=0.0004) and 0.66 (0.51-0.86; P-trend=0.002) for all-cause death, respectively; and 0.30 (0.18-0.51; P-trend<0.0001) and 0.41 (0.27-0.63; P-trend<0.0001) for CRC death, respectively. Including CTL and GZMB scores simultaneously in the model significantly improved the predictive performance of the models for all-cause and CRC death.
Conclusion
Higher tumor infiltration with CTL and GZMB cells is associated with improved all-cause and cancer-specific survival of CRC patients.
Impact
Both the number of CTLs and GZMB appear to be useful prognostic factors in CRC, irrespective of stage.
Keywords: immune response, colorectal cancer, survival, cytotoxic lymphocytes, Iowa Women's Health Study
Introduction
Colorectal cancer (CRC) is a leading cause of cancer death in the United States. The survival rate for CRC is improving, but 35% of patients still die within 5 years after diagnosis (1). Decisions about treatment for CRC are based largely on the tumor-node-metastasis (TNM) staging system, but there is considerable variability of outcomes within stages (2-4). Hence, to accurately determine prognosis and optimize treatment, it is essential to establish additional factors that predict and improve the stratification of CRC patients (5, 6). Classification of CRC tumors by molecular characteristics (e.g. chromosome instability, microsatellite instability (MSI), CpG island methylator (CIMP) phenotype, and mutation in BRAF and/or KRAS genes) has emerged as an important prognostic tool in CRC (reviewed in (6-12)). The most consistent data have been reported for MSI status: MSI-high versus MSI-low/MSS (microsatellite stable) tumors have been associated with 35-40% better survival (8, 10), and MSI status may inform decisions regarding adjuvant therapy for specific stages (13).
Another opportunity to refine CRC prognostication and clinical management is to consider immune activity in the tumor microenvironment. In a series of landmark studies, the group of Galon et al. demonstrated that the type, density and location of total lymphocytes (CD3+), cytotoxic T lymphocytes (CTL, or CD8+) and memory T lymphocytes correlated with disease-free and overall survival in CRC patients, and indicated the superiority of immune infiltrates over TNM staging in predicting patients' survival (14, 15). Subsequent studies have confirmed the importance of tumor lymphocytes as a prognostic factor in CRC (reviewed in (12, 16, 17)
Many studies have examined the role of tumor-infiltrating CTLs in colorectal tumors, and eight of them have been collectively evaluated in a recent meta-analysis that concluded that high versus (vs.) low CTL numbers in the tumor center, stroma, and invasive margin were associated with significantly decreased overall mortality by 33%, 22%, and 9%, respectively (18). In addition, inverse associations were found between CTL infiltration (in tumor center and invasive margin) and the risk of CRC recurrence or death. However, only a few of these studies were population-based and adjusted for epidemiologic characteristics other than age and gender (19).
While the association between the CTL presence in the tumor environment and patient outcome is well described, there is the potential for further refinement of predictive models. For some patients, the activity of tumor CTLs may be suppressed. Functioning CTLs provide anti-tumor activity through production of lysosomes containing perforin and granzymes; among them, granzyme B (GZMB) is the most abundant and potent (20). However, only a few studies have specifically examined the association between CTL activity captured by GZMB and CRC patients' survival (21-24). In addition, existing data are inconsistent as to whether the association between immune cell infiltration and improved patient outcomes holds true across CRC tumor subtypes (16, 22, 25-28).
Thus, to further elucidate the role of CTLs and GZMB in colorectal carcinogenesis and prognosis, we determined (1) the correlation of these immune biomarkers in tumor epithelium and stroma with clinicopathological, molecular, and epidemiological characteristics and (2) the individual and joint effect of CTLs and GZMB on all-cause and CRC-specific survival. To study these associations, we utilized data and tissue resources from the well-characterized Iowa Women's Health Study (IWHS), a population-based cohort of older women.
Materials and Methods
Briefly, IWHS participants were women ages 55-69 years randomly sampled from the 1985 Iowa Driver's license list (29, 30),who agreed to participate. Overall, 41,836 women completed the initial study questionnaire and were actively followed until 2011. The information about demographic, lifestyle and anthropometric characteristics was collected at baseline and five follow-up surveys in 1987, 1989, 1992, 1997, and 2004 (response rates were 91, 90, 83, 79, and 69%, respectively) (29). The current study was approved by the Institutional Review Boards at University of Minnesota, Mayo Clinic Rochester, and the University of Iowa.
CRC incidence was identified by annual linkage to the State Health Registry of Iowa, part of the Surveillance, Epidemiology, and End Results (SEER) program; the annual migration rate from Iowa was <1%; i.e., the follow-up of this cohort is nearly complete (29). CRC subsites were categorized as proximal colon (the cecum, ascending colon, hepatic flexure, transverse colon, and splenic flexure, International Classification of Diseases for Oncology (ICD-O-3) codes C18.0, C18.2-C18.5); distal colon (descending and sigmoid colon, ICD-O-3 codes C18.6, C18.7); or rectum (rectosigmoid junction and rectum, ICD-O-3 codes C19.9, C20.9). The SEER registry also provided information on the tumor extension and size at diagnosis, the number of examined lymph nodes, and the number of positive lymph nodes, grade, and first course of treatment (surgery, radiation, chemotherapy).
Participants' deaths in Iowa were identified through the State Health Registry of Iowa through 2011. The vital status of non-respondents and emigrants from Iowa was ascertained via linkage to the National Death Index; CRC-specific deaths were ascertained using ICD codes that listed CRC as the underlying cause of death (ICD9: 153.0-154.1, 159.0; ICD10: C18-C20, C26.0).
Construction of tissue microarrays (TMAs)
For this study, we used archived, paraffin-embedded tissue specimens from incident CRC cases diagnosed in 1986-2002 that were collected as part of a focused molecular epidemiology study (CA107333). Tissue specimens were retrieved from 732 out of 1255 (58%) CRC patients, which is similar to CRC tissue retrieval rates reported by other large cohorts (31, 32). After excluding CRC patients who reported cancer at baseline (n=146) and those with < 1 day of follow-up (n=6), tissue samples from 580 CRC patients were available for staining.
Paraffin blocks for CRC patients were serially sectioned onto 5 μm slides. The last slide was stained with hematoxylin and eosin, so that areas of neoplastic tissue (defined as >50% dysplastic cells) could be identified. For both antibodies, tonsil tissue was used as a positive control along with positive and negative colorectal tissue controls and the colorectal tissue treated with diluent. Using the marked slides as a guide, three tumor cores along with two normal colorectal tissue and liver control cores were taken from the corresponding tissue block and transferred to a TMA block. The TMAs were produced by the Mayo Clinic Pathology Research Core lab (Rochester) using the Beecher ATA-27 automated array. From the tissue microarray, 5 μm slides were cut for hematoxylin and eosin staining and immunohistochemistry (IHC) staining of immune cells.
Characterization of CTLs and GZMB
IHC analysis for CTLs (CD8+) and GZMB was performed by the Pathology Research Core at the Mayo Clinic (Rochester, MN) using the Leica Bond III Stainer (Leica, Buffalo, IL). Briefly, slides were dewaxed and retrieved for 20 minutes using Bond Dewax and Epitope Retrieval 1 (citrate) for CD8 or Epitope Retrieval 2 for GZMB (Leica, Buffalo, IL). The CD8 antibody (Clone 144B; Dako) and GZMB antibody (Clone GrB-7, Dako) were diluted in Bond Diluent (Leica, Buffalo, IL) (1:200) and incubated for 15 minutes. The utilized detection system (Polymer Refine Detection System by Leica, Buffalo, IL) included the hydrogen peroxidase block, secondary antibody polymer, DAB and Hematoxylin. Once completed, slides were removed from the stainer and rinsed for 5 minutes in tap water. Slides were dehydrated in increasing concentrations of ethyl alcohol and cleared in xylene prior to permanent coverslipping in xylene-based media.
An experienced gastrointestinal pathologist (T.S.) examined each tissue core. High-quality tissue samples were available from 468 CRC patients. They were assigned an integer score to CTLs and GZMB in two tumor areas – epithelium and stroma. Mean and maximum scores were associated in a similar fashion with clinicopathological characteristics and survival; therefore, only mean scores were used in the analyses. The following categories were created for CTL and GZMB scores: 1 –non-detected; 2 –mild (1-10 cells per 0.28 mm2); 3 –moderate (11-29 cells per 0.28 mm2); and 4 –strong infiltration (≥30 cells per 0.28 mm2) (Fig. 1). Necrotic areas were avoided. Additionally, to test reproducibility, we conducted an automatic quantification of CTLs in 16 colorectal tumors using image pixel classifier (Ilastik software (33)). ImageJ/Fiji (34) was used to calculate the number of positive cells across the core. The interclass correlation between automated and manual scoring was 0.93.
Figure 1.
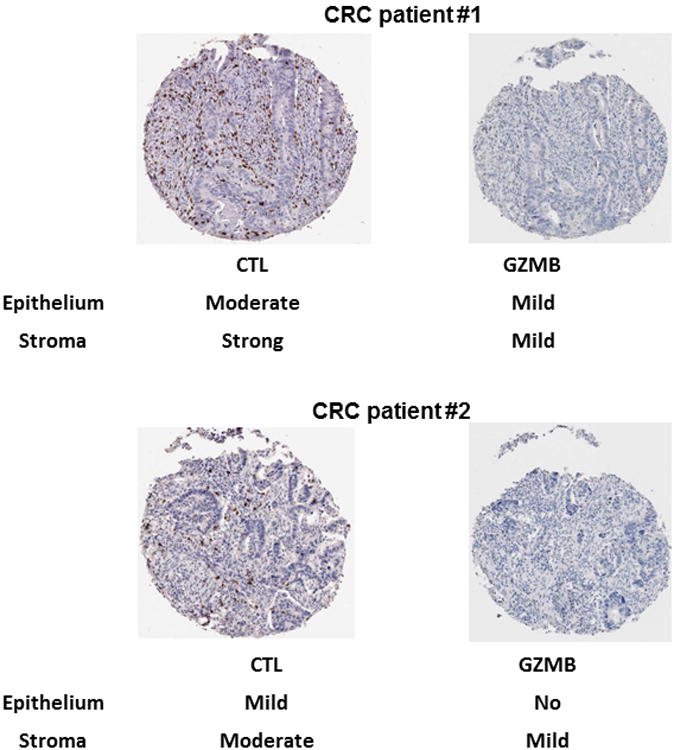
Classification of CTL (CD8+ expression) and GZMB in tumor epithelium and stroma in TMA cores in two CRC patients. The following categorization was used for both biomarkers: 1 - non-detected; 2 - mild (1-10 cells per 0.28 mm2); 3 - moderate (11-29 cells per 0.28 mm2); 4 - strong infiltration (≥30 cells per 0.28 mm2).
The data on molecular pathways for these IWHS colorectal tumors, including molecular subtypes, have been previously described (35, 36). Tumors were characterized as MSS, MSI-high or -low; CIMP-high, -low, or -negative; and positive or negative for BRAF and/or KRAS mutations. Based on these molecular features, integrated pathways were assigned: traditional (MSS, CIMP-negative, BRAF-mutation-negative, and KRAS-mutation-negative), alternate (MSS, CIMP-low, BRAF-mutation-negative, and KRAS-mutation-positive), serrated (any MSI, CIMP-high, BRAF-mutation-positive, and KRAS-mutation-negative), or unassigned (36).
Statistical methods
We calculated the individual epithelial and stromal tumor scores for CTL and GZMB by averaging the scores from three tumor cores per patient. We examined each immune score, separately, in epithelium and stroma: 4 categories were created for the epithelial CTL score (1, >1-2, >2-3, and >3); 3 categories, for the stromal CTL score (1, >1-<2, and ≥2), and 3 categories each (1, >1-<2, and ≥2) for epithelial and stromal GZMB scores. In categorizing scores, we aimed to have ≥15 CRC-specific deaths in each category. We also summarized immune scores in epithelial and stromal tumors for each biomarker (hereafter, called composite score). Since epithelial and stromal scores behaved similarly in relation to the patients' survival, the main analyses were done using composite tumor scores, categorized into quartiles for CTLs and tertiles for GZMB. We tested the distribution of immune scores across demographic, lifestyle, clinicopathological, and molecular characteristics of CRC patients using chi-square test.
We used Kaplan–Meier plots to estimate survival and log-rank tests in univariable models, and Cox proportional hazards regression to compute hazard ratios (HR) and 95% confidence intervals (CI). The main endpoints were all-cause and CRC death across each immune score. For all-cause mortality, participants' follow-up ended at the earliest of death, loss to follow-up, or the end of 2011. Additionally, in the analysis of CRC death, the participants were censored at date of death due to other causes. Associations between scores and non-CRC death were also analyzed.
We tested the proportionality of hazards assumption by including an interaction term between each immune score and follow-up time, and detected no evidence of the assumption's violation. However, since five-year survival is clinically important, we also analyzed mortality for the follow-up less and more than 5 years after diagnosis.
For each immune biomarker two models were created unadjusted model (Model 1) and Model 2, additionally adjusted for age at diagnosis, SEER stage (in situ or local, regional, or distant), tumor grade (well, moderately, poorly differentiated, or lymphomas/not stated), BMI before CRC diagnosis (continuous), and smoking history (current, former, or never). These covariates were associated with CRC patients' mortality in the earlier IWHS and other studies and were included a priori. Of note, the missing values for stage and grade were included as separate categories, while missing values for other covariates comprised <5% and those women were excluded.
The associations were not markedly changed after further adjustment for additional variables (year of diagnosis, first course of treatment (yes/no for surgery, radiation, or chemotherapy), CRC anatomic subsite (colon proximal, colon distal or rectal cancer; the latter two were combined), alcohol use, physical activity, hormone replacement therapy (HRT), history of diabetes, hypertension or heart disease); and those variables were not included in the final model. Due to the existing evidence that immune infiltration is associated with molecular characteristics, we created Model 3 additionally adjusted for integrated pathway (traditional, alternate, serrated, and unassigned) (36).
Further, we studied the risk of all-cause and CRC death associated with a joint score combining CTL and GZMB composite scores: the first category of this joint score (reference) included the lowest categories of CTL and GZMB scores; the third category, the highest categories of these scores; and the second category included all other combinations. Also, we created the receiver operating characteristic (ROC) curves using the logistic regression version of Model 2 for all-cause and CRC death within five-year follow-up, and tested the predictive performance of the models with and without GZMB and CTL scores (presented as pseudo-continuous variables). Additionally, we examined the association between each immune score and the mortality at different AJCC-TNM stages at diagnosis; our main interest was stages 2 and 3, due to the heterogonous prognosis within these stages. The AJCC-TNM stage variable (1-4) was previously derived for CRC patients in the IWHS studies using the SEER data on tumor extension and size, the number of lymph nodes examined, and the number of positive lymph nodes.
We also conducted several exploratory analyses. We repeated the analyses for CTL and granzyme B composite scores by stratifying CRC patients by tumor location (proximal and distal CRC) and molecular characteristics. To increase power in these analyses, immune scores were dichotomized at the median (≤5 and > 5 for CTL and ≤2.3 and >2.3 for GZMB; the lower category was the reference). We tested the interaction by adding a cross-product term between each composite score and the characteristics using the Wald chi-square test. Finally, we tested for selection bias by assigning a category for missing biomarker and comparing the risk of death between missing and non-missing categories in all 1255 CRC patients. All analyses were conducted using SAS (release 9.3); all statistical tests were two-sided.
Results
In our analytical cohort of 468 CRC patients (among them, 99.6% were Caucasians) followed until 2011 (median follow-up was 8.4 years), 314 (67%) died, 144 of them from CRC (31% of the entire cohort). During the five-year follow-up, survival was 62%, which is in agreement with the SEER five-year survival for women in this age group (1). The correlations between tumor epithelial and stromal scores were 0.54 and 0.66 for CTL and GZMB, respectively. Any immunostaining with CTL cells was observed in 80.2% of epithelial and 97.2% of stromal tumors, whereas immunostaining with GZMB was observed in smaller percentage of tumors: 37.1% and 53.1% of epithelial and stromal tissues, respectively. The composite scores for CTL and GZMB (created as a sum of corresponding epithelial and stromal scores) were correlated: r=0.65, which is slightly higher than r = 0.52-0.57 reported previously (15, 21).
Table 1 presents the distribution of composite scores across patients' characteristics. Both composite scores were positively correlated with age at diagnosis, but not with BMI or smoking status. The highest CTL and GZMB scores were associated with proximal colon location, MSI-high, CIMP-high, BRAF mutation-positive status, and KRAS mutation-negative status (Supplementary Table 1). In addition, the percentages of distant stage, traditional, and alternate pathways were lower and the percentages of serrated pathway were higher among those with the highest GZMB and CTL scores
Table 1.
Characteristics of women diagnosed with CRC across tumor composite scores for cytotoxic T lymphocytes (CTL) and granzyme B (GZMB)a.
| CTL composite tumor score n=465 | GZMBcomposite tumor score n=458 | ||||||||
|---|---|---|---|---|---|---|---|---|---|
|
| |||||||||
| Participant's characteristics (%) | 2-3.9 n=103 22.2 (%) | 4-5.1 n=139 29.9 (%) | 5.2-6.2 n=108 23.2 (%) | ≥6.3 n=115 24.7 (%) | P-valuee | 2 n=196 47.7% | 2.1-2.9 n=92 24.9% | ≥3 n=170 26.5% | P-valuee |
| Age at CRC diagnosis | |||||||||
| ≤ 71 y | 41.8 | 28.1 | 32.4 | 23.5 | 36.7 | 31.5 | 23.5 | ||
| 72-77 y | 32.0 | 46.0 | 39.8 | 38.3 | 40.3 | 39.1 | 38.8 | ||
| >77 y | 26.2 | 25.9 | 27.8 | 38.3 | 0.04 | 23.0 | 29.4 | 37.7 | 0.02 |
|
| |||||||||
| BMIb | |||||||||
| <25 kg/m2 | 35.9 | 36.0 | 38.0 | 34.8 | 41.3 | 29.4 | 35.9 | ||
| 25-30 kg/m2 | 37.9 | 35.3 | 31.5 | 34.8 | 33.7 | 43.5 | 31.2 | ||
| >30 kg/m2 | 26.2 | 28.8 | 30.6 | 30.4 | 0.98 | 25.0 | 27.2 | 32.9 | 0.12 |
|
| |||||||||
| Smokingb | |||||||||
| Current | 8.8 | 20.3 | 10.6 | 12.2 | 14.4 | 13.0 | 13.3 | ||
| Former | 18.6 | 16.7 | 23.1 | 23.5 | 21.7 | 19.6 | 19.3 | ||
| Never | 72.6 | 63.0 | 66.4 | 64.4 | 0.12 | 63.9 | 67.4 | 67.5 | 0.96 |
|
| |||||||||
| Stage at diagnosis | |||||||||
| In situ or local | 30.1 | 23.0 | 42.6 | 37.4 | 24.5 | 35.9 | 40.6 | ||
| Regional | 39.8 | 44.6 | 38.0 | 42.6 | 45.4 | 38.0 | 38.8 | ||
| Distant | 22.3 | 18.0 | 8.3 | 3.5 | 20.4 | 14.1 | 4.1 | ||
| Unknown | 7.8 | 14.4 | 11.1 | 16.5 | 0.0008 | 9.7 | 12.0 | 16.5 | <.0001 |
|
| |||||||||
| Grade | |||||||||
| Well differentiated | 4.9 | 4.3 | 11.1 | 1.7 | 5.1 | 7.6 | 4.1 | ||
| Moderately differentiated | 61.2 | 59.7 | 65.7 | 54.8 | 58.2 | 62.0 | 62.4 | ||
| Poorly differentiated | 26.2 | 33.1 | 18.5 | 40.9 | 31.1 | 23.9 | 31.8 | ||
| Lymphomas/not stated | 7.8 | 2.9 | 4.6 | 2.6 | 0.003 | 5.6 | 6.5 | 1.8 | 0.28 |
|
| |||||||||
| CRC site | |||||||||
| Proximal Colon | 53.9 | 51.1 | 44.9 | 78.3 | 50.3 | 51.1 | 69.2 | ||
| Distal Colon/Rectal | 46.1 | 48.9 | 55.1 | 21.7 | <0.0001 | 49.7 | 48.9 | 30.8 | 0.0005 |
|
| |||||||||
| Surgeryd | |||||||||
| No | 29.1 | 42.5 | 29.6 | 43.5 | 29.6 | 38.0 | 44.7 | ||
| Yes | 70.9 | 57.6 | 70.4 | 56.5 | 0.03 | 70.4 | 62.0 | 55.3 | 0.01 |
|
| |||||||||
| Chemotherapyd | |||||||||
| No | 67.0 | 79.1 | 78.7 | 78.1 | 73.0 | 73.9 | 86.5 | ||
| Yes | 33.0 | 20.9 | 21.3 | 21.9 | 0.008 | 27.0 | 26.1 | 13.5 | 0.004 |
|
| |||||||||
| Radiationd | |||||||||
| No | 95.0 | 97.7 | 96.3 | 99.1 | 94.8 | 98.9 | 98.2 | ||
| Yes | 5.0 | 2.3 | 3.7 | 0.9 | 0.43 | 5.2 | 1.1 | 1.8 | 0.09 |
Tumor CTL and GZMB composite scores were created as a sum of corresponding epithelial and stromal scores categorized into quartiles for CTL and tertiles for GZMB.
Value at the CRC diagnosis.
Value at baseline (in 1986).
Initial course of therapy.
P-values were based on chi-square test.
In a univariable analysis, all-cause and CRC-specific survival of CRC patients were significantly better for above vs. below the median of composite CTL and GZMB scores (Fig. 2, A-D). Similar inverse associations for both composite scores were observed in a multivariable analysis. Compared to the lowest categories of the scores, for the highest CTL category, HRs (95%CI) were 0.53 (0.38-0.75; P-trend=0.0004) for all-cause mortality and 0.30 (0.18-0.51; P-trend<0.0001) for CRC mortality, whereas for the highest GZMB category: HRs (95%CI) were 0.66 (0.51-0.86; P-trend=0.002) and 0.41 (0.27-0.63; P-trend<0.0001) for all-cause and CRC mortality, respectively (Model 2, Tables 2, 3). Additional adjustment for integrated pathways did not markedly change the associations (Model 3, Tables 2, 3). Of note, given no marked difference in the findings for Models 2 and 3, all the following findings will be presented for Model 2. The associations of epithelial and stromal score with all-cause or CRC death behaved in parallel to the corresponding associations for composite scores (Supplementary Tables 2 and 3). There were no associations between any of the analyzed immune biomarker scores and non-CRC death.
Figure 2.
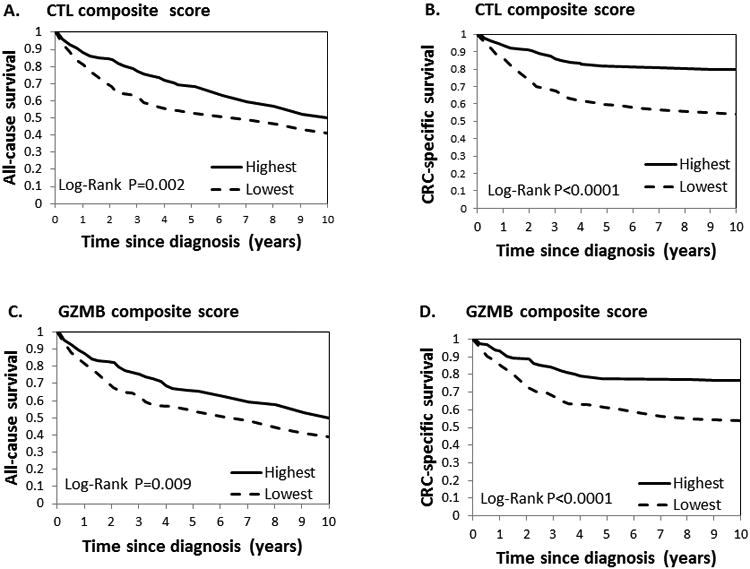
Kaplan–Meier survival curves for the tumor composite scores for CTL and GZMB. (a) CTL score and all-cause survival; (b) CTL score and CRC-specific survival; (c) GZMB score and all-cause survival; (d) GZMB score and CRC-specific survival. For ease of presentation, we dichotomized the scores below and above median (median scores were 5 and 2.3 for CTL and GZMB score, respectively).
Table 2.
Hazard ratios (HR) and 95% confidence intervals (CI) for all-cause in relation to tumor composite scores for cytotoxic T lymphocytes (CTL) and granzyme B (GZMB) in the CRC patients, IWHS, 1986-2011.
| Composite score | All-cause death | |||||
|---|---|---|---|---|---|---|
|
| ||||||
| No. Deathsb | Person-years | HR (95% CI)c | HR (95% CI)d | HR (95% CI)e | HR (95% CI)f | |
| CTLa | n=313 | |||||
|
| ||||||
| 2-3.9 | 76 | 745 | Reference | Reference | Reference | Reference |
| 4-5.1 | 100 | 1089 | 0.92 (0.68-1.23) | 0.72 (0.53-0.99) | 0.75 (0.54-1.05) | 0.74 (0.54-1.01) |
| 5.2-6.3 | 72 | 1040 | 0.69 (0.50-0.96) | 0.68 (0.49-0.95) | 0.67 (0.46-0.98) | 0.76 (0.53-1.07) |
| >6.3 | 65 | 1017 | 0.64 (0.46-0.90) | 0.53 (0.38-0.75) | 0.49 (0.32-0.73) | 0.62 (0.41-0.94) |
| P-trend | 0.002 | 0.0004 | 0.0006 | 0.04 | ||
|
| ||||||
| GZMB a | n=310 | |||||
|
| ||||||
| 2 | 146 | 1518 | Reference | Reference | Reference | Reference |
| 2.2-2.8 | 100 | 744 | 0.81 (0.59-1.09) | 0.82 (0.60-1.12) | 0.76 (0.54-1.07) | 0.84 (0.61-1.15) |
| >3 | 64 | 1544 | 0.72 (0.56-0.92) | 0.66 (0.51-0.86) | 0.64 (0.46-0.89) | 0.78 (0.56-1.09) |
| P-trend | 0.009 | 0.002 | 0.01 | 0.12 | ||
|
| ||||||
| Joint score for CTLs and GZMB g | n=309 | |||||
|
| ||||||
| 0 | 56 | 500 | Reference | Reference | Reference | |
| 1 | 199 | 2443 | 0.74 (0.55-1.00) | 0.70 (0.52-0.98) | 0.71 (0.51-0.99) | |
| 2 | 54 | 825 | 0.60 (0.41-0.87) | 0.50 (0.34-0.73) | 0.47 (0.30-0.74) | |
| P-trend | <0.0001 | <0.0001 | 0.001 | |||
Tumor CTL and GZMB composite scores were created as a sum of corresponding epithelial and stromal scores categorized into quartiles for CTL and tertiles for GZMB.
The number of deaths is slightly different in the analyses of CTL and GZMB because of different number of available cores (n=465 for CTL and n=458 for GZMB; overall 468 CRC patients had tissues immunostained for CTL or GZMB.
Model 1: Unadjusted.
Model 2: Model adjusted for age at diagnosis, BMI, smoking status, stage and grade at diagnosis.
Model 3: Model 2 + integrated pathway.
Both GZMB and CTL tumor composite scores were included with all variables in Model 2.
Joint score for GZMB and CTL tumor composite scores was created as follows: 0 – lowest categories of CTL and GZMB; 2 – highest categories of CTL and GZMB; and 1 – all other combinations.
Table 3.
Hazard ratios (HR) and 95% confidence intervals (CI) for CRC-specific death in relation to tumor composite scores for cytotoxic T lymphocytes (CTL) and granzyme B (GZMB) in the CRC patients, IWHS, 1986-2011.
| Composite score | CRC-specific death | |||||
|---|---|---|---|---|---|---|
|
| ||||||
| No. deaths b | Person-years | HR (95% CI)c | HR (95% CI)d | HR (95% CI)e | HR (95% CI)f | |
| CTLa | n=144 | |||||
|
| ||||||
| 2-3.8 | 50 | 745 | Reference | Reference | Reference | Reference |
| 4-5.1 | 50 | 1089 | 0.73 (0.49-1.08) | 0.63 (0.42-0.94) | 0.67 (0.43-1.04) | 0.68 (0.45-1.02) |
| 5.2-6.3 | 23 | 1040 | 0.36 (0.22-0.59) | 0.41 (0.25-0.67) | 0.40 (0.23-0.72) | 0.49 (0.29-0.82) |
| >6.3 | 21 | 1017 | 0.33 (0.20-0.55) | 0.30 (0.18-0.51) | 0.30 (0.15-0.57) | 0.44 (0.23-084) |
| P-trend | <0.0001 | <0.0001 | <0.0001 | 0.003 | ||
|
| ||||||
| GZMB a | n=144 | |||||
|
| ||||||
| 2 | 83 | 1518 | Reference | Reference | Reference | Reference |
| 2.2-2.8 | 46 | 744 | 0.71 (0.47-1.08) | 0.79 (0.52-1.21) | 0.69 (0.43-0.10) | 0.86 (0.56-1.33) |
| >3 | 15 | 1544 | 0.37 (0.25-0.56) | 0.41 (0.27-0.63) | 0.44 (0.26-0.75) | 0.60 (0.35-1.03) |
| P-trend | 0.0001 | 0.0001 | 0.002 | 0.06 | ||
|
| ||||||
| Joint score for CTL and GZMB g | n=144 | |||||
|
| ||||||
| 0 | 40 | 500 | Reference | Reference | Reference | |
| 1 | 87 | 2443 | 0.48 (0.33-0.71) | 0.55 (0.37-0.79) | 0.59 (0.39-0.89) | |
| 2 | 17 | 825 | 0.27 (0.15-0.48) | 0.27 (0.15-0.49) | 0.27 (0.13-0.54) | |
| P-trend | <0.0001 | <0.0001 | 0.0001 | |||
Tumor CTL and GZMB composite scores were created as a sum of corresponding epithelial and stromal scores categorized into quartiles for CTL and tertiles for GZMB.
The number of deaths is slightly different in the analyses of CTL and GZMB because of different number of available cores (n=465 for CTL and n=458 for GZMB; overall 468 CRC patients had tissues immunostained for CTL or GZMB).
Model 1: Unadjusted.
Model 2: Model adjusted for age at diagnosis, BMI, smoking status, stage and grade at diagnosis.
Model 3: Model 2 + integrated pathway.
Both GZMB and CTL tumor composite scores were included with all variables in Model 2.
Joint score for GZMB and CTL tumor composite scores was created as follows: 0 – lowest categories of CTL and GZMB; 2 – highest categories of CTL and GZMB; and 1 – all other combinations.
In the analyses of the five-year follow-up, the associations were similar to those observed for the total follow-up (Supplementary Table 4); no associations were observed between any of the immune scores and risk of all-cause or CRC-specific death for patients followed for ≥5 years (data not shown), but the power was limited, since most CRC deaths occurred within the first 5 years of follow-up. Further, after stratification by stage, the inverse associations remained for CRC death in stages 2 and 3: for the scores above vs. below median, the risk was decreased by 52% and 62% for CTL and by 74% and 50% for GZMB, respectively (Supplementary Table 5).
In exploratory analyses, we stratified CRC patients by molecular characteristics (Supplementary Table 5). Statistically significant interactions were found between CTL score and CIMP status in relation to all-cause and CRC death (P-interaction=0.05 and 0.02, respectively); decreased HRs were observed among those with CIMP low/high. Also, for CRC death, significant interactions were found between GZMB and CRC site (P-interaction=0.01; lower HR for proximal tumors) and BRAF status (P-interaction=0.05; lower HR for BRAF-positive mutation). Finally, there were no significant interactions between any composite scores and epidemiological characteristics: age at diagnosis, smoking, alcohol, BMI, or HRT use (all P-interactions>0.1).
In the model with the joint score based on composite CTL and GZMB, for the highest vs. lowest category, HR (95%CI) for all-cause and CRC death were significantly decreased by 53% and 0.73%, respectively (Tables 2, 3). Further, after we simultaneously included CTL and GZMB score as dichotomous variables, all the associations were attenuated with stronger attenuation for GZMB (Tables 2, 3). Of note, there was no interactions between these immune scores (P-interaction=0.56 and 0.91 for all-cause and CRC death). For CRC mortality, the ROC curve areas were: 0.73 (95%CI, 0.68-0.78) without any immune score; 0.76 (95%CI, 0.72-0.81), after adding CTL only; 0.76 (95%CI, 0.71-0.81), after adding GZMB only; and 0.77 (95%CI, 0.72-0.82), after including GZMB and CTL simultaneously (Supplementary Fig. 1, A). Remarkably, compared to the model without any immune score, in the model with two immune scores, at ∼90% specificity, the sensitivity for predicting CRC death was almost twice higher (∼50% vs. 25%), and the predictive performance was statistically significantly better (P=0.02). Similar improvement of predictive performance was observed for all-cause mortality: the ROC curve area was 0.71 (95%CI, 0.66-0.76) for the model without any immune score, and 0.73 (95%CI, 0.69-0.78) after both biomarkers were included (P=0.04) (Supplementary Fig. 1, B). Finally, there was no association between the missing category of any immune scores and the risk of any death (data not shown), implying no selection bias.
Discussion
Among 468 post-menopausal women diagnosed with CRC, we report a statistically significant decreased risk of all-cause and CRC death associated with CTL and GZMB infiltration in tumor epithelium and stroma, even after accounting for stage and other confounders. For each immune score, the mortality was similar in relation to epithelial and stromal scores. Further, the associations between each immune composite score and CRC death were observed in the patients diagnosed with stage 2 and stage 3 disease, implying that each of these scores may serve as a prognostic biomarker in those CRC patients. When both immune scores were included in the model, the predictive performance of the models for all-cause and CRC death significantly improved. Of note, no associations were found between immune scores and non-CRC death.
Consistent with previous findings (14, 20-22), we observed inverse correlations of stage with CTL and GZMB scores confirming the important role of the CTL number and activity (reflected by GZMB score) in CRC biology. Moreover, the inverse associations of CTL and GZMB scores with all-cause and CRC death in multivariable models suggest that both scores provide prognostic information beyond stage, which is in line with several studies for CTL (37-39) and GZMB (21, 22), although not all studies have been consistent (19, 23, 40). However, it is unclear whether the lack of significance in the latter studies was due to adjustment for stage or additional covariates such as other immune subsets and/or vascular, lymphatic and perineural invasion. The quantitative comparison with the previous studies is complicated by the fact that many studies did not compute relative risks (i.e., constructed only Kaplan-Meier survival curves and log-ranks), while the studies presenting HRs differed in methodology, e.g., had different follow-up times, adjusted for various confounders, used whole slides vs. TMAs, and quantified cells in various tumor regions. In the univariable model, for the CTL score above vs. below median, the HRs (95%CI) for all-cause death were very similar in our study (0.73 (0.58-0.91)) and two meta-analyses: 0.67 (0.45-1.00) (18) and 0.62 (0.44-0.88) (41). For CRC death, the HR in our study (0.46) was slightly lower than in the meta-analysis: 0.64 (0.46-0.91) (18), but similar to the HR of 0.43-0.47 reported in two other studies (not included into the meta-analyses) (37, 38). These small discrepancies are most likely explained by the different study methodologies or various study populations.
In addition to examining the individual roles of CTL and GZMB, we examined the joint effect on survival. As expected, when these immune scores were simultaneously included in the model, there was no evidence of interaction between them, and the associations with mortality were attenuated for each biomarker, since GZMB is predominantly produced by CTLs (12, 22, 42) (the correlation between GZMB and CTL scores r=0.65). However, the patterns of inverse association remained for both biomarkers, with stronger associations for CRC death. Most likely, CTL and GZMB impact colorectal tumor through additional independent pathways. GZMB may be produced by other immune cells such as NK, dendritic, and mast cells (43), while CTLs may also kill tumor cells via the Fas-/Fas ligand pathway (44, 45).
Further, in line with previous studies, we demonstrated that MSI-high tumors (vs. MSS tumors) are characterized by higher CTL (reviewed in (12, 16)) and GZMB scores (21, 22, 42), which is likely explained by increased levels of frameshift mutations in MSI-high tumors leading to elevated neoantigen production and anti-tumor immune response (16, 28, 46). We also observed higher CTL and GZMB scores in CIMP-high (vs. CIMP low/negative) and BRAF mutation-positive (vs. negative) tumors; to our knowledge, these findings have not been previously reported for GZMB. The parallel associations for CTL and GZMB are concordant with the earlier finding that genes for Th1 adaptive immunity (including GZMB and CTLs) form a tightly regulated cluster (15). Additionally, we report statistically significant interactions with CIMP status (for CTL), and BRAF mutation and subsite (for GZMB), but not with MSI status. The absence of stronger association between immune infiltration and the CRC patients' survival for MSI-high tumors is consistent with several other studies (21, 25-27, 38), but may seem controversial, since MSI-high colorectal tumors are most strongly infiltrated with lymphocytes and associated with better prognosis in our cohort (36) and other studies (8, 10). However, the lack of survival advantage for MSI-high tumors is supported by the recent findings that the increase in CTLs and other lymphocytes in MSI-high tumors is accompanied by the production of inhibiting molecules that allow tumors to escape destruction by an immune response (46-48), which agrees with the theory of immunoediting (49). Of note, the data on the interaction with molecular factors should be interpreted with caution due to multiple comparisons and limited sample size, which increases the chance of false-positive and false-negative results. These same reasons may explain inconsistent findings for the interaction between MSI and CTLs in the previous studies (reviewed in (12, 27)); thus, future larger studies are needed to examine the interactions between molecular factors and immune infiltrates.
The major strength of our study is the use of a well-characterized, population-based cohort with reliable ascertainment of cancers and deaths, near complete follow-up and detailed information about epidemiological, clinicopathological and molecular characteristics. One of the limitations is that we measured immune score only within the tumors, and not in the peritumoral area. However, to account for tumor heterogeneity, we examined infiltration in stromal and epithelial tissues and found no difference between these areas. Also, we averaged the scores across several tumor cores. Moreover, it has been argued that cell counting may be more reproducible within the tumor compared to the peritumoral area, and may also be more valuable in clinical practice (4). An additional limitation is that pathology core specimens were not available for all CRC patients in this cohort. However, two findings suggested no selection bias in our study: (1) there was no association between the category for missing immune scores and the risk of any death; and (2) the participants' demographic characteristics, exposure patterns, and tumor characteristics did not differ significantly between CRC cases with retrieved vs. non-retrieved tissue specimens (35). Finally, the cohort included only white postmenopausal women, so the findings may not be generalizable to all populations.
In conclusion, our results indicate that high CTL and GZMB scores may serve as useful prognostic characteristics in CRC patients especially when accounted for simultaneously. This finding may be particularly important for CRC patients diagnosed with stages 2 and 3, for whom treatment is unclear and the more personalized approach to treatment and prognosis is needed.
Supplementary Material
Acknowledgments
Funding: This study was supported by National Institutes of Health (NIH) Grant R01 CA039742, R01 CA107333 (P. J. Limburg), HHSN261201000032C (contract awarded to the University of Iowa). A. E. Prizment was supported by the National Center for Advancing Translational Sciences of the National Institutes of Health Award Number UL1TR000114. The content is solely the responsibility of the authors and does not necessarily represent the official views of the National Institutes of Health.
Footnotes
Conflicts of Interest: P. J. Limburg has received other commercial research support from Olympus America, Fujinon, Boston Scientific, Bayer Healthcare, BENEO-Orafti, Astra- Zeneca, Thorne Research, and Ironwood Pharmaceuticals; honoraria from Imedex; and royalties from Exact Sciences. No other conflicts of interest regarding this research have been reported.
References
- 1.Surveillance, Epidemiology, and End Results (SEER) Program (www.seer.cancer.gov) Research Data (1973-2013), National Cancer Institute, DCCPS, Surveillance Research Program, Surveillance Systems Branch, released April 2016, based on the November 2015 submission. [cited on 2016 June 2016]. Available from: www.seer.cancer.gov.
- 2.Compton CC. Optimal pathologic staging: Defining stage II disease. Clin Cancer Res. 2007;13:6862s–70s. doi: 10.1158/1078-0432.CCR-07-1398. [DOI] [PubMed] [Google Scholar]
- 3.Puppa G, Sonzogni A, Colombari R, Pelosi G. TNM staging system of colorectal carcinoma: A critical appraisal of challenging issues. Arch Pathol Lab Med. 2010;134:837–52. doi: 10.5858/134.6.837. [DOI] [PubMed] [Google Scholar]
- 4.Chaput N, Svrcek M, Aupérin A, Locher C, Drusch F, Malka D, Taïeb J, Goéré D, Ducreux M, Boige V. Tumour-infiltrating CD68+ and CD57+ cells predict patient outcome in stage II-III colorectal cancer. Br J Cancer. 2013 doi: 10.1038/bjc.2013.362. [DOI] [PMC free article] [PubMed] [Google Scholar]
- 5.Mlecnik B, Bindea G, Pags F, Galon J. Tumor immunosurveillance in human cancers. Cancer Metastasis Rev. 2011 doi: 10.1007/s10555-011-9270-7. [DOI] [PMC free article] [PubMed] [Google Scholar]
- 6.Jass JR. Classification of colorectal cancer based on correlation of clinical, morphological and molecular features. Histopathology. 2007;50:113–30. doi: 10.1111/j.1365-2559.2006.02549.x. [DOI] [PubMed] [Google Scholar]
- 7.Ogino S, Goel A. Molecular classification and correlates in colorectal cancer. The Journal of Molecular Diagnostics. 2008;10:13–27. doi: 10.2353/jmoldx.2008.070082. [DOI] [PMC free article] [PubMed] [Google Scholar]
- 8.Popat S, Hubner R, Houlston RS. Systematic review of microsatellite instability and colorectal cancer prognosis. Journal of clinical oncology. 2005;23:609–18. doi: 10.1200/JCO.2005.01.086. [DOI] [PubMed] [Google Scholar]
- 9.Zlobec I, Bihl MP, Schwarb H, Terracciano L, Lugli A. Clinicopathological and protein characterization of BRAF-and K-RAS-mutated colorectal cancer and implications for prognosis. International Journal of Cancer. 2010;127:367–80. doi: 10.1002/ijc.25042. [DOI] [PubMed] [Google Scholar]
- 10.Sinicrope FA, Okamoto K, Kasi PM, Kawakami H. Molecular biomarkers in the personalized treatment of colorectal cancer. Clinical Gastroenterology and Hepatology. 2016;14:651–8. doi: 10.1016/j.cgh.2016.02.008. [DOI] [PMC free article] [PubMed] [Google Scholar]
- 11.Phipps A, Limburg P, Baron J, Burnett Hartman A, Weisenberger D, Laird P, et al. Association between molecular subtypes of colorectal cancer and patient survival. Gastroenterology. 2015;148:77–87.e2. doi: 10.1053/j.gastro.2014.09.038. [DOI] [PMC free article] [PubMed] [Google Scholar]
- 12.Deschoolmeester V, Baay M, Lardon F, Pauwels P, Peeters M. Immune cells in colorectal cancer: Prognostic relevance and role of MSI. Cancer microenvironment. 2011;4:377–92. doi: 10.1007/s12307-011-0068-5. [DOI] [PMC free article] [PubMed] [Google Scholar]
- 13.Locker GY, Hamilton S, Harris J, Jessup JM, Kemeny N, Macdonald JS, et al. ASCO 2006 update of recommendations for the use of tumor markers in gastrointestinal cancer. J Clin Oncol. 2006;24:5313–27. doi: 10.1200/JCO.2006.08.2644. [DOI] [PubMed] [Google Scholar]
- 14.Pagès F, Berger A, Camus M, Sanchez-Cabo F, Costes A, Molidor R, et al. Effector memory T cells, early metastasis, and survival in colorectal cancer. N Engl J Med. 2005;353:2654–66. doi: 10.1056/NEJMoa051424. [DOI] [PubMed] [Google Scholar]
- 15.Galon J, Costes A, Sanchez Cabo F, Kirilovsky A, Mlecnik B, Lagorce-Pags C, et al. Type, density, and location of immune cells within human colorectal tumors predict clinical outcome. Science. 2006;313:1960–4. doi: 10.1126/science.1129139. [DOI] [PubMed] [Google Scholar]
- 16.Fridman WH, Pagès F, Sautès-Fridman C, Galon J. The immune contexture in human tumours: Impact on clinical outcome. Nature Reviews Cancer. 2012;12:298–306. doi: 10.1038/nrc3245. [DOI] [PubMed] [Google Scholar]
- 17.Ogino S, Nosho K, Kirkner GJ, Kawasaki T, Meyerhardt JA, Loda M, et al. CpG island methylator phenotype, microsatellite instability, BRAF mutation and clinical outcome in colon cancer. Gut. 2009;58:90–6. doi: 10.1136/gut.2008.155473. [DOI] [PMC free article] [PubMed] [Google Scholar]
- 18.Mei Z, Liu Y, Liu C, Cui A, Liang Z, Wang G, et al. Tumour-infiltrating inflammation and prognosis in colorectal cancer: Systematic review and meta-analysis. Br J Cancer. 2014;110:1595–605. doi: 10.1038/bjc.2014.46. [DOI] [PMC free article] [PubMed] [Google Scholar]
- 19.Nosho K, Baba Y, Tanaka N, Shima K, Hayashi M, Meyerhardt JA, et al. Tumour-infiltrating T-cell subsets, molecular changes in colorectal cancer, and prognosis: Cohort study and literature review. J Pathol. 2010;222:350–66. doi: 10.1002/path.2774. [DOI] [PMC free article] [PubMed] [Google Scholar]
- 20.Mulder WM, Bloemena E, Stukart MJ, Kummer JA, Wagstaff J, Scheper RJ. T cell receptor-zeta and granzyme B expression in mononuclear cell infiltrates in normal colon mucosa and colon carcinoma. Gut. 1997;40:113–9. doi: 10.1136/gut.40.1.113. [DOI] [PMC free article] [PubMed] [Google Scholar]
- 21.Salama Paul, Phillips Michael, Platell Cameron, Iacopetta Barry. Low expression of granzyme B in colorectal cancer is associated with signs of early metastastic invasion. Histopathology. 2011;59:207–15. doi: 10.1111/j.1365-2559.2011.03915.x. [DOI] [PubMed] [Google Scholar]
- 22.Guidoboni M, Gafà R, Viel A, Doglioni C, Russo A, Santini A, et al. Microsatellite instability and high content of activated cytotoxic lymphocytes identify colon cancer patients with a favorable prognosis. The American journal of pathology. 2001;159:297–304. doi: 10.1016/S0002-9440(10)61695-1. [DOI] [PMC free article] [PubMed] [Google Scholar]
- 23.Deschoolmeester V, Baay M, Van Marck E, Weyler J, Vermeulen P, Lardon F, et al. Tumor infiltrating lymphocytes: An intriguing player in the survival of colorectal cancer patients. BMC immunology. 2010;11:1. doi: 10.1186/1471-2172-11-19. [DOI] [PMC free article] [PubMed] [Google Scholar]
- 24.Mlecnik B, Tosolini M, Kirilovsky A, Berger A, Bindea G, Meatchi T, et al. Histopathologic-based prognostic factors of colorectal cancers are associated with the state of the local immune reaction. J Clin Oncol. 2011;29:610–8. doi: 10.1200/JCO.2010.30.5425. [DOI] [PubMed] [Google Scholar]
- 25.Ling A, Edin S, Wikberg ML, Öberg Å, Palmqvist R. The intratumoural subsite and relation of CD8+ and FOXP3+ T lymphocytes in colorectal cancer provide important prognostic clues. Br J Cancer. 2014;110:2551–9. doi: 10.1038/bjc.2014.161. [DOI] [PMC free article] [PubMed] [Google Scholar]
- 26.Baker K, Zlobec I, Tornillo L, Terracciano L, Jass JR, Lugli A. Differential significance of tumour infiltrating lymphocytes in sporadic mismatch repair deficient versus proficient colorectal cancers: A potential role for dysregulation of the transforming growth factor-β pathway. Eur J Cancer. 2007;43:624–31. doi: 10.1016/j.ejca.2006.11.012. [DOI] [PubMed] [Google Scholar]
- 27.Zlobec I, Lugli A. Prognostic and predictive factors in colorectal cancer. J Clin Pathol. 2008;61:561–9. doi: 10.1136/jcp.2007.054858. [DOI] [PubMed] [Google Scholar]
- 28.Maby P, Tougeron D, Hamieh M, Mlecnik B, Kora H, Bindea G, et al. Correlation between density of CD8+ T-cell infiltrate in microsatellite unstable colorectal cancers and frameshift mutations: A rationale for personalized immunotherapy. Cancer Res. 2015;75:3446–55. doi: 10.1158/0008-5472.CAN-14-3051. [DOI] [PubMed] [Google Scholar]
- 29.Zhang S, Folsom AR, Sellers TA, Kushi LH, Potter JD. Better breast cancer survival for postmenopausal women who are less overweight and eat less fat. the iowa women's health study. Cancer. 1995;76:275–83. doi: 10.1002/1097-0142(19950715)76:2<275::aid-cncr2820760218>3.0.co;2-6. [DOI] [PubMed] [Google Scholar]
- 30.Folsom AR, Kushi LH, Anderson KE, Mink PJ, Olson JE, Hong C, et al. Associations of general and abdominal obesity with multiple health outcomes in older women: The iowa women's health study. Arch Intern Med. 2000;160:2117–28. doi: 10.1001/archinte.160.14.2117. [DOI] [PubMed] [Google Scholar]
- 31.Lee W, Park S, Lee WY, Yun SH, Chun H. Clinical impact of tumor-infiltrating lymphocytes for survival in stage II colon cancer. Cancer. 2010;116:5188–99. doi: 10.1002/cncr.25293. [DOI] [PubMed] [Google Scholar]
- 32.Schernhammer ES, Giovannucci E, Baba Y, Fuchs CS, Ogino S. B vitamins, methionine and alcohol intake and risk of colon cancer in relation to BRAF mutation and CpG island methylator phenotype (CIMP) PLoS One. 2011;6:e21102. doi: 10.1371/journal.pone.0021102. [DOI] [PMC free article] [PubMed] [Google Scholar]
- 33.Sommer C, Straehle C, Köthe U, Hamprecht FA. In: Ilastik: Interactive learning and segmentation toolkit. 2011 IEEE international symposium on biomedical imaging: From nano to macro; IEEE. 2011:230–3. [Google Scholar]
- 34.Schindelin J, Arganda-Carreras I, Frise E, Kaynig V, Longair M, Pietzsch T, et al. Fiji: An open-source platform for biological-image analysis. Nature methods. 2012;9:676–82. doi: 10.1038/nmeth.2019. [DOI] [PMC free article] [PubMed] [Google Scholar]
- 35.Limsui D, Vierkant RA, Tillmans LS, Wang AH, Weisenberger DJ, Laird PW, et al. Cigarette smoking and colorectal cancer risk by molecularly defined subtypes. J Natl Cancer Inst. 2010;102:1012–22. doi: 10.1093/jnci/djq201. [DOI] [PMC free article] [PubMed] [Google Scholar]
- 36.Samadder NJ, Vierkant R, Tillmans L, Wang A, Weisenberger D, Laird P, et al. Associations between colorectal cancer molecular markers and pathways with clinicopathologic features in older women. Gastroenterology. 2013;145:348–56.e1. doi: 10.1053/j.gastro.2013.05.001. [DOI] [PMC free article] [PubMed] [Google Scholar]
- 37.Zlobec I, Minoo P, Baumhoer D, Baker K, Terracciano L, Jass JR, et al. Multimarker phenotype predicts adverse survival in patients with lymph node-negative colorectal cancer. Cancer. 2008;112:495–502. doi: 10.1002/cncr.23208. [DOI] [PubMed] [Google Scholar]
- 38.Chiba T, Ohtani H, Mizoi T, Naito Y, Sato E, Nagura H, et al. Intraepithelial CD8+ T-cell-count becomes a prognostic factor after a longer follow-up period in human colorectal carcinoma: Possible association with suppression of micrometastasis. Br J Cancer. 2004;91:1711–7. doi: 10.1038/sj.bjc.6602201. [DOI] [PMC free article] [PubMed] [Google Scholar]
- 39.Naito Y, Saito K, Shiiba K, Ohuchi A, Saigenji K, Nagura H, et al. CD8+ T cells infiltrated within cancer cell nests as a prognostic factor in human colorectal cancer. Cancer Res. 1998;58:3491–4. [PubMed] [Google Scholar]
- 40.Salama P, Phillips M, Grieu F, Morris M, Zeps N, Joseph D, et al. Tumor-infiltrating FOXP3+ T regulatory cells show strong prognostic significance in colorectal cancer. J Clin Oncol. 2009;27:186–92. doi: 10.1200/JCO.2008.18.7229. [DOI] [PubMed] [Google Scholar]
- 41.Gooden MJM, de Bock GH, Leffers N, Daemen T, Nijman HW. The prognostic influence of tumour-infiltrating lymphocytes in cancer: A systematic review with meta-analysis. Br J Cancer. 2011;105:93–103. doi: 10.1038/bjc.2011.189. [DOI] [PMC free article] [PubMed] [Google Scholar]
- 42.Phillips S, Banerjea A, Feakins R, Li S, Bustin S, Dorudi S. Tumour-infiltrating lymphocytes in colorectal cancer with microsatellite instability are activated and cytotoxic. Br J Surg. 2004;91:469–75. doi: 10.1002/bjs.4472. [DOI] [PubMed] [Google Scholar]
- 43.Chowdhury D, Lieberman J. Death by a thousand cuts: Granzyme pathways of programmed cell death. Annu Rev Immunol. 2008;26:389–420. doi: 10.1146/annurev.immunol.26.021607.090404. [DOI] [PMC free article] [PubMed] [Google Scholar]
- 44.Huber V, Fais S, Iero M, Lugini L, Canese P, Squarcina P, et al. Human colorectal cancer cells induce T-cell death through release of proapoptotic microvesicles: Role in immune escape. Gastroenterology. 2005;128:1796–804. doi: 10.1053/j.gastro.2005.03.045. [DOI] [PubMed] [Google Scholar]
- 45.Zhu Q, Liu J, Xu H, Yang C, Zhang A, Cui Y, et al. Mechanism of counterattack of colorectal cancer cell by fas/fas ligand system. World journal of gastroenterology. 2005;11:6125. doi: 10.3748/wjg.v11.i39.6125. [DOI] [PMC free article] [PubMed] [Google Scholar]
- 46.Mlecnik B, Bindea G, Angell HK, Maby P, Angelova M, Tougeron D, et al. Integrative analyses of colorectal cancer show immunoscore is a stronger predictor of patient survival than microsatellite instability. Immunity. 2016;44:698–711. doi: 10.1016/j.immuni.2016.02.025. [DOI] [PubMed] [Google Scholar]
- 47.Angelova M, Charoentong P, Hackl H, Fischer ML, Snajder R, Krogsdam AM, et al. Characterization of the immunophenotypes and antigenomes of colorectal cancers reveals distinct tumor escape mechanisms and novel targets for immunotherapy. Genome Biol. 2015;16:64. doi: 10.1186/s13059-015-0620-6. [DOI] [PMC free article] [PubMed] [Google Scholar]
- 48.Reissfelder C, Stamova S, Gossmann C, Braun M, Bonertz A, Walliczek U, et al. Tumor-specific cytotoxic T lymphocyte activity determines colorectal cancer patient prognosis. J Clin Invest. 2015;125:739–51. doi: 10.1172/JCI74894. [DOI] [PMC free article] [PubMed] [Google Scholar]
- 49.Dunn GP, Old LJ, Schreiber RD. The immunobiology of cancer immunosurveillance and immunoediting. Immunity. 2004;21:137–48. doi: 10.1016/j.immuni.2004.07.017. [DOI] [PubMed] [Google Scholar]
Associated Data
This section collects any data citations, data availability statements, or supplementary materials included in this article.