

Abstract
Abnormal metabolism is a hallmark of cancer, yet its regulation remains poorly understood. Cancer cells were considered to utilize primarily glycolysis for ATP production, referred to as the Warburg effect. However, recent evidence suggests that oxidative phosphorylation (OXPHOS) plays a crucial role during cancer progression. Here we utilized a systems biology approach to decipher the regulatory principle of glycolysis and OXPHOS. Integrating information from literature, we constructed a regulatory network of genes and metabolites from which we extracted a core circuit containing HIF-1, AMPK, and ROS. Our circuit analysis showed that while normal cells have an oxidative state and a glycolytic state, cancer cells can access a hybrid state with both metabolic modes coexisting. This was due to higher ROS production and/or oncogene activation, such as RAS, MYC, and c-SRC. Guided by the model, we developed two signatures consisting of AMPK and HIF-1 downstream genes, respectively, to quantify the activity of glycolysis and OXPHOS. By applying the AMPK and HIF-1 signatures to TCGA patient transcriptomics data of multiple cancer types and single-cell RNA-seq data of lung adenocarcinoma, we confirmed an anti-correlation between AMPK and HIF-1 activities and the association of metabolic states with oncogenes. We propose that the hybrid phenotype contributes to metabolic plasticity, allowing cancer cells to adapt to various microenvironments. Using model simulations, our theoretical framework of metabolism can serve as a platform to decode cancer metabolic plasticity and design cancer therapies targeting metabolism.
Major Findings
We developed a theoretical framework for modeling gene regulation of cancer metabolism. We found that, in addition to glycolytic and oxidative metabolism in normal cells, cancer cells have a new hybrid phenotype in which both metabolic modes coexist. Cells in the hybrid state have enhanced metabolic plasticity to facilitate tumorigenesis and metastasis. Guided by the modeling, we developed the AMPK and HIF-1 signatures to quantify the activity of OXPHOS and glycolysis respectively. We propose a new cancer therapeutic strategy by targeting the hybrid state.
Quick Guide to Equations and Assumptions
In this study, we constructed a regulatory network of cell metabolism that consists of regulatory proteins and metabolites. To understand the behavior of the network, we coarse-grained the whole network into a minimalist circuit of three components – AMPK, HIF-1 and ROS. Here we assumed that the essential feature of the network could be captured by this circuit, while the effects of many other relevant genes can be regarded as inputs to this circuit. The dynamic behaviors of the regulatory circuit AMPK:HIF-1:ROS (Figure 2) were analyzed by solving nonlinear differential rate equations. Typically, the deterministic rate equation for a protein or metabolite has a generic form:
| (eq. 1) |
Figure 2. The AMPK:HIF-1:ROS regulatory circuit.
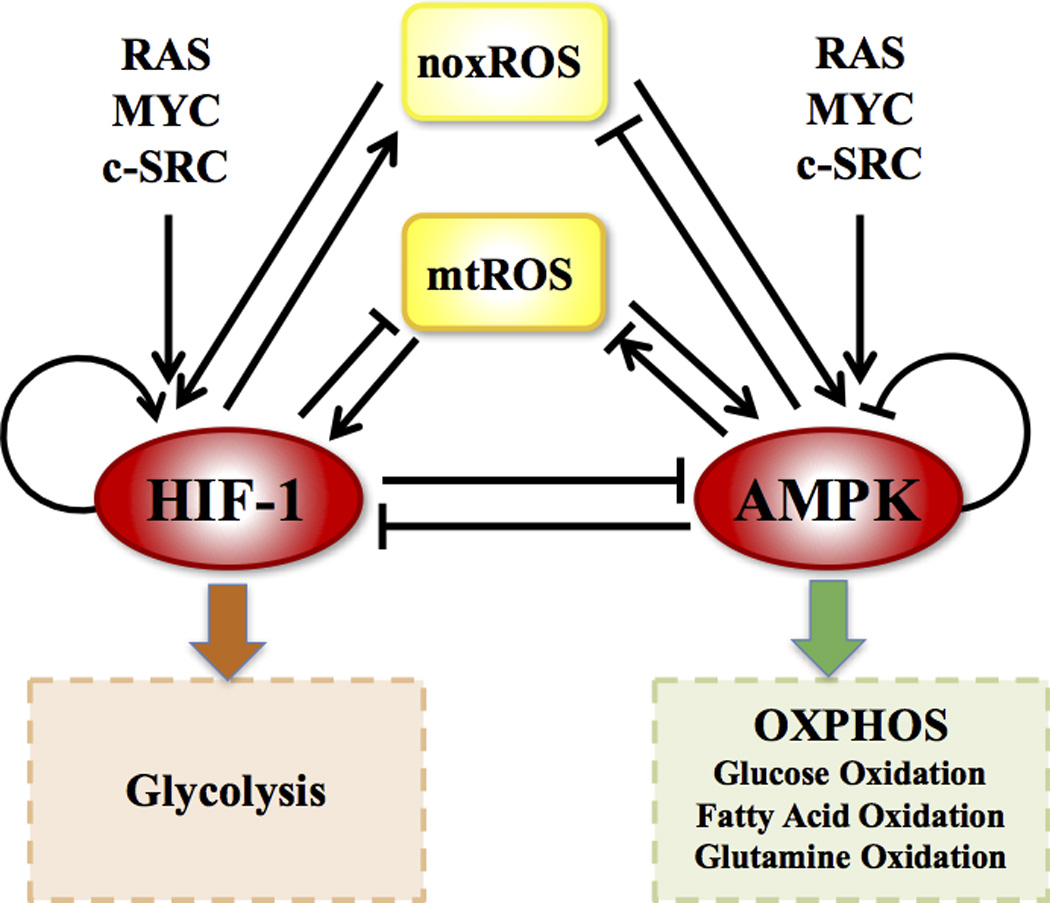
AMPK and HIF-1 are the master regulators of OXPHOS and glycolysis respectively. ROS represents both mtROS and noxROS. RAS, MYC and c-SRC modulates the balance of glycolysis and OXPHOS (details in Figure 4).
Here, X represents the level of the protein or the metabolite. gX and kX represent the basal production and degradation rates of X respectively. G and K represent the regulation on the production and degradation of X respectively.
Overall, we assumed that the regulation of X by a component Y can be described by a nonlinear function, namely the shifted Hill function (1, 2),
| (eq. 2) |
where Y0 is the threshold level, nY is the Hill coefficient and λY is the fold change.
H− is the inhibitory Hill function, defined as
| (eq. 3) |
H+ is the excitatory Hill function, defined as
| (eq. 4) |
λY < 1 represents an inhibitory regulation and λY > 1 represents an excitatory regulation.
When the production of X is regulated by Y, G = Hs(Y, Y0, λY, nY). When the degradation of X is regulated by Y, K = Hs(Y, Y0, λY, nY).
When the production (or degradation) of X is regulated by two components Y and Z simultaneously, G can be expressed as:
| (eq. 5) |
Details of the functional form of Ccomp can be found in SI section 3.
In our modeling, AMPK and HIF-1 competitively regulate the production of ROS (both mitochondria ROS and cytosol ROS); ROS and oxygen competitively regulate the degradation of HIF-1. All the other combined regulatory processes are assumed to be independent. The parameters were estimated per experimental evidence, as shown in Tables S3–6. Furthermore, the model allowed evaluation of the effects of oncogenes and metabolic therapies. Details can be found in SI section 3–6, 9.
Introduction
Cells can utilize multiple metabolic pathways for energy production and biosynthesis depending on the requirements for cellular function and the availability of metabolites. In the presence of glucose, cells typically uptake glucose and convert it to pyruvate inside the cytosol by glycolysis. Under normoxic conditions, pyruvate is further transported into mitochondria where it undergoes oxidative phosphorylation (OXPHOS) to produce ATP through the tricarboxylic acid (TCA) cycle and the electron transport chain (ETC). On the other hand, under hypoxia, cells utilize anaerobic glycolysis instead, which converts pyruvate into lactate, and produces ATP in a much faster but less efficient way. If fatty acid or glutamine is available, cells under normoxia can also undergo fatty-acid oxidation (also called beta-oxidation) or glutamine oxidation.
Abnormal metabolism is a hallmark of cancer (3–5). Unlike normal cells, cancer cells largely depend on glycolysis to produce energy even in the presence of oxygen, which is referred to as the Warburg effect (6, 7) or aerobic glycolysis. Aerobic glycolysis is an aggressive metabolic phenotype in that it has the advantage to produce ATP at a high rate and prepare biomass for amino acids and fatty-acids synthesis that are required for rapid cell proliferation (7). Although aerobic glycolysis is generally regarded as a dominant metabolism in cancer cells (8), recent evidence suggests that mitochondrial OXPHOS is also utilized by cancer cells (9–12). Indeed, the influence of mitochondria on cancer cells is well documented (13–19), suggesting that mitochondria are actively functioning in cancer cells. More importantly, it has been revealed that OXPHOS contributes to cancer metastasis (11–15, 19–21). Yet, it is still unclear how these metabolic modes are regulated in cancer cells, particularly the advantages of having each one of them.
To shed light on these puzzles, we utilize a computational systems biology approach to study the genetic regulation of glycolysis and OXPHOS (including glucose oxidation, fatty acid oxidation and glutamine oxidation). Certainly, cancer metabolism has been studied by several computational modeling approaches. However, each of these earlier works mostly focused on only a part of the interplay between glycolysis and OXPHOS. For example, there are studies of the Warburg effect, including modeling of the regulation by reactive oxygen species (ROS) of hypoxia-inducible factor 1 (HIF-1) in response to hypoxia (22), and modeling of the genome-scale metabolic network based on metabolic flux balance analysis (23). Some other studies focused on mitochondrial functions, for example, in the study of the cooperative effects of TrxR and Prx in defending oxidative stresses (24). The evolutionary advantage of metabolic heterogeneity of cancer has also been investigated (25) with emphasis on glycolysis and acidity. However, we still lack a comprehensive picture of how different metabolic pathways contribute to the survival and oncogenic potential of cancer cells. Therefore, there is an urgent need to explore in detail how genes and metabolites regulate both aerobic glycolysis and OXPHOS.
In this study, we establish a theoretical framework for modeling genetic regulation of the interplay between glycolysis and OXPHOS in cancer metabolism. Based on an extensive literature survey, we construct a metabolic network model for both glycolysis and OXPHOS. The network includes both regulatory genes and metabolites that are involved in these metabolic pathways. To capture the two regimes of cancer metabolism, we further coarse-grained the network into a core regulatory circuit, composed of HIF-1, 5’ AMP-activated protein kinase (AMPK) and ROS. The circuit contains HIF-1 and AMPK, as they are the master regulator of glycolysis and OXPHOS respectively (7); and ROS is included because both cytosolic and mitochondrial ROS (mtROS) mediate the interplay between the regulatory genes and metabolites (20, 26). This reduced representation provides a clear picture of the interplay between glycolysis and OXPHOS. Similar HIF-1:AMPK:ROS representation has also been proposed in the study of longevity in C. elegans (26), suggesting that the circuit is evolutionarily robust. The core regulatory circuit is modulated by several oncogenic signaling pathways, including MYC, RAS and c-SRC (27–29). Many metabolic drugs (30) directly target the genes that are associated with specific metabolic reactions, such as GLUT1, HK and FASN, or regulatory genes in the current study, i.e., AMPK and HIF-1. Therefore, the regulatory circuit allows us to model the effects of the oncogenes and metabolic drugs on cellular metabolism. As we show later, this model can explain important experimental observations, and is sufficient to capture the main differences between cancer and normal cells.
Computational modeling of our reduced circuit shows that in general cancer cells can have three stable states – a Warburg state (W: high HIF-1, low pAMPK), an oxidative state (O: low HIF-1, high pAMPK), and a hybrid state (W/O: high HIF-1, high pAMPK). Here, the AMPK activity is represented by the level of phosphorylated AMPK (pAMPK) at threonine-172 of the α subunit. Compared to cancer cells, normal cells usually lack the hybrid phenotype due to their lower mtROS production and higher rate of HIF-1 degradation. The activation of oncogenic pathways is an alternative way to induce cells to lie in the hybrid state. The discovery of the hybrid metabolic state for cancer cells from the network analysis has been supported by recent experimental evidence (10, 11, 16, 19, 20) (summarized in Table S1). The association of cancer metabolism and oncogenic pathways are also supported by extensive TCGA and single-cell transcriptomics data analysis of multiple cancer types under this theoretical framework. Particularly, we develop two signatures to quantify AMPK and HIF-1 activities and find that AMPK activity anti-correlates with HIF-1 activity in several tumors but not in the others. We propose that the W/O hybrid state enhances metabolic plasticity, therefore allowing the cancer cells to adapt to the tumor microenvironment and promote cancer progression and metastasis. Guided by the simulations of targeting AMPK or HIF-1, we make predictions on the effectiveness of various therapeutic strategies, such as hyperbaric oxygen, metformin and 3-bromopyrvate (3BP), in reducing the metabolic plasticity of cancer cells. All told, our model provides not only a theoretical framework for charactering the regulatory mechanism of glycolysis and OXPHOS and its connection to tumorigenesis, but also new insights into the optimal therapeutic strategies that specifically target cancer metabolism.
Results
The Regulatory Network of Glycolysis and OXPHOS
After an extensive literature analysis, we constructed a comprehensive network (Figure 1) featuring the regulation of oxidative respiration and glycolysis by both genes and metabolites. The network contains the following four types of regulatory interactions. First, the three major metabolic pathways – aerobic glycolysis, glucose oxidation and fatty-acid oxidation (green rectangles) directly inhibit each other because they compete for shared metabolites (see SI section 1 for details). Second, the activity of these metabolic pathways is directly regulated by specific genes (red ovals). Most prominently, the fatty acid oxidation and glucose oxidation are regulated by an energy sensor gene, AMPK and the glycolytic pathway is regulated by the hypoxia-inducible factor, HIF-1. Third, some metabolites produced by the metabolic pathways (yellow rectangles) in turn regulate the activities of some regulatory genes. HIF-1 is stabilized by both NOX-derived ROS (noxROS) from cytosol and OXPHOS-derived ROS from mitochondria (mtROS). Meanwhile, ROS induces phosphorylation and activation of AMPK, yet excessive production of ATP by either metabolic pathway could block the AMPK activity (see Table S1 for details). Fourth, the regulatory genes are also coupled to several oncogenic pathways (blue ovals), including RAS, MYC and c-SRC (Table S2).
Figure 1. Schematic illustration of the regulatory network of metabolism.
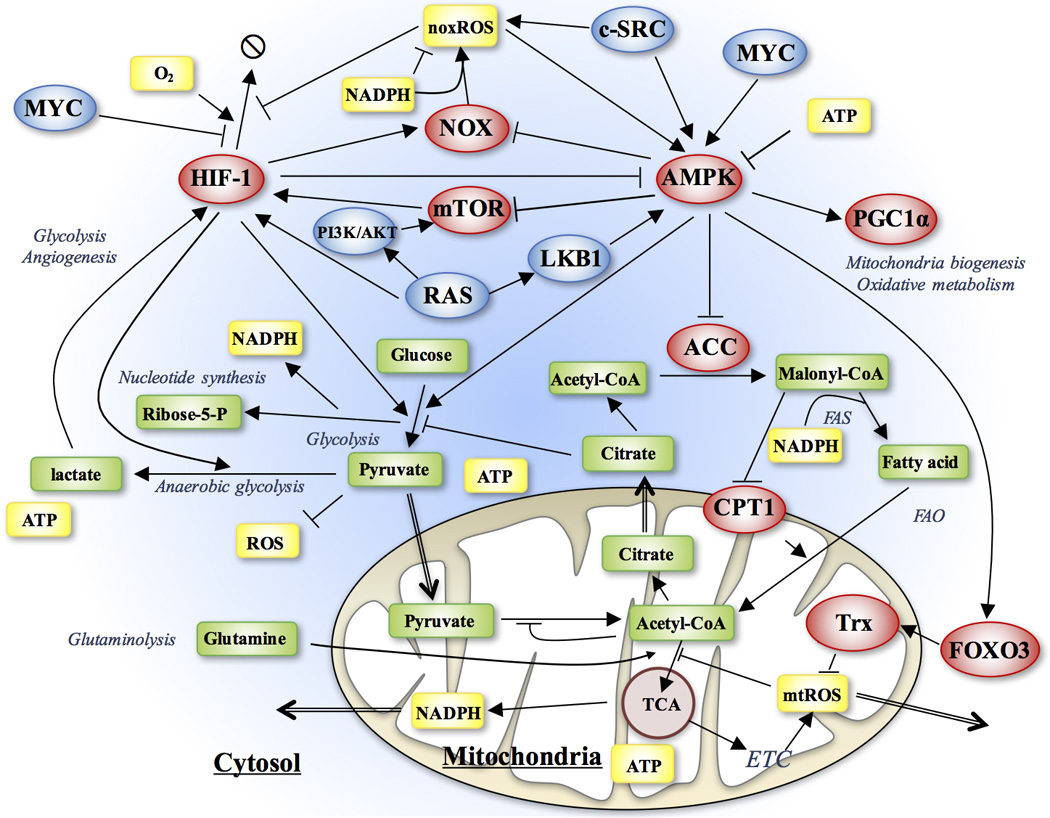
The network includes both regulatory genes (ellipses) and metabolites (rectangles). The arrows represent positive regulation and the bars represent negative regulation. AMPK and HIF-1 play a central role in regulating different metabolic pathways, while the metabolic pathways regulate activities of AMPK and HIF-1 partially through ROS. The oncogenic pathways directly regulate the activity of AMPK, HIF-1 and noxROS.
The Core AMPK:HIF-1:ROS Regulatory Circuit
To capture the principles of how genes and metabolites modulate metabolism, we coarse-grained the extensive metabolic network (Figure 1) to a minimalist regulatory circuit consisting of AMPK, HIF-1 and ROS (including noxROS and mtROS) (Figure 2). These components were chosen, because they play critical roles in regulating the decision-making of both glycolysis and OXPHOS. Moreover, the core regulatory circuit captures the main features of the more complete network. As we show later, the reduced circuit is sufficient to explain important experimental observations of glycolysis and OXPHOS. It is worth noting that the core circuit is directly coupled with both the oncogenic pathways and metabolic pathways. Its dynamic behavior can shed insight into the interplay of the various metabolic modes in cancer.
As shown in Figure 2, the regulatory links among these four components –AMPK, HIF-1, noxROS and mtROS - are derived from either direct or indirect regulatory interactions (see SI section 2 for details). Various oncogenic pathways are modeled as input signals to the circuit, and the activities of OXPHOS and glycolysis are modeled as the readout of the circuit. The detailed experimental evidence for the regulatory interactions of the full network and the associated reduced circuit are listed in the Table S2. The corresponding chemical rate equations are provided in SI section 3. The parameters and their experimental justifications are provided in Table S3–6.
The Metabolic Circuit Allows Multiple Cell Phenotypes
To identify the possible cell states that are allowed by the core circuit, we performed an analysis of the circuit equations with two sets of parameter that correspond to normal and cancer cells respectively. Here we illustrate the results by considering the differences between cancer cells and normal cells in two aspects. First, cancer cells have higher mtROS production due to reprogrammed mitochondria (20). Second, cancer cells have more stable HIF-1 because less oxygen is available to each cell due to abnormally rapid proliferation. The effects of the oncogenic pathways will be evaluated in the next section. Therefore, as compared to normal cells cancer cells produce more mtROS in response to the AMPK activation (represented by γ, maximum fold change of mtROS by the AMPK activation), and have a lower HIF-1 degradation rate (denoted by kh). As mentioned above, the activity of AMPK was quantified by the concentration of its phosphorylated form, i.e. pAMPK.
Our simulations show that normal cells have two stable steady states, which correspond to the (high HIF-1, low pAMPK) state and the (low HIF-1, high pAMPK) state (Figure 3A), which are associated with the Warburg effect (W) and oxidative respiration (O) respectively (the ‘W’ state and ‘O’ state in Figure 3A). This result is consistent with the fact that, while cells usually use glucose oxidation to produce energy, they switch to glycolysis during anaerobic exercise. Next, we performed an analogous analysis for the cancer cells, as reflected by larger γ and lower kh. Interestingly, we found that cancer cells have a new hybrid state – (high pAMPK, high HIF-1) (‘W/O’ state in Figure 3B) in addition to the ‘W’ and ‘O’ states. The new hybrid state is found to be a robust feature of the cancer cells by parameter sensitivity analysis (Figure S1). In the hybrid state, the levels of pAMPK and HIF-1 are both high because the cancer cells maintain high levels of ROS that both stabilizes HIF-1 and activates AMPK. The existence of the hybrid metabolic phenotype means that cancer cells have the flexibility to simultaneously utilize both glycolysis and mitochondrial OXPHOS.
Figure 3. The nullclines and steady states in the phase space of AMPK and HIF-1.
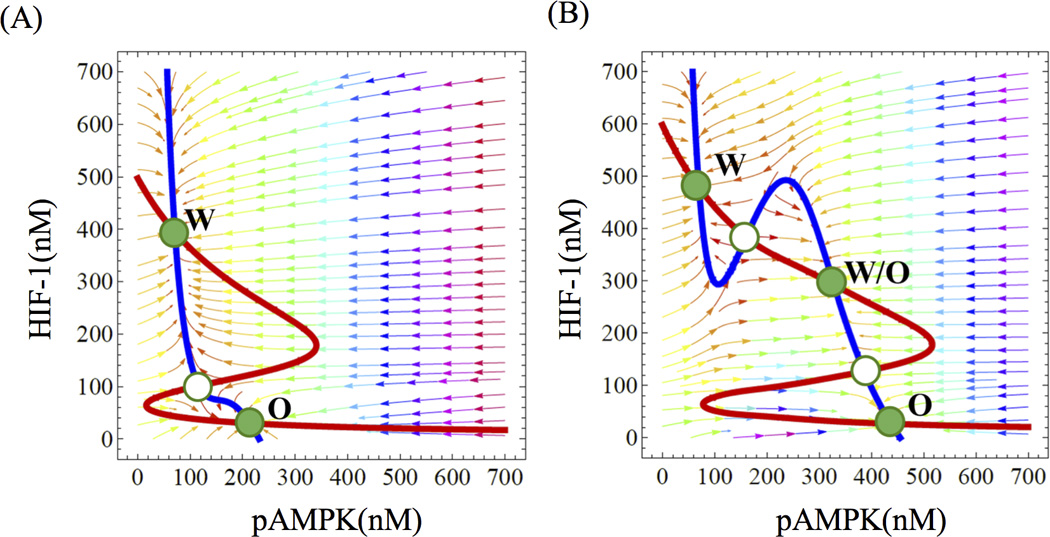
The red line represents the nullcline of dh/dt = 0, and the blue line represents the nullcline of dA/dt = 0 (see SI Eq. S1). The green solid dots denote stable steady states and the green hallow dots denote unstable steady state. Each stable state is associated with a metabolic phenotype. For normal cells (panel A), the circuit allows a Warburg state, denoted by ‘W’, and an OXPHOS state, denoted by ‘O’. For cancer cells (panel B), the circuit allows an additional hybrid state, denoted as “W/O’.
The Role of mtROS Production and Ontogenetic Pathways in Cancer Metabolism
We further evaluated the effects of mtROS production and several oncogenes on the dynamic behavior of the AMPK:HIF-1:ROS circuit. In Figure 4A, we show that, when the rest of the parameters remain unchanged, the increase of γ shifts the cells from bistability (with two stable steady states) to tristability (with three stable steady states) and gives rise to the hybrid metabolic state - ‘W/O’, in addition to ‘W’ and ‘O’ phenotypes. This is because, once again, higher production of mtROS by mitochondria stimulates both AMPK activation and HIF-1 stabilization, which is consistent with the experimental results that partial inhibition of ETC leads to the co-existence of glycolysis and OXPHOS by producing excessive mtROS (20). In addition to ROS production, stabilization of HIF-1, as reflected by lower kh, can also give rise to the hybrid W/O state (Figure S2).
Figure 4. Bifurcation diagrams of the levels of phosphorylated AMPK (pAMPK) and HIF-1 driven by mtROS production (A), MYC (B), c-SRC (C) and RAS (D).
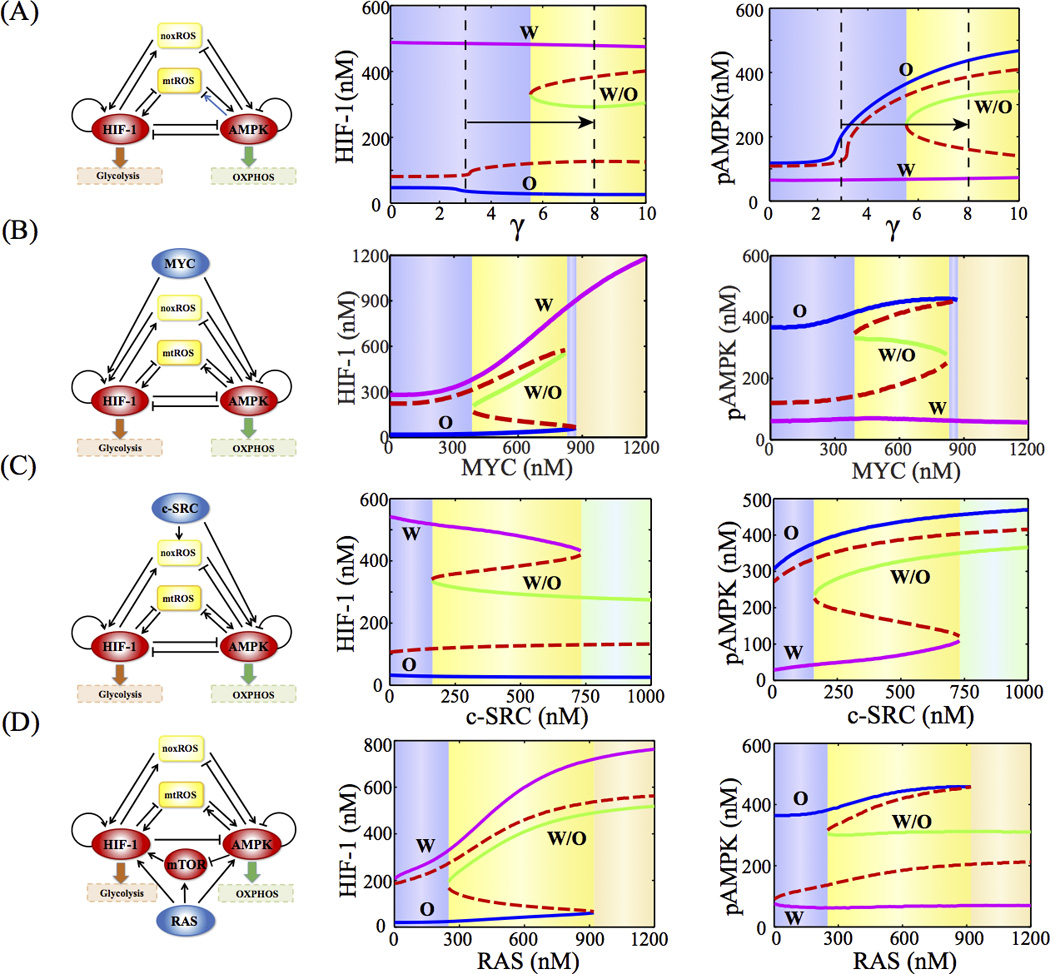
γ represents the fold change of mtROS by AMPK activation. The blue, green, and magenta solid lines represent the phenotypes - ‘O’, ‘W/O’, and W’ respectively. The red dashed line represents the unstable states. Different background colors represent different phases.
Similarly, we simulated the response of the core circuit to the changes in the activity of the following oncogenic pathways, i.e. MYC (Figure 4B), c-SRC (Figure 4C) and RAS (Figure 4D) (See SI section 4–6 for the modeling details). Interestingly, in all these cases, we found that moderate activation of RAS, MYC or c-SRC induces the circuit from a two-state system to a three-state system containing the hybrid state ‘W/O’. Strong activation of RAS can drive the circuit to either the ‘W’ or the ‘W/O’ phenotype, while strong activation of c-SRC can drive the circuit to either the ‘O’ or the ‘W/O’ phenotype. However, strong activation of MYC can drive the circuit to the ‘W’ state. The results are consistent with the experimental evidences on the role of some oncogenic pathways in modulating both glycolysis and OXPHOS. Previously, we show that cells with high c-SRC activity have substantial levels of glycolysis and fatty acid oxidation (31). In addition, MYC overexpression has been shown to promote fatty acid oxidation in triple negative (TN) breast cancer (32). Moreover, RAS can simultaneously activate glycolysis and OXPHOS (33). It is likely that cancer cells can be in the hybrid phenotype when the effects of the excessive production of ROS or the activation of the oncogenes outweigh the mutual inhibitions between AMPK and HIF-1.
Quantification of Metabolic State by the Activities of AMPK and HIF-1
To validate the metabolic circuit model, we performed an extensive data analysis on the Cancer Genome Atlas (TCGA) data from eight cancer types. Here we quantified the activities of AMPK and HIF-1 by evaluating the expression of downstream targets of both AMPK and HIF-1 (a total of 33 genes for AMPK, and 23 genes for HIF-1, see SI Section 7 for details). For each cancer type, we performed principal component analysis (PCA) on the RNA-seq data independently for either the AMPK downstream genes or the HIF-1 downstream genes, from which we assigned the first principal component as the axis to quantify the activities of AMPK or HIF-1. The AMPK or the HIF-1 axes (signatures) derived from different cancer types are surprisingly similar (Table S7–8, Figure S3), indicating the consistent regulatory functions of AMPK and HIF-1 across these tissues and cancer types. Most of the genes have positive contributions to the respective principal component (Figure S4), indicating that they are positively regulated by AMPK or HIF-1. For a few genes that have substantial negative contributions, we identified experimental evidence for the negative regulation (Table S9).
Strikingly, even though the AMPK and HIF-1 gene sets are independent and the corresponding principal axes were obtained independently, we observed strong anti-correlations between the HIF-1 and AMPK activities for several major cancer types - liver hepatocellular carcinoma (HCC), lung adenocarcinoma (LUAD), breast invasive carcinoma (Figure 5A–C). We obtained similar results for three other types of cancer – stomach adenocarcinoma, acute myeloid leukemia and pancreatic adenocarcinoma (PAC) (Figure S5A–C), but not in clear cell renal cell carcinoma (CCRCC), prostate adenocarcinoma and colorectal adenocarcinoma (Figure S5D–F). From the data analysis, we observed a spectrum of cases with ‘W’, ‘W/O’ and ‘O’ phenotypes. Notably, we did not observe two clearly separated clusters representing glycolysis and OXPHOS respectively; therefore, the AMPK and HIF-1 activities are strongly anti-correlated but not mutually exclusive in cancer. However, the TCGA data analysis was not sufficient to explain the existence of the hybrid ‘W/O’ state due to the mixture of normal and cancer cells in the tissues and possible heterogeneity of metabolic states in the cell populations. Thus, we looked into single-cell RNA-seq data of LUAD (34), which shows a similar anti-correlation between the AMPK and HIF-1 activities and mainly a bimodal distribution with substantial amount of hybrid cells (Figure 5D, see Figure S8–11 for more details on the single-cell RNA-seq data analysis). This finding suggests that the hybrid metabolic phenotype can also be observed for individual cancer cell.
Figure 5. Evaluation of the AMPK and HIF-1 activities using TCGA patient data and single-cell RNA-seq data of lung adenocarcinoma.
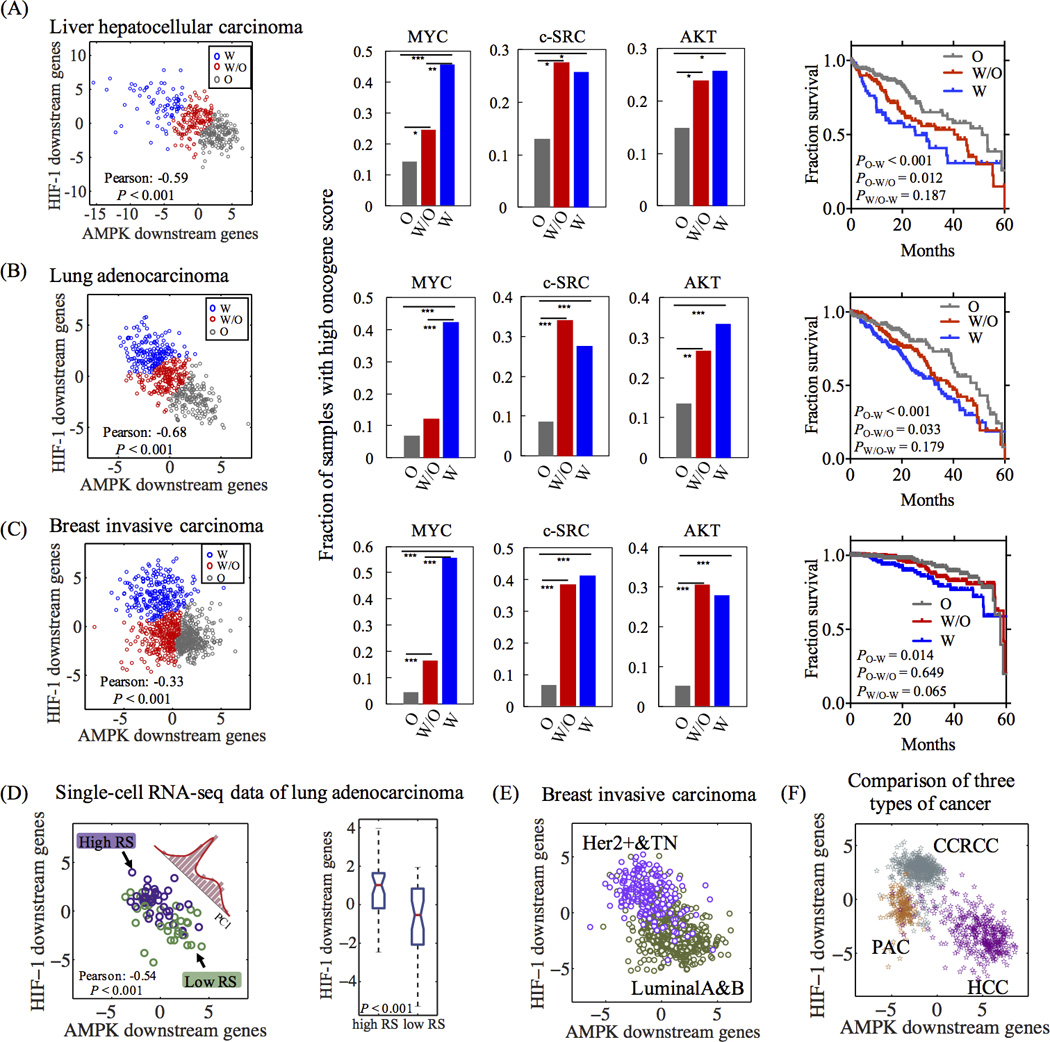
In (A) (HCC, n=373), (B) (LUAD, n=517) and (C) breast invasive carcinoma (n=971), left panels: each point represents the AMPK and HIF-1 activities of one sample. For each data set, the standard k-mean analysis was applied to group the cases into the ‘W’, ‘W/O’ and ‘O’ states. Middle panels: the fraction of the top 20% samples with high oncogene activities in each metabolic group (‘W’, ‘W/O’ and ‘O’). Chi-Square test was used to test the significance (See SI section 10). ‘*’ represents P value < 0.05, ‘**’ represents P value < 0.01, ‘***’ represents P value < 0.001. Right panels: Kaplan-Meier (KM) overall survival curves of patients that were stratified by their metabolic states. (D) Evaluating the AMPK and HIF-1 activities of single LUAD cells (n = 77). Left panel: each point represents the AMPK and HIF-1 activities of a single cell. Histogram represents the distribution of single cells projected to the first principal component of their AMPK and HIF-1 signatures. Three Gaussians are required to fit to the histogram (Figure S11). Right panel: Box plot for HIF-1 activity. Evaluation the AMPK and HIF-1 activities of luminal A (n=531), luminal B (n=135), HER2+ (n=36) and TN (n=141) breast carcinoma (E), and HCC (n=373), CCRCC (n=534) and PAC (n=179) from TCGA (F) (See SI section 7 for details of methods).
Next, we applied the AMPK and HIF-1 signatures to evaluate the metabolic activities of different subtypes of breast carcinoma and different types of tumors across TCGA. HER2+ and triple negative (TN) breast tumors clearly show higher HIF-1 activity and lower AMPK activity than luminal tumors (Figure 5E), consistent with the experimental observation that TN cells are more dependent on glycolysis than luminal cells (35). PAC and CCRCC show higher HIF-1 activity and lower AMPK activity compared with HCC (Figure 5F, Figure S6), consistent with experimental observations (see Figure S6 for details).
For each of the three cancer types shown in Fig. 5A–C, we further evaluated the activities of the oncogenic pathways in samples with various metabolic phenotypes. First, each cancer sample was assigned a metabolic state (‘W’, ‘W/O’ and ‘O’) by k-mean clustering analysis of the whole data set (left panels in Figure 5). The activities of the oncogenic pathways (MYC, c-SRC and AKT) were quantified by the oncogenic scores derived experimentally in previous studies (See SI section 8 for details regarding the calculation of the oncogene score (36)). The classification and scoring methods allow us to evaluate the enrichment of samples with high oncogenic activity for each metabolic phenotype (Figure 5A–C). Interestingly, high MYC activity was observed to be enriched in the ‘W’ phenotype, whereas high c-SRC and AKT (representing RAS) activities are enriched in both the ‘W’ and the ‘W/O’ phenotypes. Low oncogenic activity is associated with the ‘O’ phenotype and low RS group (better prognosis) (34) of single LUAD cells (Figure S7–Figure S8). These results are consistent with the modeling results and experimental evidence discussed in the previous section. Moreover, we evaluated the 5-year overall survival rates for different metabolism phenotypes and found that patient samples in ‘O’ phenotype are significantly correlated with better survival results compared with patients’ samples in either ‘W’ or ‘W/O’ (Figure 5A–C). Consistently, single LUAD cells with higher risk scores (worse prognosis) (34) maintain higher HIF-1 activity (Figure 5D). Thus, we believe that our HIF-1 and AMPK signatures provide an easy and reliable scoring method to quantify the metabolic states of glycolysis and OXPHOS based on RNA-seq data from both bulk tumors and single cells.
The Advantages of the Hybrid Metabolic Phenotype and Experimental Support
We argue that cancer cells in the ‘W/O’ hybrid state can have a significant advantage in supporting their survival, proliferation and metastasis. First, cells in the hybrid state have higher metabolic plasticity to better adapt to various microenvironments, such as hypoxia and acidic conditions, because these cells are flexible in their use of available nutrients, such as glucose and fatty acids, to produce energy. Second, the hybrid state allows cancer cells to efficiently produce energy by both OXPHOS and glycolysis while at the same time using lactate and pyruvate, the byproducts of glycolysis, to generate biomass for cell proliferation (7). Third, cells in the hybrid state can modulate ROS at a moderate level, so that cells can take advantage of ROS signaling (20, 37) to promote metastasis meanwhile avoid excessive DNA damage (38). Here, ROS scavenging is achieved by pyruvate and NADPH, the byproducts of glycolysis and fatty-acid oxidation, respectively. Fourth, the hybrid state might be specifically associated with metastasis, as suggested by some experimental evidence listed below. In summary, cancer cells at the hybrid metabolic phenotype have advantage in multiple aspects over cells with either the ‘W’ or the ‘O’ phenotypes.
Our metabolic circuit model is consistent with many recent observations that, although glycolysis is a typical feature of cancer cells, mitochondrial respiration plays a crucial role in tumor invasion and metastasis (9, 16–21, 39). It has been observed that some aggressive tumor cells, such as SiHa and HeLa, have not only oxidative respiration but also glycolysis due to stronger HIF-1 activation from lactate (21). Moreover, the inhibition of the mitochondrial respiratory chain contributes to the reduction of multidrug resistance of slow cycling melanoma cells (14). It has also been shown that the surviving pancreatic cancer cells after doxycycline withdrawal depend on OXPHOS and are highly sensitive to OXPHOS inhibitors (13). Also, the super-metastatic tumor cells obtained by experimental selection in vitro (SiHa-F3 cells) and in vivo (B16F10 and B16-M1 to M5 tumor cells) have increased OXPHOS with higher ROS production (20). TGF-β1 treatment of non-small lung carcinoma A459 cells induces metastasis, and they were found to have decreased fatty acid synthesis and increased oxygen consumption (11). The inhibition of OXPHOS by graphene for multiple cancer cells, including breast cancer cells and hepatocellular carcinoma cells, can effectively inhibit tumor migration and invasion (39). In the context of 4T1 mammary epithelial cancer cells, PGC-1α promotes metastasis through activating mitochondrial biogenesis and OXPHOS (10). The breast cancer cells can also shift from glycolysis to mitochondrial OXPHOS after radiation exposure to generate more ATP for survival (16). A detailed list of these experimental findings is presented in Table S1. These data taken together indicates a critical role of OXPHOS in tumorigenesis, and supports our prediction of the hybrid ‘W/O’ state. Our model and its experimental support suggest that the hybrid metabolic phenotype could be a good target for metabolic drugs.
Modeling Therapeutic Strategies Targeting Cancer Metabolism
It has been shown that targeting cellular metabolism is a promising strategy for fighting against cancer (30) (details in Table S10). Certain metabolic drugs have been shown to be effective in treating cancers in some cases. These drugs, for example, S-trans, trans-Farnesylthiosalicylic Acid (FTS) (40), 2-Deoxy-D-Glucose (2DG) (41), 3-Bromopyruvate (3BP) (42), metformin (43) and AICAR (44), typically target glycolysis or mitochondrial OXPHOS. It has also been suggested that combinations of different drugs could prove more effective (40, 45, 46). For example, administrating metformin and 2DG together can induce massive ATP depletion in cancer cells and further trigger cellular processes to induce cell death, such as autophagy or p53-dependent apoptosis (45). Often, metabolic drugs work well in some cases but not in others, and the underlying mechanisms are not completely understood. Here we propose that these therapeutic strategies might be effective partly because they target the hybrid metabolic phenotype of cancer cells. An effective treatment outcome could be achieved by shifting the metabolic phenotype from the hybrid state to the other allowed states of the cancer cells. By doing so, the drugs might sensitize the cancer cells, therefore, other therapies, such as chemotherapy, can be more effective in killing the cancer cells.
We evaluated the dynamic response of the AMPK:HIF-1:ROS circuit to various treatment strategies, each of which exerts its own regulatory mechanism on the circuit (See SI section 9 for details). In particular, hyperbaric oxygen therapy can effectively reduce hypoxia and accelerate degradation of HIF-1; 3BP, similar to 2DG, targets the glycolytic enzymes such as glucose transporters (GLUTs) and hexokinase (HK), thus effectively reducing cellular glycolysis; metformin activates AMPK, inhibits ETC Complex-1, and inhibits mTOR in an AMPK independent manner, which further inhibits HIF-1. The effective circuit diagrams for each case are shown in Figure 6, and details of the modeling procedures are shown in SI section 5 with the relevant parameters given in Table S11. The model allows us to calculate the steady states and simulate the time course of the levels of pAMPK, HIF-1 and ROS. We are especially interested in how different treatments drive phenotypic transitions among different metabolic states.
Figure 6. The bifurcation diagrams of the levels of pAMPK in response to the oxygen level in the hyperbaric oxygen therapy (A), 3BP level (B), metformin level (C) and combined 3BP and metformin therapy (D).
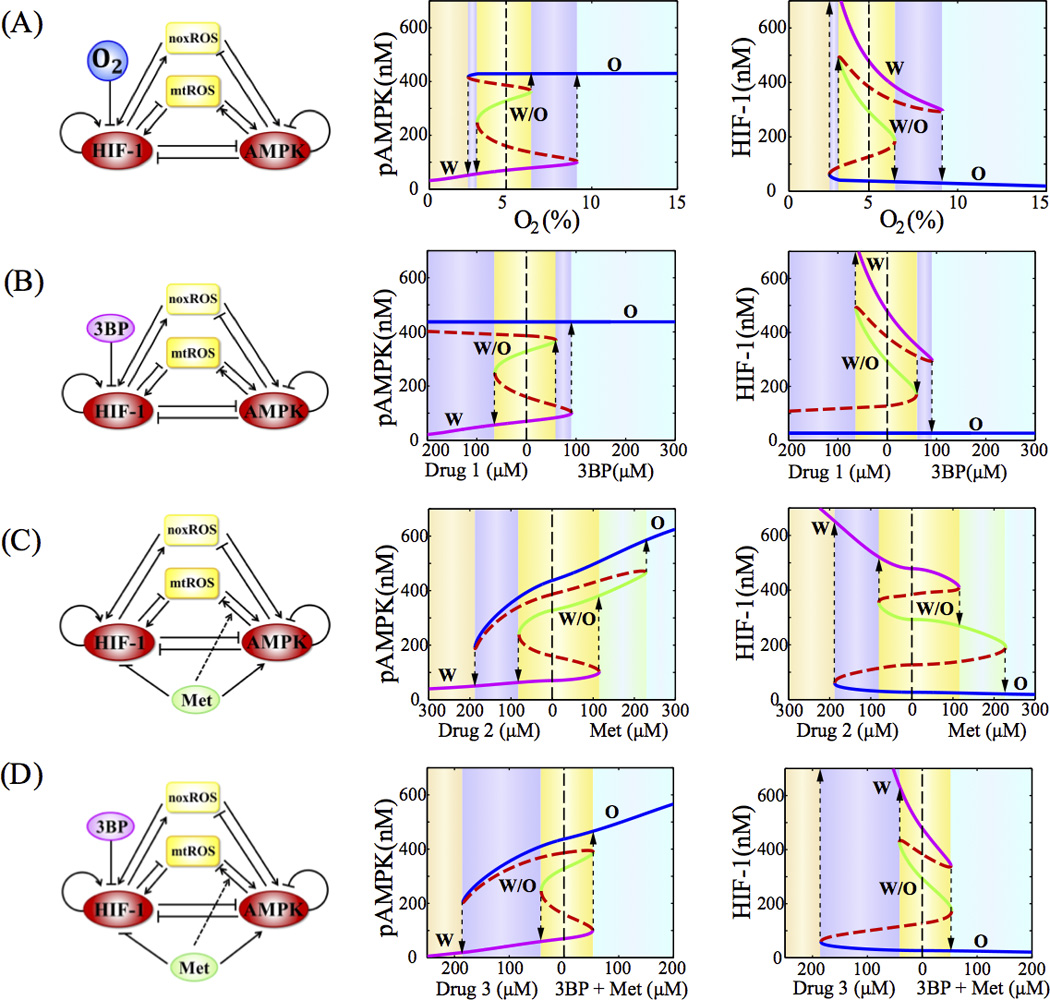
In (A), the normal condition of oxygen level is 5%. In (B–D), the drug (1/2/3) represents a hypothetic signal with opposite effect of the corresponding drug(s). In (A)–(D), blue, green and magenta solid lines represent phenotype ‘O’, ‘W/O’ and ‘W’ respectively. The red dashed lines represent the unstable steady states. The dashed lines with arrows indicate transitions between two phenotypes. Different background colors represent different phases.
A Comparison of Possible Metabolic Therapies
Starting from the model where cancer cells have the ‘W’, the ‘W/O’ and the ‘O’ states, we evaluated the effects of various treatment strategies on allowing the cell to escape from the tristability of the metabolic circuit. Each of the panel of Figure 6A–D shows the bifurcation diagram of the levels of pAMPK and HIF-1 with respect to the level of the drugs, for each treatment. The results show that these treatment strategies can shift the cancer metabolism from the tristable phase to the monostable phase (‘O’) by increasing the dose level.
From the bifurcation analysis, metformin is less effective compared to the hyperbaric oxygen therapy and 3BP. The inefficiency of metformin is caused by the decrease of mitochondrial potential and increase of mtROS production by the drug (46). Various treatment strategies were further evaluated by simulating the time course of the levels of pAMPK, HIF-1 and ROS (Figure S12–15). We assume that an effective therapy needs to drive cancer cells away from the hybrid states. We found that the administration of metformin alone is less effective in avoiding the hybrid state, while the combined therapies are more effective. The prediction is consistent with the finding that, in human gastric and esophageal cell lines, the administration of both metformin and 2DG (whose effect is similar to 3BP) is more effective than the administration of each drug alone (46).
Discussions
In this study, we established a theoretical framework for modeling genetic regulation of cancer metabolism. By integrating existent data, a network was constructed that features the regulation of mitochondrial OXPHOS and glycolysis by both regulatory protein and metabolites. We further coarse-grained the network into a core regulatory circuit that is composed of HIF-1, AMPK and ROS. Although we made several simplifications, the reduced circuit was still sufficient to capture regulation of both glycolysis and OXPHOS, as well as the major differences in metabolism between normal and cancer cells. Since the regulatory links in the core circuit are supported by multiple experiments (Table S1), the circuit model is expected to be robust for studying the behavior of glycolysis and OXPHOS.
Normal cells typically use either OXPHOS or glycolysis at a fixed time depending on the availability of energy sources, because of tight regulation of the metabolic circuit and the competition between different metabolic modes. Cancer cells, however, kidnap the same gene regulatory circuit of metabolism for their own advantage. Because of either high energetic and oxidative stresses or the activation of specific oncogenes, cancer cells can be in a hybrid metabolic phenotype utilizing both glycolysis and OXPHOS. Since cells in the hybrid ‘W/O’ state have increased plasticity, they could have an advantage in survival over cells with the other phenotypes. The modeling results are supported by the TCGA patient data from multiple cancer types. The model also explains the phenomenon of oxygen shock (47). Cells that largely rely on glycolysis are exposed to large amount of oxygen when they reach the blood vessel. These cells could switch the metabolic phenotype to the ‘W/O’ state, which further induces metastasis (10). In future work, the landscape approach (48, 49) could be utilized to quantify the transition processes among glycolysis, OXPHOS and hybrid metabolism phenotypes. Note that, in addition to the use of glycolysis and OXPHOS, cancer cells can also utilize glutamine as a nitrogen source (5), while cancer-associated fibroblasts can perform glycolysis to fuel cancer cells by producing lactate, known as reverse Warburg effects (50). These aspects are out of the scope of this current study, but they are worth further investigation by using modeling approach.
To help test the basic motions of our core circuit model, we developed two metabolic signatures, one for glycolysis based on the expressions of HIF-1 downstream genes and the other for OXPHOS based on the expression of AMPK downstream genes. These metabolic signatures were applied to distinguish patient samples from multiple cancer types or single cells with different metabolic phenotypes, to identify the anti-correlations between the AMPK and HIF-1 activities, and to elucidate the association of oncogenic pathways with the metabolic states. In general, we expect these metabolic signatures to be a powerful tool to predict the metabolic phenotypes of cancer cells directly from gene expression data.
We proposed to design metabolic therapies by considering the hybrid metabolic phenotype (W/O). A putative strategy would be to drive cancer cells away from the hybrid states. Guided by this assumption, we evaluated the effectiveness of several therapeutic strategies by model simulation. We found that therapy using metformin is more likely to drive cells into the hybrid metabolic phenotype during the treatment time-course than the therapies using glycolysis blockers, such as 3BP and 2DG. Our model also provides an explanation of why some combined therapies are more effective (45, 46), because these therapies are efficient in driving cells out of the hybrid state.
Supplementary Material
Acknowledgments
Financial Support:
J.N. Onuchic and H. Levine have been awarded the Physics Frontiers Center NSF grant PHY-1427654.
H. Levine have been awarded the NSF grant DMS-1361411.
J.N. Onuchic and H. Levine have been awarded the Cancer Prevention and Research Institute of Texas (CPRIT) grants R1110 and R1111, respectively.
M. Lu had a training fellowship from the Keck Center for Interdisciplinary Bioscience Training of the Gulf Coast Consortia (CPRIT Grant RP140113).
E. Ben-Jacob was also supported by the Tauber Family Funds and the Maguy-Glass Chair in Physics of Complex Systems.
J.M. thanks support from the National Institutes of Health (R01-GM067801, R01-GM116280), and the Welch Foundation (Q-1512).
B.A. Kaipparettu has been awarded by the National Cancer Institute (NCI) grants R21CA173150 and R21CA179720.
Footnotes
The authors declare no conflict of interest.
Reference
- 1.Lu M, Jolly MK, Ben-Jacob E. Toward decoding the principles of cancer metastasis circuits. Cancer Research. 2014;74:4574–4587. doi: 10.1158/0008-5472.CAN-13-3367. [DOI] [PubMed] [Google Scholar]
- 2.Lu M, Jolly MK, Gomoto R, Huang B, Onuchic J, Ben-Jacob E. Tristability in cancer-associated microRNA-TF chimera toggle switch. The Journal of Physical Chemistry B. 2013;117:13164–13174. doi: 10.1021/jp403156m. [DOI] [PubMed] [Google Scholar]
- 3.Hanahan D, Weinberg RA. Hallmarks of cancer: the next generation. Cell. 2011;144:646–674. doi: 10.1016/j.cell.2011.02.013. [DOI] [PubMed] [Google Scholar]
- 4.Boroughs LK, DeBerardinis RJ. Metabolic pathways promoting cancer cell survival and growth. Nature Cell Biology. 2015 doi: 10.1038/ncb3124. [DOI] [PMC free article] [PubMed] [Google Scholar]
- 5.Pavlova NN, Thompson CB. The Emerging Hallmarks of Cancer Metabolism. Cell Metabolism. 2016;23:27–47. doi: 10.1016/j.cmet.2015.12.006. [DOI] [PMC free article] [PubMed] [Google Scholar]
- 6.Warburg O. On the origin of cancer cells. Science. 1956;123:309–314. doi: 10.1126/science.123.3191.309. [DOI] [PubMed] [Google Scholar]
- 7.Vander Heiden MG, Cantley LC, Thompson CB. Understanding the Warburg effect: the metabolic requirements of cell proliferation. Science. 2009;324:1029–1033. doi: 10.1126/science.1160809. [DOI] [PMC free article] [PubMed] [Google Scholar]
- 8.Hsu PP, Sabatini DM. Cancer cell metabolism: Warburg and beyond. Cell. 2008;134:703–707. doi: 10.1016/j.cell.2008.08.021. [DOI] [PubMed] [Google Scholar]
- 9.Mathupala SP, Ko YH, Pedersen PL. The pivotal roles of mitochondria in cancer: Warburg and beyond and encouraging prospects for effective therapies. Biochimica et Biophysica Acta (BBA)-Bioenergetics. 2010;1797:1225–1230. doi: 10.1016/j.bbabio.2010.03.025. [DOI] [PMC free article] [PubMed] [Google Scholar]
- 10.LeBleu VS, O’Connell JT, Herrera KNG, Wikman H, Pantel K, Haigis MC, et al. PGC-1α mediates mitochondrial biogenesis and oxidative phosphorylation in cancer cells to promote metastasis. Nature Cell Biology. 2014;16:992–1003. doi: 10.1038/ncb3039. [DOI] [PMC free article] [PubMed] [Google Scholar]
- 11.Jiang L, Xiao L, Sugiura H, Huang X, Ali A, Kuro-o M, et al. Metabolic reprogramming during TGFβ1-induced epithelial-to-mesenchymal transition. Oncogene. 2014;34:3908–3916. doi: 10.1038/onc.2014.321. [DOI] [PMC free article] [PubMed] [Google Scholar]
- 12.Viale A, Corti D, Draetta GF. Tumors and Mitochondrial Respiration: A Neglected Connection. Cancer Research. 2015;75:3687–3691. doi: 10.1158/0008-5472.CAN-15-0491. [DOI] [PubMed] [Google Scholar]
- 13.Viale A, Pettazzoni P, Lyssiotis CA, Ying H, Sánchez N, Marchesini M, et al. Oncogene Ablation-resistant Pancreatic Cancer Cells Depend on Mitochondrial Function. Nature. 2014;514:628–632. doi: 10.1038/nature13611. [DOI] [PMC free article] [PubMed] [Google Scholar]
- 14.Roesch A, Vultur A, Bogeski I, Wang H, Zimmermann KM, Speicher D, et al. Overcoming intrinsic multidrug resistance in melanoma by blocking the mitochondrial respiratory chain of slow-cycling JARID1B high cells. Cancer Cell. 2013;23:811–825. doi: 10.1016/j.ccr.2013.05.003. [DOI] [PMC free article] [PubMed] [Google Scholar]
- 15.Strohecker AM, White E. Targeting mitochondrial metabolism by inhibiting autophagy in BRAF-driven cancers. Cancer Discovery. 2014;4:766–772. doi: 10.1158/2159-8290.CD-14-0196. [DOI] [PMC free article] [PubMed] [Google Scholar]
- 16.Lu C-L, Qin L, Liu H-C, Candas D, Fan M, Li JJ. Tumor Cells Switch to Mitochondrial Oxidative Phosphorylation under Radiation via mTOR-Mediated Hexokinase II Inhibition-A Warburg-Reversing Effect. PloS One. 2015:10. doi: 10.1371/journal.pone.0121046. [DOI] [PMC free article] [PubMed] [Google Scholar]
- 17.Maiuri MC, Kroemer G. Essential Role for Oxidative Phosphorylation in Cancer Progression. Cell Metabolism. 2015;21:11–12. doi: 10.1016/j.cmet.2014.12.013. [DOI] [PubMed] [Google Scholar]
- 18.Tan AS, Baty JW, Dong L-F, Bezawork-Geleta A, Endaya B, Goodwin J, et al. Mitochondrial genome acquisition restores respiratory function and tumorigenic potential of cancer cells without mitochondrial DNA. Cell Metabolism. 2015;21:81–94. doi: 10.1016/j.cmet.2014.12.003. [DOI] [PubMed] [Google Scholar]
- 19.Xu Q, Biener-Ramanujan E, Yang W, Ramanujan VK. Targeting metabolic plasticity in breast cancer cells via mitochondrial complex I modulation. Breast Cancer Research and Treatment. 2015;150:43–56. doi: 10.1007/s10549-015-3304-8. [DOI] [PMC free article] [PubMed] [Google Scholar]
- 20.Porporato PE, Payen VL, Pérez-Escuredo J, De Saedeleer CJ, Danhier P, Copetti T, et al. A mitochondrial switch promotes tumor metastasis. Cell Reports. 2014;8:754–766. doi: 10.1016/j.celrep.2014.06.043. [DOI] [PubMed] [Google Scholar]
- 21.De Saedeleer CJ, Copetti T, Porporato PE, Verrax J, Feron O, Sonveaux P. Lactate activates HIF-1 in oxidative but not in Warburg-phenotype human tumor cells. PloS One. 2012;7:e46571. doi: 10.1371/journal.pone.0046571. [DOI] [PMC free article] [PubMed] [Google Scholar]
- 22.Qutub AA, Popel AS. Reactive oxygen species regulate hypoxia-inducible factor 1α differentially in cancer and ischemia. Molecular and Cellular Biology. 2008;28:5106–5119. doi: 10.1128/MCB.00060-08. [DOI] [PMC free article] [PubMed] [Google Scholar]
- 23.Yizhak K, Le Dévédec SE, Rogkoti VM, Baenke F, Boer VC, Frezza C, et al. A computational study of the Warburg effect identifies metabolic targets inhibiting cancer migration. Molecular Systems Biology. 2014:10. doi: 10.15252/msb.20134993. [DOI] [PMC free article] [PubMed] [Google Scholar]
- 24.Pannala VR, Dash RK. Mechanistic characterization of the thioredoxin system in the removal of hydrogen peroxide. Free Radical Biology and Medicine. 2015;78:42–55. doi: 10.1016/j.freeradbiomed.2014.10.508. [DOI] [PMC free article] [PubMed] [Google Scholar]
- 25.Robertson-Tessi M, Gillies RJ, Gatenby RA, Anderson AR. Impact of Metabolic Heterogeneity on Tumor Growth, Invasion, and Treatment Outcomes. Cancer Research. 2015;75:1567–1579. doi: 10.1158/0008-5472.CAN-14-1428. [DOI] [PMC free article] [PubMed] [Google Scholar]
- 26.Hwang AB, Ryu E-A, Artan M, Chang H-W, Kabir MH, Nam H-J, et al. Feedback regulation via AMPK and HIF-1 mediates ROS-dependent longevity in Caenorhabditis elegans. Proceedings of the National Academy of Sciences. 2014;111:E4458–E4467. doi: 10.1073/pnas.1411199111. [DOI] [PMC free article] [PubMed] [Google Scholar]
- 27.Dang CV. Rethinking the Warburg effect with Myc micromanaging glutamine metabolism. Cancer Research. 2010;70:859–862. doi: 10.1158/0008-5472.CAN-09-3556. [DOI] [PMC free article] [PubMed] [Google Scholar]
- 28.Plas DR, Thompson CB. Cell metabolism in the regulation of programmed cell death. Trends in Endocrinology & Metabolism. 2002;13:75–78. doi: 10.1016/s1043-2760(01)00528-8. [DOI] [PubMed] [Google Scholar]
- 29.Caino MC, Ghosh JC, Chae YC, Vaira V, Rivadeneira DB, Faversani A, et al. PI3K therapy reprograms mitochondrial trafficking to fuel tumor cell invasion. Proceedings of the National Academy of Sciences. 2015;112:8638–8643. doi: 10.1073/pnas.1500722112. [DOI] [PMC free article] [PubMed] [Google Scholar]
- 30.Zhao Y, Butler E, Tan M. Targeting cellular metabolism to improve cancer therapeutics. Cell Death & Disease. 2013;4:e532. doi: 10.1038/cddis.2013.60. [DOI] [PMC free article] [PubMed] [Google Scholar]
- 31.Park JH, Vithayathil S, Kumar S, Sung P-L, Dobrolecki LE, Putluri V, et al. Fatty Acid Oxidation-Driven Src Links Mitochondrial Energy Reprogramming and Oncogenic Properties in Triple-Negative Breast Cancer. Cell Reports. 2016;14:2154–2165. doi: 10.1016/j.celrep.2016.02.004. [DOI] [PMC free article] [PubMed] [Google Scholar]
- 32.Camarda R, Zhou AY, Kohnz RA, Balakrishnan S, Mahieu C, Anderton B, et al. Inhibition of fatty acid oxidation as a therapy for MYC-overexpressing triple-negative breast cancer. Nature Medicine. 2016;22:427–432. doi: 10.1038/nm.4055. [DOI] [PMC free article] [PubMed] [Google Scholar]
- 33.Telang S, Lane AN, Nelson KK, Arumugam S, Chesney J. The oncoprotein H-Ras V12 increases mitochondrial metabolism. Molecular Cancer. 2007;6:77. doi: 10.1186/1476-4598-6-77. [DOI] [PMC free article] [PubMed] [Google Scholar]
- 34.Kim K-T, Lee HW, Lee H-O, Kim SC, Seo YJ, Chung W, et al. Single-cell mRNA sequencing identifies subclonal heterogeneity in anti-cancer drug responses of lung adenocarcinoma cells. Genome Biology. 2015;16:127. doi: 10.1186/s13059-015-0692-3. [DOI] [PMC free article] [PubMed] [Google Scholar]
- 35.McCleland ML, Adler AS, Shang Y, Hunsaker T, Truong T, Peterson D, et al. An integrated genomic screen identifies LDHB as an essential gene for triple-negative breast cancer. Cancer Research. 2012;72:5812–5823. doi: 10.1158/0008-5472.CAN-12-1098. [DOI] [PubMed] [Google Scholar]
- 36.Creighton CJ. Multiple oncogenic pathway signatures show coordinate expression patterns in human prostate tumors. PloS One. 2008;3:e1816. doi: 10.1371/journal.pone.0001816. [DOI] [PMC free article] [PubMed] [Google Scholar]
- 37.Ishikawa K, Takenaga K, Akimoto M, Koshikawa N, Yamaguchi A, Imanishi H, et al. ROS-generating mitochondrial DNA mutations can regulate tumor cell metastasis. Science. 2008;320:661–664. doi: 10.1126/science.1156906. [DOI] [PubMed] [Google Scholar]
- 38.Piskounova E, Agathocleous M, Murphy MM, Hu Z, Huddlestun SE, Zhao Z, et al. Oxidative stress inhibits distant metastasis by human melanoma cells. Nature. 2015:186–191. doi: 10.1038/nature15726. [DOI] [PMC free article] [PubMed] [Google Scholar]
- 39.Zhou H, Zhang B, Zheng J, Yu M, Zhou T, Zhao K, et al. The inhibition of migration and invasion of cancer cells by graphene via the impairment of mitochondrial respiration. Biomaterials. 2014;35:1597–1607. doi: 10.1016/j.biomaterials.2013.11.020. [DOI] [PubMed] [Google Scholar]
- 40.Goldberg L, Israeli R, Kloog Y. FTS and 2-DG induce pancreatic cancer cell death and tumor shrinkage in mice. Cell Death & Disease. 2012;3:e284. doi: 10.1038/cddis.2012.24. [DOI] [PMC free article] [PubMed] [Google Scholar]
- 41.Wang Q, Liang B, Shirwany NA, Zou M-H. 2-Deoxy-D-glucose treatment of endothelial cells induces autophagy by reactive oxygen species-mediated activation of the AMP-activated protein kinase. PloS One. 2011;6:e17234. doi: 10.1371/journal.pone.0017234. [DOI] [PMC free article] [PubMed] [Google Scholar]
- 42.Ganapathy-Kanniappan S, Vali M, Kunjithapatham R, Buijs M, Syed L, Rao P, et al. 3-bromopyruvate: a new targeted antiglycolytic agent and a promise for cancer therapy. Current Pharmaceutical Biotechnology. 2010;11:510–517. doi: 10.2174/138920110791591427. [DOI] [PubMed] [Google Scholar]
- 43.Dowling RJ, Goodwin PJ, Stambolic V. Understanding the benefit of metformin use in cancer treatment. BMC Medicine. 2011;9:33. doi: 10.1186/1741-7015-9-33. [DOI] [PMC free article] [PubMed] [Google Scholar]
- 44.Jose C, Hébert-Chatelain E, Bellance N, Larendra A, Su M, Nouette-Gaulain K, et al. AICAR inhibits cancer cell growth and triggers cell-type distinct effects on OXPHOS biogenesis, oxidative stress and Akt activation. Biochimica et Biophysica Acta (BBA)-Bioenergetics. 2011;1807:707–718. doi: 10.1016/j.bbabio.2010.12.002. [DOI] [PubMed] [Google Scholar]
- 45.Sahra IB, Laurent K, Giuliano S, Larbret F, Ponzio G, Gounon P, et al. Targeting cancer cell metabolism: the combination of metformin and 2-deoxyglucose induces p53-dependent apoptosis in prostate cancer cells. Cancer Research. 2010;70:2465–2475. doi: 10.1158/0008-5472.CAN-09-2782. [DOI] [PubMed] [Google Scholar]
- 46.Cheong J-H, Park ES, Liang J, Dennison JB, Tsavachidou D, Nguyen-Charles C, et al. Dual inhibition of tumor energy pathway by 2-deoxyglucose and metformin is effective against a broad spectrum of preclinical cancer models. Molecular Cancer Therapeutics. 2011;10:2350–2362. doi: 10.1158/1535-7163.MCT-11-0497. [DOI] [PMC free article] [PubMed] [Google Scholar]
- 47.Mantel CR, O’Leary HA, Chitteti BR, Huang X, Cooper S, Hangoc G, et al. Enhancing hematopoietic stem cell transplantation efficacy by mitigating oxygen shock. Cell. 2015;161:1553–1565. doi: 10.1016/j.cell.2015.04.054. [DOI] [PMC free article] [PubMed] [Google Scholar]
- 48.Li C, Wang J. Quantifying the landscape for development and cancer from a core cancer stem cell circuit. Cancer Research. 2015;75:2607–2618. doi: 10.1158/0008-5472.CAN-15-0079. [DOI] [PubMed] [Google Scholar]
- 49.Li C, Wang J. Quantifying the underlying landscape and paths of cancer. Journal of The Royal Society Interface. 2014;11:20140774. doi: 10.1098/rsif.2014.0774. [DOI] [PMC free article] [PubMed] [Google Scholar]
- 50.Pavlides S, Whitaker-Menezes D, Castello-Cros R, Flomenberg N, Witkiewicz AK, Frank PG, et al. The reverse Warburg effect: aerobic glycolysis in cancer associated fibroblasts and the tumor stroma. Cell Cycle. 2009;8:3984–4001. doi: 10.4161/cc.8.23.10238. [DOI] [PubMed] [Google Scholar]
Associated Data
This section collects any data citations, data availability statements, or supplementary materials included in this article.