Abstract
Alanine aminotransferase (AlaAT, E.C.2.6.1.2) catalyzes the reversible conversion of pyruvate and glutamate to alanine and α-oxoglutarate. The AlaAT gene family has been well studied in some herbaceous plants, but has not been well characterized in woody plants. In this study, we identified four alanine aminotransferase homologues in Populus trichocarpa, which could be classified into two subgroups, A and B. AlaAT3 and AlaAT4 in subgroup A encode AlaAT, while AlaAT1 and AlaAT2 in subgroup B encode glutamate:glyoxylate aminotransferase (GGAT), which catalyzes the reaction of glutamate and glyoxylate to α-oxoglutarate and glycine. Four AlaAT genes were cloned from P. simonii × P. nigra. PnAlaAT1 and PnAlaAT2 were expressed predominantly in leaves and induced by exogenous nitrogen and exhibited a diurnal fluctuation in leaves, but was inhibited in roots. PnAlaAT3 and PnAlaAT4 were mainly expressed in roots, stems and leaves, and was induced by exogenous nitrogen. The expression of PnAlaAT3 gene could be regulated by glutamine or its related metabolites in roots. Our results suggest that PnAlaAT3 gene may play an important role in nitrogen metabolism and is regulated by glutamine or its related metabolites in the roots of P. simonii × P. nigra.
Nitrogen is an essential nutrient element for plant growth. The use of nitrogen directly affects plant growth and development, biomass and grain yield. Poplar has great potential applications in CO2 mitigation and biofuel production1, and is perhaps more often used for pulpwood and nowdays as a biomass crop2. Poplar can exchange N with the environment by opening or closing the N cycle3, and thus plays a critical role in the ecosystem N cycle3,4. However, usually acting as a shelter forest, poplar is often established on marginal lands where the soil N is limited5. To achieve sustainable high productivity and decrease N fertilization, it is important to obtain a better understanding of the molecular regulatory mechanisms of N utilization.
Nitrate (NO3−) and ammonium (NH4+) are the main sources of inorganic N in the soil. They can be absorbed by roots through at least two transport systems6,7. NO3− is transported into roots by nitrate transporters (NRT), and then reduced to NH4+ by nitrate reductase (NR) and nitrite reductase (NiR). NH4+ is transported into roots by ammonium transporters (AMT), assimilated into glutamine and glutamate through the glutamine synthetase (GS) and glutamate synthase (GOGAT) cycle, and further incorporated into other amino acids by aminotransferase8. NH4+ and NO3− have different effects on plant growth, as the pH of the medium is reduced after NH4+ is absorbed and increased after NO3− is absorbed, which affects the availability of other nutrients9. When NH4+ is supplied as the sole N source, many plants showed negative effects, such as reduced leaf area, relative growth rate and dry matter yield10,11,12. In contrast to NH4+, the presence of NO3− stimulated the germination of dormant seeds of Arabidopsis thaliana13, regulated shoot-root allocation in tobacco and floral induction in A. thaliana14,15 and inhibited root growth of maize16. Many Populus species showed better growth on NO3− than on NH4+3, but some authors have reported a preference for NH4+17. Because different N forms have different effects on plant growth and metabolism, the expression of related plant genes might be altered. It is therefore necessary to study the effects of N forms on the expression of genes in N metabolism.
Alanine aminotransferase (AlaAT, E.C.2.6.1.2) is a pyridoxal phosphate- dependent enzyme that catalyses the reversible conversion of alanine and α-oxoglutarate to pyruvate and glutamate. AlaAT is widely distributed in various plant tissues and organs. It is found to be active not only in leaves, roots and flowers18, but also in other tissues, such as those of fruit19, as well as the inner endosperm tissues of developing rice seeds20. The diverse distribution of AlaAT suggests that it may play important roles in the life cycle of plants. Previous research on AlaAT has mainly focused on its role in hypoxic conditions, which has been characterized in Hordeum vulgare, Medicago truncatula and Arabidopsis thaliana21,22,23. AlaAT transcript levels could be induced by hypoxia22,24,25,26,27. During hypoxia condition induced by waterlogging, AlaAT linked glycolysis and the tricarboxylic acid cycle in Lotus japonicus28. AlaAT is a limiting factor in alanine synthesis under low-oxygen conditions; the primary role of AlaAT1 is to break down alanine when it is in excess in A. thaliana23.
Nevertheless, we are more interested in the role of AlaAT in nitrogen and carbon metabolisms. AlaAT expression is not only regulated by hypoxia but also by light and N49,30. AlaAT has been widely studied using genetic engineering methods in recent years. Over-expression of a barley AlaAT in Brassica napus (canola) and Oryza sativa (rice) increased the yield and biomass of the transgenic plants31,32. The transcriptome of transgenic rice roots and shoots over-expressing alanine aminotransferase under the control of a tissue-specific promoter was not significantly different from that of controls33. Sugarcane lines transformed with barley alanine aminotransferase gene driven by rice aldehyde dehydrogenase gene (OsAnt1) promoter showed improved N use efficiency compared with untransformed ones in a pot trial under low nitrogen conditions34. Recent studies have indicated that the over-expression of AlaAT variants other than barley AlaAT in A. thaliana could further increase the N use efficiency phenotype(s)35.
Studies on the AlaAT gene family have mainly focused on herbaceous plant species. In A. thaliana, four AlaAT genes have been cloned, including AtAlaAT1 and AtAlaAT2 encoding alanine aminotransferase (E.C.2.6.1.2), and AtGGAT1 and AtGGAT2 encoding GGAT (E.C.2.6.1.4) with glutamate:glyoxylate aminotransferase activity18,36. In Glycine max, two subclasses were identified, with each subclass represented by two highly similar members with the same gene structure37. Similarly, four AlaATs were found to be expressed in M. truncatula22. Unlike herbaceous plants, tree species have a long lifespan, long generation times and a perennial woody growth habit38. The N nutrition of trees is sustained by seasonal and internal cycling3. Studying the molecular regulatory mechanisms of N in poplar has great environmental significance. In the present study, we characterized the AlaAT gene family members in P. trichocarpa, and cloned them from P. simonii × P. nigra. We then investigated the expression profile of the PnAlaATs genes by real-time quantitative PCR in leaves, stems and roots of P. simonii × P. nigra supplied with different N sources and light levels. Additionally, the regulation of PnAlaAT3 in roots was studied under treatment with methionine sulfoximine (MSX), an inhibitor of glutamine synthetase.
Results
Identification of AlaAT genes in P. trichocarpa
According to the methods of Wang et al.39 and Chai et al.40, the Hidden Markov Model (HMM) profile “PF00155” was searched against the P. trichocarpa genome to identify AlaAT genes. Four sequences (XM_002315639, XM_002312643, XM_006369021, XM_002304219) located on different chromosomes were found in the P. trichocarpa genome. The total length of each of the four sequences was 1446 bp, encoding 481 amino acids (Table 1).
Table 1. AlaAT gene family in Populus trichocarpa.
| S.N | Name | Accession Number | Chromosome Location | ORF(bp) | Protein Size | Exon Number | Location | E-value |
|---|---|---|---|---|---|---|---|---|
| 1 | PtAlaAT1 | XM_002315639 | Chr10:7600723–7606675 | 1446 | 481 | 13 | 62–461 | 4.8E-38 |
| 2 | PtAlaAT2 | XM_002312643 | Chr08:12932980–12938537 | 1446 | 481 | 13 | 64–461 | 2.2E-140 |
| 3 | PtAlaAT3 | XM_006369021 | Chr01:13606954–13612423 | 1446 | 481 | 16 | 80–468 | 1.6E-38 |
| 4 | PtAlaAT4 | XM_002304219 | Chr03:10141011–10146425 | 1446 | 481 | 15 | 86–468 | 2.2E-34 |
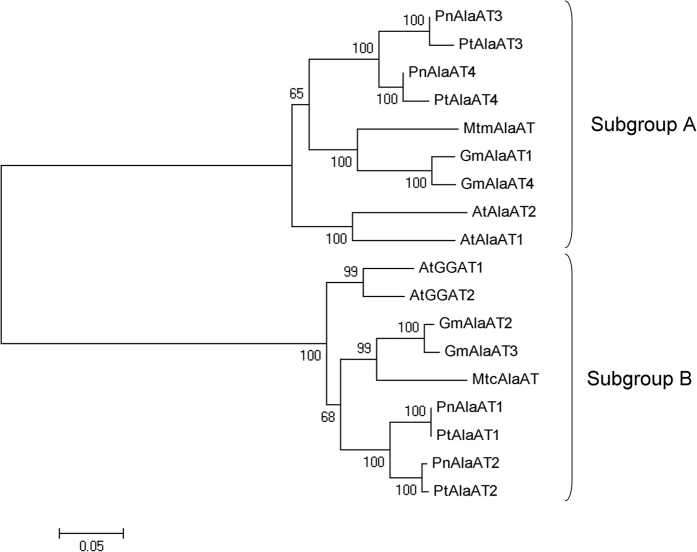
The Populus AlaAT genes had high sequence similarity to the previously characterized AlaAT genes from A. thaliana18, M. truncatula22 and G. max37. We aligned the full-length amino acid sequences of the AlaATs with ClustalW (http://www.ebi.ac.uk/Tools/msa/clustalw2/) (Figure S1). A phylogenetic tree was constructed using the neighbor-joining method and Poisson correction model with the MEGA5 software41. The phylogenetic tree showed that the AlaAT family was clearly separated into two subgroups, with two Populus AlaAT homologues per subgroup (Fig. 1). PtAlaAT1 and PtAlaAT2 were clustered together in subgroup B close to A. thaliana AtGGAT1 and AtGGAT2, whereas PtAlaAT3 and PtAlaAT4 were grouped together in subgroup A close to AtAlaAT1 and AtAlaAT2. PtAlaAT1 and PtAlaAT2 shared the same gene structure, as did PtAlaAT3 and PtAlaAT4 (Fig. 2).
Figure 1. Phylogenetic tree of proteins encoded by AlaAT genes from A. thaliana, G. max, M. truncatula, P. trichocarpa and P. simonii × P. nigra.
Protein sequences were aligned by ClustalW and phylogenetic tree was constructed by MEGA5 using N-J method, with 1000 bootstrap replicates.
Figure 2. Comparison of the intron and exon structure of the four AlaAT genomic sequences identified in P. trichocarpa.
Green boxes- coding exons, red boxes- coding Aminotran_1_2 exons, black lines- introns. All of the poplar AlaAT gene family members had the accordingly conserved Aminotran_1_2 exons.
Regulatory regions in the poplar AlaAT genes
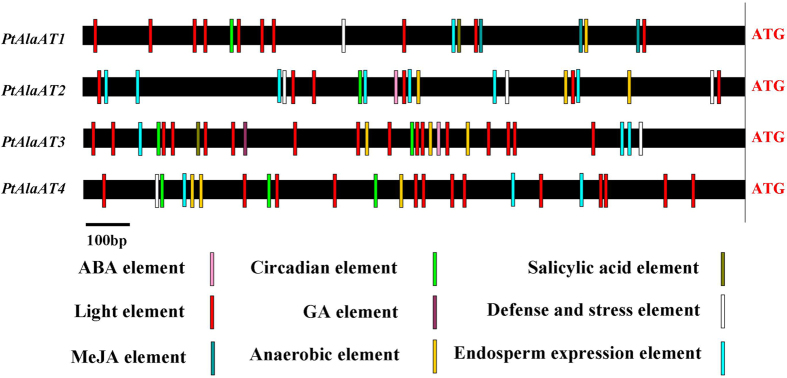
To get insight into the functions of the AlaAT genes in poplar, the putative regulatory elements in their 5′-upstream regions were investigated (Fig. 3). In all four genes, regulatory elements were found to be concentrated in the promoter region about 700–900 bp upstream of the translation initiation site. Abscisic acid (ABA) responsive elements were identified in the promoters of PtAlaAT2 and PtAlaAT3, MeJA-responsive elements were found exclusively in the PtAlaAT1 promoter, a gibberellin-responsive element (GA element) were found only in the PtAlaAT3 promoter, and salicylic acid responsive elements were present in the promoters of PtAlaAT1 and PtAlaAT3. All of the promoters contained anaerobic, circadian control, endosperm expression, defense and stress responsive elements, as well as many light-responsive elements, especially the PtAlaAT3 promoter.
Figure 3. Regulatory regions of the P. trichocarpa AlaAT genes.
The 5′ upstream regions of AlaAT genes are represented. Regulatory elements conserved in each promter are marked by colours. The position of the ATG is marked on the right.
Cloning the cDNAs of AlaAT family genes from P. simonii × P. nigra
Total RNA from mixed samples of roots, stems and leaves from P. simonii × P. nigra plants (about 30 cm tall) were reverse transcribed and full-length AlaAT cDNAs were amplified using the RT-PCR technique. Four clones (PnAlaAT1, PnAlaAT2, PnAlaAT3 and PnAlaAT4) were obtained. The open reading frames (ORFs) of PnAlaAT1, PnAlaAT2, PnAlaAT3 and PnAlaAT4 each encoded proteins of 481 amino acid residues. The cDNA sequences were aligned and the AlaAT gene sequences were found to be highly homologous (99%) between P. simonii × P. nigra and P. trichocarpa. The percentage identity (94%) between PnAlaAT1 and PnAlaAT2 was highest, followed by that (93%) between PnAlaAT3 and PnAlaAT4 (Figure S2). However, the percentage identity between PnAlaAT1/PnAlaAT2 and PnAlaAT3/PnAlaAT4 was low, only about 50%. According to Igarashi et al.18, the carboxy-terminal tripeptides of PnAlaAT1 (SRL) and PnAlaAT2 (SRL) are conserved peroxisome -targeting signal-like (PTS1-like) sequences.
Expression analysis of PnAlaATs in different organs of P. simonii × P. nigra
Determining the expression of gene family members in different organs provides important information on gene functions. To help characterizing of the functions of the PnAlaAT isogenes, their expression profiles were identified by quantitative real-time PCR in roots, stems and leaves. The leaves were divided into three groups to better characterize the expression patterns during leaf development. Four pairs of PCR primers were designed in 3′-or 5′-untranslated regions for specific amplification of each PnAlaAT isogene. The result showed (Fig. 4) that PnAlaAT1 and PnAlaAT2 were expressed mainly in the leaves, and the expression levels of these two genes in L3 were highest among all the organs. PnAlaAT3 and PnAlaAT4 were expressed in all the tested organs. The expression level of PnAlaAT4 in leaves was higher than in roots, but significantly lower than the levels of PnAlaAT1 and PnAlaAT2 in leaves. In roots, the expression level of PnAlaAT3 was higher than those of PnAlaAT1 and PnAlaAT2 in roots.
Figure 4. Relative transcript levels of PnAlaAT genes in different organs of P. simonii × P. nigra.
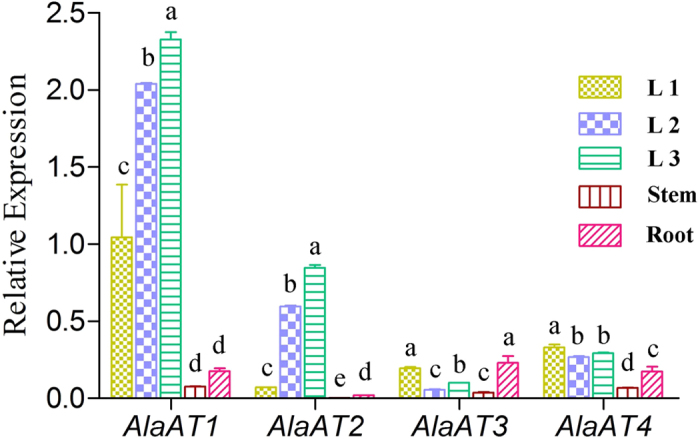
Quantitative RT-PCR was performed using total RNA extracted from leaves, stems and roots of 30 cm tall plants. Results are the mean ± SE of three replicates. (P < 0.05). L1: 1st–3rd leaves from the top of the plant; L2: 4th–6th leaves from the top of the plant; L3: 1st–3rd leaves from the bottom of the plant.
Effects of nitrogen sources on PnAlaATs expression in different organs of P. simonii × P. nigra
AlaAT genes play an important role in the N metabolism process. To investigate the impact of N sources on the PnAlaAT genes expresssion, the expression profiles of PnAlaATs were studied by real-time quantitative PCR in leaves, stems and roots grown on different N sources at different concentrations. The result showed that the expression of PnAlaAT1 in L1 and L2 was induced by different N sources; however, expression in L3 was not induced significantly by exogenous N (Fig. 5). PnAlaAT1 expression in L1 increased with treatment time under low NO3−, and reached a peak after 12 h of 1 mM NO3− supply. PnAlaAT1 transcript levels in L1 were lower under 10 mM NO3− treatment than that of 1 mM NO3−. However, PnAlaAT1 transcript levels did not change significantly in L1 when treated with different concentrations of NH4+ except 1 mM NH4+ for 12 h and 10 mM NH4+ for 72 h. Compared with L1, PnAlaAT1 abundance in L2 was induced to a high level, irrespective of N form or concentration. Expression of PnAlaAT1 was the highest in L3 compared with L1 and L2, but was not induced by the N sources. However, PnAlaAT1 expression in roots was strongly inhibited by different N sources. In stems, PnAlaAT1 expression levels were low and effectively negligible compared with that in other organs. The expression patterns of PnAlaAT2 were similar to those of PnAlaAT1, but the expression levels in the former were clearly lower than that in the latter (Figure S3).
Figure 5. Expression patterns of PnAlaAT1 gene in different organs under different nitrogen source conditions.
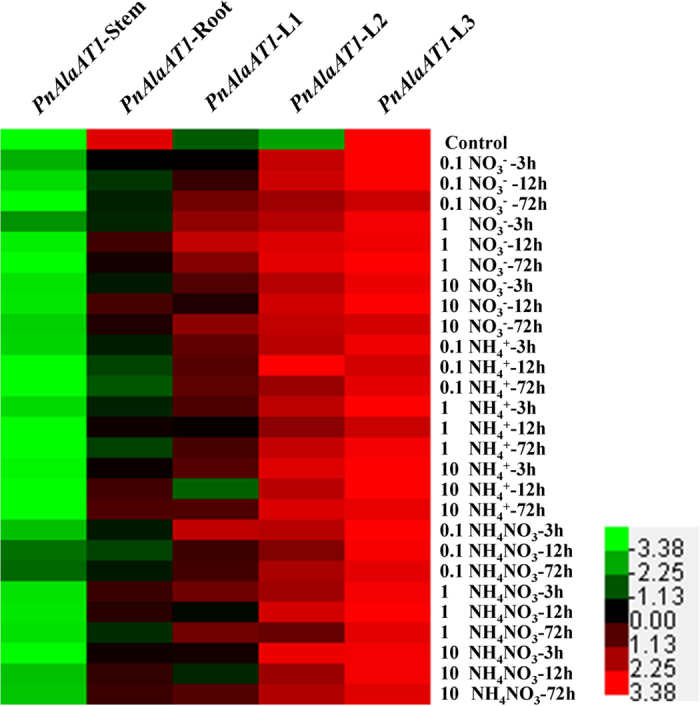
Quantitative RT-PCR was performed using total RNA extracted from leaves, stems and roots.
Expression of PnAlaAT3 gene was strongly induced by exogenous N sources in roots irrespective of N forms (Fig. 6). Notably, the expression levels of PnAlaAT3 increased by more than 100 times when the plants were treated with 10 mM NH4+ for 12 h and 72 h in roots. The expression levels of PnAlaAT3 in leaves were very weak, but increased significantly under high-N treatment. PnAlaAT3 expression in stems was also induced by exogenous N, but at a level significantly lower than that in roots. In contrast, PnAlaAT4 was expressed at a negligible level in all tested conditions (Figure S4).
Figure 6. Expression patterns of PnAlaAT3 gene in different organs under different nitrogen source conditions.
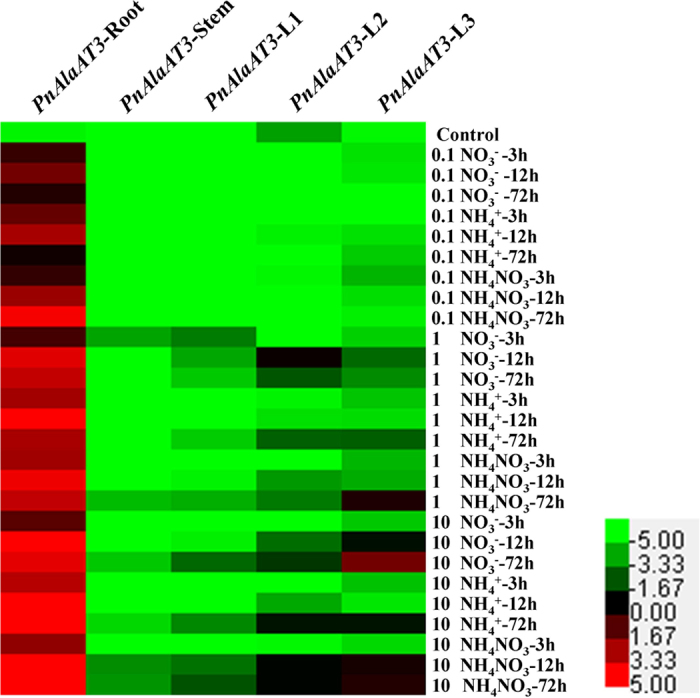
Quantitative RT-PCR was performed using total RNA extracted from leaves, stems and roots.
Effects of the diurnal cycle on PnAlaATs expression in different organs of P. simonii × P. nigra
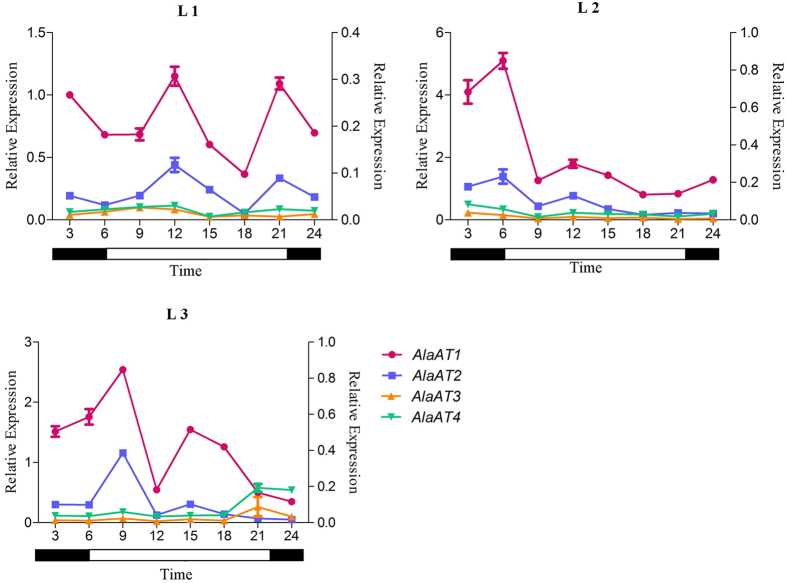
It is well documented that the transcriptional levels of several plant genes are subject to diurnal control42,43. To investigate whether the diurnal cycle affects the PnAlaATs, diurnal changes of expression level in leaves during a day/night cycle were determined. PnAlaAT1 and PnAlaAT2 expression fluctuated in different leaves during the diurnal cycle, and had the same periodicity (Fig. 7). PnAlaAT3 and PnAlaAT4 showed a similar expression pattern in leaves, with low fluctuation and expression levels during the diurnal cycle. In addition, the expression levels of PnAlaAT1 were clearly higher than that of PnAlaAT2.
Figure 7. Diurnal fluctuation of expression patterns of PnAlaAT genes in leaves.
Quantitative RT-PCR was performed using total RNA extracted from leaves. PnAlaAT1 and PnAlaAT2 refer to the left Y axis and PnAlaAT3 and PnAlaAT4 refer to the right Y axis. Results are the mean ± SE of three replicates.
To evaluate the effect of light induction on PnAlaAT gene family members, the transcript levels in plants kept for 2 days in the dark or 2 days in the light were examined (Fig. 8). The mRNA levels of PnAlaAT1 increased significantly in L1 and L3 after 2 days of continuous dark, and the mRNA abundance of PnAlaAT1 was highest in L2 after this treatment. The mRNA level of PnAlaAT2 was lower than that of PnAlaAT1 in all tested sections, and didn’t change significantly except in L2. PnAlaAT3 and PnAlaAT4 showed low expression levels in all conditions.
Figure 8. Light effects on the expression patterns of PnAlaAT genes in leaves.
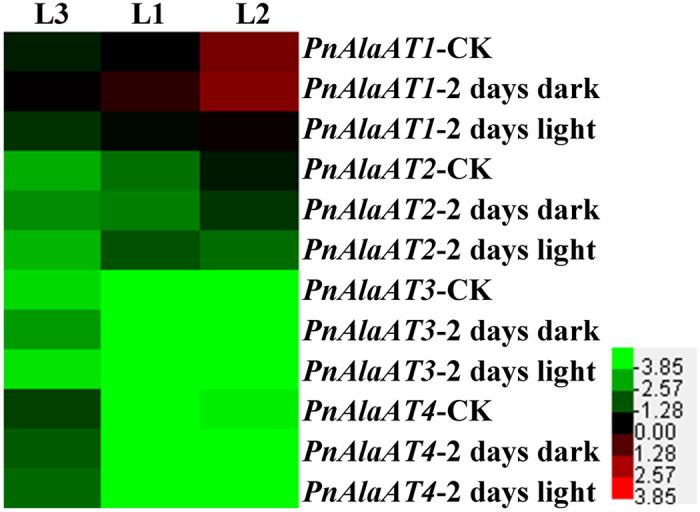
Plants were grown in darkness for 2 days, or grown in light for 2 days. Quantitative RT-PCR was performed using total RNA extracted from leaves.
Effects of MSX on PnAlaATs expression in P. simonii × P. nigra roots
To clarify whether the expression of PnAlaAT3 is dependent on NH4+ or glutamine or its related metabolites, MSX was applied to inhibit GS activity. GS functions in the glutamine synthetase/glutamine: α-oxoglutarate aminotransferase cycle (GS/GOGAT cycle) to generate glutamine from NH4+ and glutamate44. MSX blocks the enzyme activity of GS and prevents glutamine synthesis. NH4+ application followed the N starvation increased PnAlaAT3 mRNA levels significantly in roots (Fig. 9). However, PnAlaAT3 expression showed no significant change when MSX was applied alone or with NH4+. In contrast, PnAlaAT3 mRNA levels were significantly induced by MSX with Gln. These treatments had no impact on PnAlaAT1, PnAlaAT2 and PnAlaAT4. This suggested that glutamine rather than NH4+ itself controlled the expression of PnAlaAT3 gene in roots.
Figure 9. Effects of ammonium, glutamine and MSX on expression of PnAlaAT genes in roots.
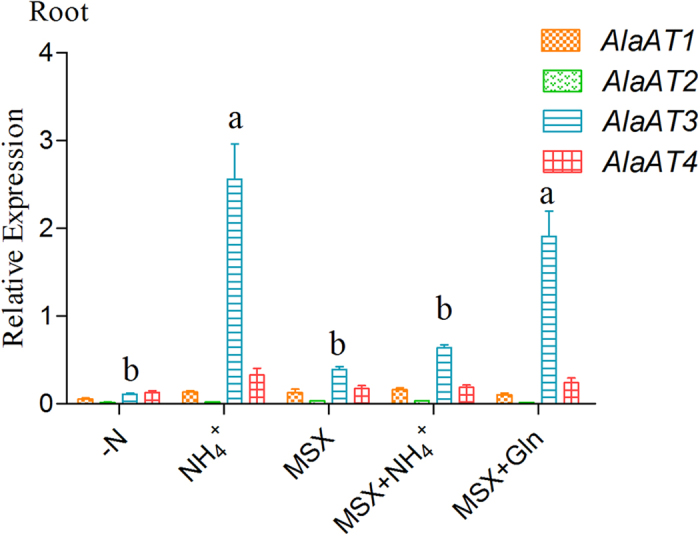
Plants were supplied with nitrogen-free medium for 4 days, after that plantlets were fertilized with different nutrient solutions, nitrogen-free nutrient solution (−N); nitrogen-free nutrient solution plus 10mM NH4Cl (+NH4+); nitrogen-free nutrient solution plus MSX (+MSX); nitrogen-free nutrient solution plus 10 mM NH4Cl and MSX (MSX+NH4+); nitrogen-free nutrient solution plus 10 mM Gln and MSX (MSX + Gln). Quantitative RT-PCR was performed using total RNA extracted from roots. Results are the mean ± SE of three replicates. (P < 0.05).
Discussion
The present work is the first report of AlaAT homologues in Populus. We identified four AlaAT genes in P. trichocarpa, namely PtAlaAT1, PtAlaAT2, PtAlaAT3 and PtAlaAT4. The four genes were classified into two subgroups (Fig. 1) based on comparison with the sequences of AlaAT genes from A. thaliana, G. max and M. truncatula22. Subgroup A contained PtAlaAT3 and PtAlaAT4, which were closely related to A. thaliana alanine aminotransferase (AtAlaAT1 and AtAlaAT2), G. max alanine aminotransferase (GmAlaAT1 and GmAlaAT4) and M. truncatula alanine aminotransferase (MtmAlaAT); subgroup B contained PtAlaAT1 and PtAlaAT2, which were closely related to A. thaliana glutamate:glyoxylate aminotransferase (AtGGAT1 and AtGGAT2), G. max alanine aminotransferase (GmAlaAT2 and GmAlaAT3) and M. truncatula alanine aminotransferase (MtcAlaAT). According to Tuskan et al.45, some segments on chromosomes I and III and chromosomes VIII and X are presumed to have arisen from the salicoid-specific genome duplication. PtAlaAT1–4 are located in these duplicated segments. This indicates that the two members of each subgroup might derive from a duplication event.
Many metabolic processes occur in leaves, such as synthesis of organic compounds, photosynthesis and photorespiration. Several studies have shown the N concentration of leaves generally decreases with increasing plant age46. In the chaparral shrub Lepechinia calycina growing in its natural habitat, photosynthetic capacity, leaf N content and stomatal conductance decreased with increasing leaf age47. In Portulaca oleracea L., the absolute amount of both ribulose bisphosphate carboxylase/oxygenase (rubisco) and phosphoenolpyruvate carboxylase was lower in senescent leaves than in mature leaves, and rubisco activity was reduced to a lesser degree48. In Nicotiana tabacum, metabolic, biochemical and molecular events occur during leaf ageing, with a particular emphasis on N metabolism. The sink/source transition also occurs at a particular leaf stage49. Additionally, the concentration of N supplied has an effect on leaf senescence50. On the basis of these results, we took leaf development and senescence into account. In our test conditions, we observed that the lower, old leaves wilted first, the uppermost, younger leaves expanded gradually and the middle leaves remained active for a long time. We believed these three sections of leaves represented different developmental periods, though the mechanism of leaf development is unclear. We therefore divided the leaves into three groups in our study.
A. thaliana has four AlaAT homologues. AtAlaAT1 and AtAlaAT2 encode alanine aminotransferase (E.C.2.6.1.2), whereas AtGGAT1 and AtGGAT2 contain peroxisome-targeting signal (PTS) sequences and have glutamate:glyoxylate aminotransferase activity (GGAT, E.C.2.6.1.4)18,36. PTSs were also found in PnAlaAT1 and PnAlaAT2 (Supplementary Figure 1). To reveal the biological roles of the PnAlaAT genes, their expression profiles were precisely analyzed. PnAlaAT1 was expressed in all organs, with very high levels in leaves. Similarly, PnAlaAT2 was expressed mainly in leaves, with the highest level in L3, but was negligibly expressed in stems and roots. In A. thaliana, the expression of AtGGAT1 and AtGGAT2 was much higher in green leaves than in other organs, but the AtGGAT2 mRNA level was lower than that of AtGGAT1 in all organs18. The very high similarity of PnAlaAT1/PnAlaAT2 to AtGGAT1/AtGGAT2 indicated that they might be peroxisomal proteins and should have the same function in the photorespiratory process, catalyzing the reaction of glutamate and glyoxylate to α-oxoglutarate and glycine. However, it needs to be further confirmed. Given the expression pattern of PnAlaAT1 in response to light induction (Fig. 8), it seems interesting that PnAlaAT1 expression was higher at night, while photorespiration only happens during the daytime. It is possible that PnAlaAT1 is highly expressed at night and its products Gly would be used during the subsequent day. The further studies were needed to examine this hypothesis.
PnAlaAT1 expression in L1 was affected by different NO3− concentrations, but different NH4+ concentrations did not cause a significant change (Fig. 5). NO3− reduction is related to photorespiration, which is the light-stimulated oxidation of photosynthesis intermediates to CO251. This process occurs primarily in higher plants that fix CO2 via the C3 pathway of photosynthesis. Photorespiration protects C3 plants from photooxidation52 and occurs in the chloroplast, peroxisome and mitochondrion. In the peroxisome, glutamate:glyoxylate aminotransferase catalyzes the reaction of glutamate and glyoxylate to α-oxoglutarate and glycine53. Two isoforms exist in A. thaliana, with GGAT1 representing the major form in leaves18,36. Photorespiration stimulates provision of a reductant source for nitrate reductase51. Most NO3− is reduced in leaves54 and is supplied to L1 predominantly. Additionally, NO3− is considered not only a major macronutrient, but also a powerful signal molecule. NO3− triggered signals can be rapidly and specifically sensed by plant cells and then the expression of a large set of genes regulating plant metabolism and growth are induced or inhibited55. In our results, PnAlaAT1 expression in L1 was affected by different NO3− concentrations and reached a peak after 12 h of 1 mM NO3− supply. However, this kind of response didn’t occur in other organs. Based on the above results, we speculated that photorespiration in L1 was affected predominantly when NO3− was supplied.
The expression level of PnAlaAT1 and PnAlaAT2 exhibited a diurnal fluctuation in leaves (Fig. 8). This periodic fluctuation may be controlled by an endogenous circadian clock, whose phase can be entrained by light, possibly through the phytochrome system42,56. The presence of putative light-regulation and circadian elements in the promoter regions of PnAlaAT1 and PnAlaAT2 is consistent with our data and may partially explain the expression patterns of these genes in leaves57,58,59. Previous studies showed that both AlaAT and GGAT activities were present in etiolated wheat seedlings but their activity was half of that observed in light-grown seedlings, and exposure of etiolated seedlings to light caused an increase in enzyme activities and upregulated GGAT1 gene, while AlaAT1 gene didn’t respond60. But in our study, the expression of PnAlaAT1 and PnAlaAT2 exhibited a diurnal fluctuation in leaves (Fig. 8) and PnAlaAT1 increased significantly in L1 and L3 after 2 days of continuous dark (Fig. 9), while PnAlaAT3 and PnAlaAT4 didn’t exhibit these characteristics. The regulatory mechanism of PnAlaAT1 and PnAlaAT2 need to be further studied. Additionally, OsAlaAT1 plays an essential role in the regulation of starch storage in rice endosperm61. This is consistent with our finding that endosperm expression elements existed in the promoter regions of the PnAlaAT genes.
The expression of AlaAT genes was diverse in different species. In soybean, GmAlaAT1 and GmAlaAT4 were expressed only in the roots of non-nodulated plants, with very low expression in the roots of nodulated plants37. In M. truncatula, m-AlaAT was expressed at very similar levels in roots, stems and leaves of adult plants and in the embryo axes of young seedlings22. In our study, PnAlaAT3 and PnAlaAT4 were expressed in all organs, while PnAlaAT3 was expressed at a much higher level in roots than in the other organs (Fig. 4).
NO3− and NH4+ are absorbed by roots through NRT and AMT, respectively6,7. NO3− is reduced to NH4+ by NR and NiR, and then enters the glutamine synthetase (GS) and glutamate synthase (GOGAT) cycle. NH4+ is mainly assimilated in roots, whereas most NO3− reduction occurs in the leaves of poplars54. Additionally, N concentration affects the NH4+ content and NR activities in poplar roots62. It has been confirmed that GS activity in roots is promoted by ammonium63. Ammonium has been identified as a signaling molecule64. In our study, PnAlaAT3 expression in roots was increased more than 100 times after treatment with 10 mM NH4+ (Fig. 6). To determine whether this was due to the effect of the ammonium signal or the promotion of GS activity, we designed an experiment in which the GS activity was inhibited.
Glutamine, one of the N-assimilation products, can be synthesized from ammonium and glutamate by GS. Glutamine is the main transportable form of organic N and is a N-storing compound in plants44. As a major amino donor for the synthesis of amino acids and other N-containing compounds, glutamine can be taken up from the soil65. In addition to its role in nutrition and metabolism, glutamine can also function as a signal molecule inducing the expression of at least 35 genes involved in metabolism, transport, signal transduction, and stress responses within 30 min in rice66. Can Gln induce the expression of AlaAT genes? We showed in this study that Gln affected the expression level of PnAlaAT3 in roots, but not the other three PnAlaAT genes. That is, NH4+ participated in the GS/GOGAT cycle to synthesize glutamine after being absorbed by the roots, and then glutamine or its related metabolites induced the expression of PnAlaAT3. PnAlaAT1, PnAlaAT2 and PnAlaAT4 genes were not significantly influenced by NH4+ or Gln in roots. In conclusion, PnAlaAT3 was expressed at a higher level than other PnAlaAT genes in roots, and only the expression of PnAlaAT3 was promoted by NH4+ or Gln or its related metabolites in roots. These results suggest that PnAlaAT3 might play an important role in nitrogen metabolism.
In our previous study, we found that long-term application of different forms of nitrogen may cause morphological changes of poplar roots. However, we did not find significantly differentially expressed genes related to N metabolism pathway, mitochondrial electron transport/ATP synthesis and mineral nutrition in our previous report of global gene expression analysis utilizing RNA-seq. On the contrary, we found that the significantly differentially expressed genes are largely associated with fermentation, glycolysis, and tricarboxylic acid cycle (TCA), secondary metabolism, hormone metabolism and transport processing67. In the study of Beatty et al.33, the alanine aminotransferase (AlaAT) gene was transferred into rice plants and ectopically expressed under the control of a tissue-specific promoter to investigate their functions in uses of nitrogen sources. Consistent with our findings, the authors found the transgenic plants displayed a strong N use efficiency but less changes in the transgenic transcriptome compared with the controls, with only 0.11 and 0.07% differentially regulated genes in roots and shoots, respectively. We speculate that N metabolism related genes might play an important role in the regulation of short-time N metabolism, and affect morphology changes of poplar roots through regulating fermentation, glycolysis and tricarboxylicacidcycle (TCA), secondary metabolism, hormone metabolism and transport processing.
Methods
Tissue culture and growth of plants
Young leaves were collected from cuttings of P. simonii × P. nigra grown at Northeast Forestry University Forest Farm, Harbin, China. Explants were surface sterilized with 70% absolute ethyl alcohol for 1 min and 0.5% NaOCl (Purui, Shanghai, China) solution for 7 min, and then rinsed three times with sterile double-distilled water. The leaves were cut into squares (1 cm2). The leaf squares were cultivated in Petri dishes (diameter 9 cm) on MS medium68 with 0.5 mg/L 6-benzyl-aminopurine (PhytoTechnology, Lenexa, USA) and 0.05 mg/L β-naphthaleneacetic acid (PhytoTechnology, Lenexa, USA), shoots were induced on MS medium with 0.1 mg/L 6-benzyl-aminopurine and 0.05 mg/L β-naphthaleneacetic acid, and roots were induced on MS medium with 0.2 mg/L indole-3-butyric acid (PhytoTechnology, Lenexa, USA). When they reached a height of 10 cm, the plantlets were transferred to a greenhouse with a photosynthetic photon flux density (PPFD) of 100 μmol m−2 s−1, a 16-h-light/8-h-dark photoperiod, and a temperature of 22 °C. There were 114 plants from the hybrids of P. simonii × P. nigra were studied in this research and 546 samples (leaves, stems and roots) were collected for all the analysis.
Nitrogen and inhibitor treatment
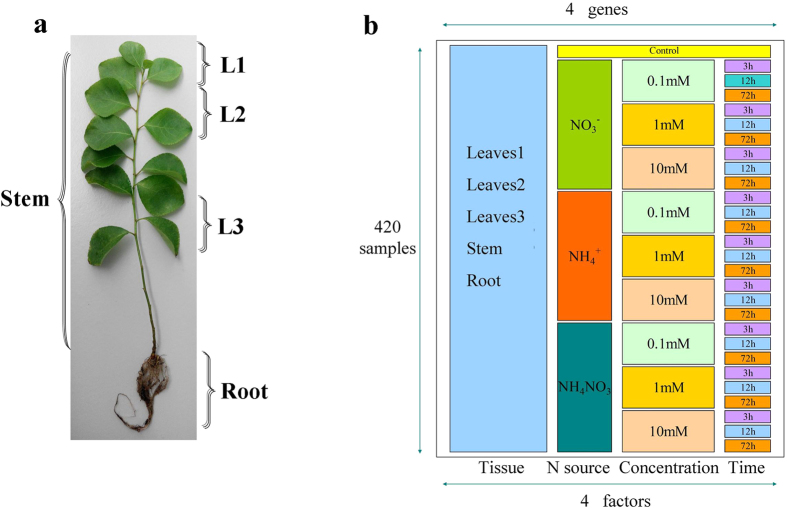
Each plant was grown in one plastic pot filled with sterilized vermiculite as a substrate and supplied with 200 mL of sterile modified Long-Ashton nutrient solution (1 mM nitrogen)68 every 2 days. The treatments were performed when the seedlings were 30 cm tall. The plants were supplied with 200 mL of sterile N-free nutrient solution for 4 days. The effects of different N sources on the plants were then tested by adding NH4Cl or NaNO3 or both to the N-free nutrient solution to final concentrations of 0.1, 1 and 10 mM. To avoid changing the osmotic pressure, 0.5 mM KCl and 0.9 mM CaCl2 (Bodi, Tianjin, China) were used (Table S1)69. The plant tissues (1st–3rd (L1) and 4th–6th (L2) leaves from the top of the plant, 1st–3rd leaves (L3) from the bottom of the plant, stems and roots) were harvested after 0 h (control), 3 h, 12 h and 72 h treatment (Fig. 10). The plants were treated at different times, however, at the same time harvested at 11 o’clock. Three repeated samples were frozen in liquid nitrogen and stored at −80 °C for further analysis.
Figure 10. Scheme of the treatments and harvest for expression analysis of PnAlaAT genes.
(a), distribution of different organs in P. simonii × P. nigra, leaves: 1st–3rd (L1) and 4th–6th (L2) are the ones from the top of the plants, 1st-3rd (L3) are the ones from the bottom of the plants. (b), the four factors (tissue, N source, concentration and time). The control was treated with nitrogen-free nutrient solution for 0 h. There were 420 samples in total.
To examine the effect of methionine sulfoximine (MSX, an inhibitor of glutamine synthase), we supplied various test nutrient solutions (N-free nutrient solution; N-free nutrient solution plus 10 mM NH4Cl; N-free nutrient solution plus 1 mM MSX; N-free nutrient solution plus 10 mM NH4Cl and 1 mM MSX; N-free nutrient solution plus 10 mM Gln and 1 mM MSX). The plant seedlings were cultivated in nitrogen-free nutrient solution for 4 days, and then were transferred to the five aforementioned culturing solutions, respectively. After 12 h treatment, plant samples were harvested, frozen in liquid nitrogen immediately, and stored at −80 °C for future analysis.
Light treatment
Plantlets grown in tissue culture vessels were directly transferred to soil supplied with water every 2 days. To examine the influence of the diurnal cycle, samples were harvested every 3 h over one day. To examine the effect of light, the plants were grown in darkness for 2 days and then transferred to a 16-h-light/8-h-dark photoperiod for 4 days. Three repeated samples were frozen in liquid nitrogen and stored at −80 °C for analysis.
Identification of AlaAT gene family members in P. trichocarpa
We downloaded the Hidden Markov Model (HMM) profile file (Aminotran_1_2.hmm) of the Pfam Aminotran_1_2 domain (PF00155) from the Pfam database70. The protein sequences of P. trichocarpa were downloaded from Phytozome 9.0 (http://www.phytozome.net/poplar_er.php). We used the HMM modules of PF00155 with the HMMER (v 3.0) software to search the proteome of P. trichocarpa71. Proteins with e-values less than 2.2E-34 were included in further analyses. We searched the Aminotran_1_2-domain in all the collected proteins using the Interproscan (http://www.ebi.ac.uk/Tools/pfa/iprscan/) and SMART software72. We used the Gene Structure Display Server (GSDS) program to illustrate the exon/intron organization of individual AlaAT genes73.
RNA extraction and reverse transcription
Total RNA was extracted from leaf, stem, and root tissues using the pBIOZOL plant total RNA Extraction Reagent (BioFlux, Hangzhou, China) according to the manufacturer’s protocol. The integrity of the RNA was verified by 1.5% agarose gel electrophoresis. After removing genomic DNA with gDNA Eraser, approximately 2 μg RNA was used to synthesize the first-strand cDNA using the PrimerScript RT Reagent Kit (Takara Biotechnology, Dalian, China).
Real-time PCR (RT-PCR)
The Primer Premier 5.0 (Premier Biosoft, Palo Alto, CA, USA) software was used to design specific primers for real-time PCR analysis and the primer sequences of each gene were included in Table 2. The following gene-specific primers were used: for AlaAT1. Real-time PCR was performed using a 7500 Real-Time PCR System (Applied Biosystems) with SYBR Green PCR Master Mix (Applied Biosystems) according to the manufacturer’s protocol. Each reaction was performed on 5 μL of a 1:5 (v/v) dilution of the first-strand cDNA, synthesized as described above, with 0.3 μM of each primer in a total reaction of 20 μL. The specificity of the PCR amplification procedures was checked with a heat dissociation protocol after the final cycle. The amplification program had three steps: (1) 1 cycle (95 °C, 10 min); (2) 40 cycles, cDNA denaturing (95 °C, 15 s), hybridization and extension (60 °C, 1 min); (3) 1 cycle (95 °C, 15 s; 60 °C, 1 min; 95 °C, 15 s; 60 °C, 15 s) to generate a dissociation curve to confirm the specific amplification of each individual reaction. Each reaction was done in triplicate and the corresponding Ct values were determined. In the expression analyses, transcript levels were normalized to the PtActin2 gene (accession number: XM_002298946) as it is expressed stability independently of tissues, N sources, N concentration and developmental stage. The 2−ΔΔCT method was used to analyze the relative changes in gene expression74,75.
Table 2. Details of primers used for polymerase chain reaction analysis.
| Primer name | Sequences(from 5′to 3′) |
|---|---|
| AlaAT1- sense | GATCCAAATGTGGGGTTGCTATA |
| AlaAT1- antisense | CTGCTACCTTCCTAACTCCA |
| AlaAT2- sense | TATGAAGGCACGGTGGTTATT |
| AlaAT2- antisense | TTAGACGTTGGATTGAGCAGGT |
| AlaAT3- sense | CTTTTACTGTCGCAGCCTACTC |
| AlaAT3- antisense | GTTCAAGGCAACATCTTATTTTG |
| AlaAT4- sense | AGTTGTCTCCCGTCTCACAGAG |
| AlaAT4- antisense | CTTCGATGGAGGAGCAATAAAG |
| PtActin2- sense | CACAACTGCTGAACGGGAAAT |
| PtActin2- antisense | CAGGGCAACGGAAACACTCT |
Promoter analysis
Regulatory elements in the 5′-upstream regions of the poplar AlaAT genes were predicted starting from the ATG codon for initiation of translation. Sequence identity was analyzed to identify putative cis-acting elements using the PlantCARE database76. Sequence stretches of 1500 bp for each gene were compared.
Statistical analysis
Statistical tests were performed with SPSS 19.0 (IBM, USA), and the data were tested to confirm their normality before statistical analysis. For experimental variables, one-way analysis of variance (ANOVA) was used with N-treatment as a factor. Differences between means were considered significant when P < 0.05 according to the ANOVA F-test.
Our work demonstrated that the poplar genome contained four genes encoding alanine aminotransferase (PnAlaAT3 and PnAlaAT4) and glutamate:glyoxylate aminotransferase (PnAlaAT1 and PnAlaAT2). PnAlaAT1 and PnAlaAT2 were closely related to AtGGAT1 and AtGGAT2, and contained PTS1-like sequences in their proteins. They were expressed predominantly in leaves and induced by NH4+ and NO3−. Their expression exhibited a diurnal fluctuation in leaves. The expression level of PnAlaAT1 was higher than that of PnAlaAT2 in all conditions. PnAlaAT3 and PnAlaAT4 were expressed in roots, stems and leaves. The expression level of PnAlaAT3 was higher than that of PnAlaAT4. PnAlaAT3 expression was increased significantly by NH4+ in roots, because of Gln or its related metabolites. We speculated that PnAlaAT1 and PnAlaAT3 might play important roles in leaves and roots, respectively. These results offered new insight into the AlaAT gene family in woody plants and the involvement of AlaAT genes in woody plant responses to exogenous N and light.
Additional Information
How to cite this article: Xu, Z. et al. Identification and expression analyses of the alanine aminotransferase (AlaAT) gene family in poplar seedlings. Sci. Rep. 7, 45933; doi: 10.1038/srep45933 (2017).
Publisher's note: Springer Nature remains neutral with regard to jurisdictional claims in published maps and institutional affiliations.
Supplementary Material
Acknowledgments
This project was financially supported by the Innovation Project of the State Key Laboratory of Tree Genetics and Breeding (Northeast Forestry University) (3C03), the National High Technology Research and Development Program of China (863 Program, 2013AA102702), and by Fundamental Research Funds for the Central Universities (DL13EA03-01).
Footnotes
The authors declare no competing financial interests.
Author Contributions Jing Ma, Yan Sun, Bingqing Hao, Zhongye Liu, Zhiru Xu and Guanjun Liu conceived and designed the experiments; Jing Ma, Yan Sun and Bingqing Hao conducted the experiments and analyzed the data; Han Yang, Chunpu Qu and Chengjun Yang helped to conduct experiment and data analysis; Zhiru Xu and Jing Ma wrote the manuscript; Zhiru Xu, Guanjun Liu, Ying Li and Yanbo Hu revised the manuscript. All authors have read and approved the final version of the paper.
References
- Luo Z. B. & Polle A. Wood composition and energy content in a poplar short rotation plantation on fertilized agricultural land in a future CO2 atmosphere. Global Change Biol. 15, 38–47 (2009). [Google Scholar]
- Testa R., Di Trapani A. M., Foderà M., Sgroi F. & Tudisca S. Economic evaluation of introduction of poplar as biomass crop in Italy. Renew Sust Energ Rev. 38, 775–780 (2014). [Google Scholar]
- Rennenberg H., Wildhagen H. & Ehlting B. Nitrogen nutrition of poplar trees. Plant Biology. 12, 275–291 (2010). [DOI] [PubMed] [Google Scholar]
- Rennenberg H. et al. Nitrogen balance in forest soils: nutritional limitation of plants under climate change stresses. Plant Biology. 11, 4–23 (2009). [DOI] [PubMed] [Google Scholar]
- Balasus A., Bischoff W. A., Schwarz A., Scholz V. & Kern J. Nitrogen fluxes during the initial stage of willows and poplars in short‐rotation coppices. J Plant Nutr Soil SC. 175, 729–738 (2012). [Google Scholar]
- Forde B. G. Nitrate transporters in plants: structure, function and regulation. BBA-Biomembranes. 1465, 219–235 (2000). [DOI] [PubMed] [Google Scholar]
- Howitt S. M. & Udvardi M. K. Structure, function and regulation of ammonium transporters in plants. Biochim Biophys Acta. 1465, 152–170 (2000). [DOI] [PubMed] [Google Scholar]
- McAllister C. H., Beatty P. H. & Good A. G. Engineering nitrogen use efficient crop plants: the current status. Plant Biotechnol J. 10, 1011–1025 (2012). [DOI] [PubMed] [Google Scholar]
- Mengel K., Robin P. & Salsac L. Nitrate reductase activity in shoots and roots of maize seedlings as affected by the form of nitrogen nutrition and the pH of the nutrient solution. Plant Physiol. 71, 618–622 (1983). [DOI] [PMC free article] [PubMed] [Google Scholar]
- Errebhi M. & Wilcox G. Tomato growth and nutrient uptake pattern as influenced by nitrogen form ratio. J Plant Nutr. 13, 1031–1043 (1990). [Google Scholar]
- Raab T. K. & Terry N. Nitrogen source regulation of growth and photosynthesis in Beta vulgaris L. Plant Physiol. 105, 1159–1166 (1994). [DOI] [PMC free article] [PubMed] [Google Scholar]
- Walch‐Liu P., Neumann G., Bangerth F. & Engels C. Rapid effects of nitrogen form on leaf morphogenesis in tobacco. J Exp Bot. 51, 227–237 (2000). [DOI] [PubMed] [Google Scholar]
- Alboresi A. et al. Nitrate, a signal relieving seed dormancy in Arabidopsis. Plant Cell Environ. 28, 500–512 (2005). [DOI] [PubMed] [Google Scholar]
- Scheible W. R., Lauerer M., Schulze E. D., Caboche M. & Stitt M. Accumulation of nitrate in the shoot acts as a signal to regulate shoot‐root allocation in tobacco. Plant J. 11, 671–691 (1997). [Google Scholar]
- Marín I. C. et al. Nitrate regulates floral induction in Arabidopsis, acting independently of light, gibberellin and autonomous pathways. Planta. 233, 539–552 (2011). [DOI] [PMC free article] [PubMed] [Google Scholar]
- Tian Q., Chen F., Liu J., Zhang F. & Mi G. Inhibition of maize root growth by high nitrate supply is correlated with reduced IAA levels in roots. J Plant Physiol. 165, 942–951 (2008). [DOI] [PubMed] [Google Scholar]
- DesRochers A., Van Den Driessche R. & Thomas B. R. The interaction between nitrogen source, soil pH, and drought in the growth and physiology of three poplar clones. Can J Bot. 85, 1046–1057 (2007). [Google Scholar]
- Igarashi D. et al. Identification of photorespiratory glutamate: glyoxylate aminotransferase (GGAT) gene in Arabidopsis. Plant J. 33, 975–987 (2003). [DOI] [PubMed] [Google Scholar]
- Rech J. & Crouzet J. Partial purification and initial studies of the tomato L-alanine: 2-oxoglutarate aminotransferase. Biochim Biophys Acta. 350, 392–399 (1974). [DOI] [PubMed] [Google Scholar]
- Kikuchi H., Hirose S., Toki S., Akama K. & Takaiwa F. Molecular characterization of a gene for alanine aminotransferase from rice (Oryza sativa). Plant Mol Biol. 39, 149–159 (1999). [DOI] [PubMed] [Google Scholar]
- Good A. G. & Crosby W. L. Anaerobic induction of alanine aminotransferase in barley root tissue. Plant Physiol. 90, 1305–1309 (1989). [DOI] [PMC free article] [PubMed] [Google Scholar]
- Ricoult C., Echeverria L. O., Cliquet J. B. & Limami A. M. Characterization of alanine aminotransferase (AlaAT) multigene family and hypoxic response in young seedlings of the model legume Medicago truncatula. J Exp Bot. 57, 3079–3089 (2006). [DOI] [PubMed] [Google Scholar]
- Miyashita Y., Dolferus R., Ismond K. P. & Good A. G. Alanine aminotransferase catalyses the breakdown of alanine after hypoxia in Arabidopsis thaliana. Plant J. 49, 1108–1121 (2007). [DOI] [PubMed] [Google Scholar]
- Good A. G. & Muench D. G. Purification and characterization of an anaerobically induced alanine aminotransferase from barley roots. Plant physiol. 99, 1520–1525 (1992). [DOI] [PMC free article] [PubMed] [Google Scholar]
- Good A. G. & Muench D. G. Long-term anaerobic metabolism in root tissue (metabolic products of pyruvate metabolism). Plant Physiol. 101, 1163–1168 (1993). [DOI] [PMC free article] [PubMed] [Google Scholar]
- Muench D. G. & Good A. G. Hypoxically inducible barley alanine aminotransferase: cDNA cloning and expression analysis. Plant Mol Biol. 24, 417–427 (1994). [DOI] [PubMed] [Google Scholar]
- de Sousa C. A. F. & Sodek L. Alanine metabolism and alanine aminotransferase activity in soybean (Glycine max) during hypoxia of the root system and subsequent return to normoxia. Environ Exp Bot. 50, 1–8 (2003). [Google Scholar]
- Rocha M. et al. Glycolysis and the tricarboxylic acid cycle are linked by alanine aminotransferase during hypoxia induced by waterlogging of Lotus japonicus. Plant Physiol. 152, 1501–1513 (2010). [DOI] [PMC free article] [PubMed] [Google Scholar]
- Son D., Kobe A. & Sugiyama T. Nitrogen-dependent regulation of the gene for alanine aminotransferase which is involved in the C4 pathway of Panicum miliaceum. Plant Cell Physiol. 33, 507–509 (1992). [Google Scholar]
- Muench D. G., Christopher M. E. & Good A. G. Cloning and expression of a hypoxic and nitrogen inducible maize alanine aminotransferase gene. Physiol Plantarum. 103, 503–512 (1998). [Google Scholar]
- Good A. G. et al. Engineering nitrogen use efficiency with alanine aminotransferase. Can J Bot. 85, 252–262 (2007). [Google Scholar]
- Shrawat A. K., Carroll R. T., DePauw M., Taylor G. J. & Good A. G. Genetic engineering of improved nitrogen use efficiency in rice by the tissue-specific expression of alanine aminotransferase. Plant Biotechnol J. 6, 722–732 (2008). [DOI] [PubMed] [Google Scholar]
- Beatty P. H., Shrawat A. K., Carroll R. T., Zhu T. & Good A. G. Transcriptome analysis of nitrogen‐efficient rice over‐expressing alanine aminotransferase. Plant Biotechnol J. 7, 562–576 (2009). [DOI] [PubMed] [Google Scholar]
- Snyman S. J., Hajari E., Watt M. P., Lu Y. & Kridl J. C. Improved nitrogen use efficiency in transgenic sugarcane: phenotypic assessment in a pot trial under low nitrogen conditions. Plant Cell Rep. 34, 667–669 (2015). [DOI] [PubMed] [Google Scholar]
- McAllister C. H. & Good A. G. Alanine aminotransferase variants conferring diverse NUE phenotypes in Arabidopsis thaliana. Plos One 10, e0121830 (2015). [DOI] [PMC free article] [PubMed] [Google Scholar]
- Liepman A. H. & Olsen L. J. Alanine aminotransferase homologs catalyze the glutamate: glyoxylate aminotransferase reaction in peroxisomes of Arabidopsis. Plant Physiol. 131, 215–227 (2003). [DOI] [PMC free article] [PubMed] [Google Scholar]
- Rocha M. et al. Analysis of alanine aminotransferase in various organs of soybean (Glycine max) and in dependence of different nitrogen fertilisers during hypoxic stress. Amino Acids. 39, 1043–1053 (2010). [DOI] [PMC free article] [PubMed] [Google Scholar]
- Jansson S. & Douglas C. J. Populus: a model system for plant biology. Annu. Rev. Plant Biol. 58, 435–458 (2007). [DOI] [PubMed] [Google Scholar]
- Wang G. et al. Genome-wide analysis of the cyclin family in Arabidopsis and comparative phylogenetic analysis of plant cyclin-like proteins. Plant physiol. 135, 1084–1099 (2004). [DOI] [PMC free article] [PubMed] [Google Scholar]
- Chai G. et al. Comprehensive analysis of CCCH zinc finger family in poplar (Populus trichocarpa). BMC genomics. 13, 253 (2012). [DOI] [PMC free article] [PubMed] [Google Scholar]
- Tamura K. et al. MEGA5: molecular evolutionary genetics analysis using maximum likelihood, evolutionary distance, and maximum parsimony methods. Mol Biol Evol. 28, 2731–2739 (2011). [DOI] [PMC free article] [PubMed] [Google Scholar]
- Giuliano G., Hoffman N., Ko K., Scolnik P. & Cashmore A. A light-entrained circadian clock controls transcription of several plant genes. The EMBO journal. 7, 3635–3642 (1988). [DOI] [PMC free article] [PubMed] [Google Scholar]
- Becker T. W., Caboche M., Carrayol E. & Hirel B. Nucleotide sequence of a tobacco cDNA encoding plastidic glutamine synthetase and light inducibility, organ specificity and diurnal rhythmicity in the expression of the corresponding genes of tobacco and tomato. Plant Mol Biol. 19, 367–379 (1992). [DOI] [PubMed] [Google Scholar]
- Lam H.-M., Coschigano K., Oliveira I., Melo-Oliveira R. & Coruzzi G. The molecular-genetics of nitrogen assimilation into amino acids in higher plants. Annu Rev Plant Biol. 47, 569–593 (1996). [DOI] [PubMed] [Google Scholar]
- Tuskan G. A. et al. The genome of black cottonwood, Populus trichocarpa (Torr. & Gray). Science. 313, 1596–1604 (2006). [DOI] [PubMed] [Google Scholar]
- Monteith J. Light interception and radiative exchange in crop stands (1969). [Google Scholar]
- Field C. & Mooney H. Leaf age and seasonal effects on light, water, and nitrogen use efficiency in a California shrub. Oecologia. 56, 348–355 (1983). [DOI] [PubMed] [Google Scholar]
- Kennedy R. A. Relationship between leaf development, carboxylase enzyme activities and photorespiration in the C4-plant Portulaca oleracea L. Planta. 128, 149–154 (1976). [DOI] [PubMed] [Google Scholar]
- Masclaux C., Valadier M.-H., Brugière N., Morot-Gaudry J.-F. & Hirel B. Characterization of the sink/source transition in tobacco (Nicotiana tabacum L.) shoots in relation to nitrogen management and leaf senescence. Planta. 211, 510–518 (2000). [DOI] [PubMed] [Google Scholar]
- Schulte auf’m Erley G. et al. Leaf senescence and N uptake parameters as selection traits for nitrogen efficiency of oilseed rape cultivars. Physiol Plantarum. 130, 519–531 (2007). [Google Scholar]
- Bloom A. J. Photorespiration and nitrate assimilation: a major intersection between plant carbon and nitrogen. Photosynth Res. 123, 117–128 (2015). [DOI] [PubMed] [Google Scholar]
- Kozaki A. & Takeba G. Photorespiration protects C3 plants from photooxidation. Nature. 384, 557–560 (1996). [Google Scholar]
- Bauwe H., Hagemann M. & Fernie A. R. Photorespiration: players, partners and origin. Trends Plant Sci. 15, 330–336 (2010). [DOI] [PubMed] [Google Scholar]
- Black B. L., Fuchigami L. H. & Coleman G. D. Partitioning of nitrate assimilation among leaves, stems and roots of poplar. Tree Physiol. 22, 717–724 (2002). [DOI] [PubMed] [Google Scholar]
- Castaings L., Marchive C., Meyer C. & Krapp A. Nitrogen signalling in Arabidopsis: how to obtain insights into a complex signalling network. J Exp Bot. 62, 1391–1397 (2011). [DOI] [PubMed] [Google Scholar]
- Lam E. & Chua N.-H. Light to dark transition modulates the phase of antenna chlorophyll protein gene expression. J Biol Chem. 264, 20175–20176 (1989). [PubMed] [Google Scholar]
- Gilmartin P. M., Sarokin L., Memelink J. & Chua N.-H. Molecular light switches for plant genes. Plant Cell. 2, 369 (1990). [DOI] [PMC free article] [PubMed] [Google Scholar]
- Borello U., Ceccarelli E. & Giuliano G. Constitutive, light‐responsive and circadian clock‐responsive factors compete for the different I box elements in plant light‐regulated promoters. Plant J. 4, 611–619 (1993). [DOI] [PubMed] [Google Scholar]
- Carre I. A. & Kay S. A. Multiple DNA-protein complexes at a circadian-regulated promoter element. Plant Cell. 7, 2039–2051 (1995). [DOI] [PMC free article] [PubMed] [Google Scholar]
- Kendziorek M., Paszkowski A. & Zagdańska B. Differential regulation of alanine aminotransferase homologues by abiotic stresses in wheat (Triticum aestivum L.) seedlings. Plant Cell Rep. 31, 1105–1117 (2012). [DOI] [PMC free article] [PubMed] [Google Scholar]
- Yang J. et al. Alanine aminotransferase 1 (OsAlaAT1) plays an essential role in the regulation of starch storage in rice endosperm. Plant Sci. 240, 79–89 (2015). [DOI] [PubMed] [Google Scholar]
- Luo J. et al. Nitrogen metabolism of two contrasting poplar species during acclimation to limiting nitrogen availability. J Exp Bot. 64, 4207–4224 (2013). [DOI] [PMC free article] [PubMed] [Google Scholar]
- Marwaha R. S. & Juliano B. O. Aspects of nitrogen metabolism in the rice seedling. Plant physiol. 57, 923–927 (1976). [DOI] [PMC free article] [PubMed] [Google Scholar]
- Palková Z., Janderová B., Zikánová B., Pospíŝek M. & Forstová J. Ammonia mediates communication between yeast colonies. Nature. 390, 532–536 (1997). [DOI] [PubMed] [Google Scholar]
- Nasholm T., Kielland K. & Ganeteg U. Uptake of organic nitrogen by plants. New Phytol. 182, 31–48 (2009). [DOI] [PubMed] [Google Scholar]
- Kan C. C., Chung T. Y., Juo Y. A. & Hsieh M. H. Glutamine rapidly induces the expression of key transcription factor genes involved in nitrogen and stress responses in rice roots. BMC Genomics. 16, 731 (2015). [DOI] [PMC free article] [PubMed] [Google Scholar]
- Qu C. P. et al. RNA-SEQ reveals transcriptional level changes of poplar roots in different forms of nitrogen treatments. Front Plant Sci. 7, (2016). [DOI] [PMC free article] [PubMed] [Google Scholar]
- Murashige T. & Skoog F. A revised medium for rapid growth and bio assays with tobacco tissue cultures. Physiol plantarum. 15, 473–497 (1962). [Google Scholar]
- Dluzniewska P. et al. Nitrogen uptake and metabolism in Populus x canescens as affected by salinity. New Phytol. 173, 279–293 (2007). [DOI] [PubMed] [Google Scholar]
- Finn R. D. et al. The Pfam protein families database. Nucleic acids research. gkp985 (2009). [DOI] [PMC free article] [PubMed] [Google Scholar]
- Eddy S. R. A new generation of homology search tools based on probabilistic inference. Genome Inform. 23, 205–211 (2009). [PubMed] [Google Scholar]
- Letunic I., Doerks T. & Bork P. SMART 7: recent updates to the protein domain annotation resource. Nucleic Acids Res. 40, 302–305 (2012). [DOI] [PMC free article] [PubMed] [Google Scholar]
- Guo A., Zhu Q., Chen X. & Luo J. GSDS: a gene structure display server. Hereditas. 29, 1023–1026 (2007). [PubMed] [Google Scholar]
- Schmittgen T. D. & Livak K. J. Analyzing real-time PCR data by the comparative CT method. Nat Protoc. 3, 1101–1108 (2008). [DOI] [PubMed] [Google Scholar]
- Livak K. J. & Schmittgen T. D. Analysis of relative gene expression data using real-time quantitative PCR and the 2−ΔΔCT method. Methods. 25, 402–408 (2001). [DOI] [PubMed] [Google Scholar]
- Lescot M. et al. PlantCARE, a database of plant cis-acting regulatory elements and a portal to tools for in silico analysis of promoter sequences. Nucleic Acids Res. 30, 325–327 (2002). [DOI] [PMC free article] [PubMed] [Google Scholar]
Associated Data
This section collects any data citations, data availability statements, or supplementary materials included in this article.


