Figure 4.
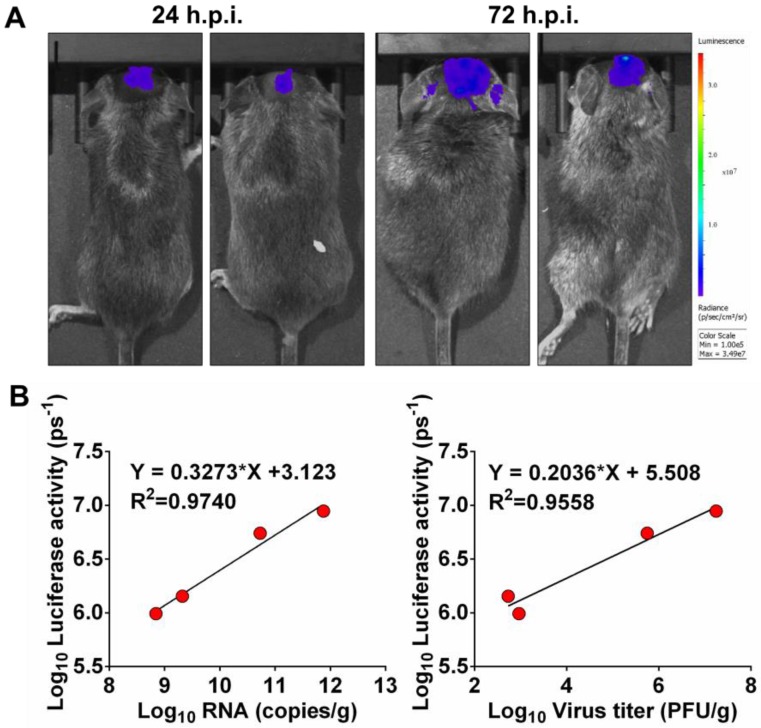
Correlation between fluorescence signal and viral replication. (A) IFNAR-/- mice were infected i.c. with 102.5 PFU of Rluc-JEV and subjected to imaging at 24 and 72 h.p.i.. BLI was performed for 90 s, and fluorescence signals were quantified using Living Image software 3.0. (B) Viral RNA and viral titers in excised brains were quantified by real time RT-PCR and plaque assay, respectively. The photon flux determined as described in the legend to Fig. 3 was plotted against the RNA copies or viral titer (PFU/g).

