

Abstract
Background:
Active tuberculosis (TB) with negative results of sputum smear is difficult to be identified. Till now, there is no effective and noninvasive diagnostic method. This study evaluated the diagnostic power of Mycobacterium tuberculosis T-cell (T.SPOT®.TB) assays for active TB.
Methods:
We retrospectively screened 450 suspected TB patients that were hospitalized in the Respiratory Department of Henan Province People's Hospital from June 2015 to June 2016. The patients were divided into the active, previous, and non-TB groups according to their final diagnosis. We evaluated the diagnostic value of the T-SPOT®.TB assay by constructing receiver operating characteristic (ROC) curves and calculating the optimal diagnostic cutoff value. In addition, we compared the levels of A antigen (ESAT-6) and B antigen (CFP-10) in active TB.
Results:
The sensitivity, specificity, positive predictive value, negative predictive value, positive likelihood ratio, and negative likelihood ratio of T-SPOT®.TB for active TB were 89.78%, 63.16%, 0.56, 0.92, 2.47, and 0.16, respectively. For active TB, the area under the ROC curve (AUC) of the A antigen (0.89) was higher than that of the B antigen (0.86). The AUC of the A antigen for active TB was largest at a cutoff value of 13.5 spot-forming cells (SFCs) per 2.5 × 10⁵ peripheral blood mononuclear cells (PBMCs). The AUC of the A and B antigens was 0.60 and 0.58 for previous TB. The levels of A and B antigen in the active TB group were significantly different from those in the previous- and non-TB groups (A antigen: χ2 = 105.41, P < 0.01 and B antigen: χ2 = 91.03, P < 0.01; A antigen: χ2 = 12.99, P < 0.01 and B antigen: χ2 = 8.56, P < 0.01, respectively). There were no significant differences in the levels of A and B antigens between the non-TB group and previous TB group (A antigen: χ2 = 1.07, Pw> 0.05 and B antigen: χ2 = 0.77, P> 0.05).
Conclusions:
T-SPOT®.TB has high sensitivity and specificity for the diagnosis of active TB at a cutoff value of 13.5 SFCs per 2.5 × 10⁵ PBMCs and is not influenced by previous TB.
Keywords: Active Tuberculosis, Diagnosis, Receiver Operating Characteristic Curve, T-SPOT®.TB
Introduction
Tuberculosis (TB) is one of the most lethal diseases caused by a single pathogen. The most recently reported incidence of TB in China was 94 per 1 million, and the morbidity rate was 68 per 10 million. In 2015, low- and middle-income countries spent the equivalent of about 80 billion US dollars in TB control, 8% of which was used for the development of rapid TB detection methods and laboratory equipments. The World Health Organization has put forward a new strategy “Stop TB” on the basis of the “Containment of TB strategy”.[1]
Unfortunately, the diagnosis of TB remains a challenge, particularly in China. In China, about 70% of TB patients have negative bacteriological findings, which makes TB difficult to diagnose.[2] Conventional TB diagnosis relies on percutaneous needle lung biopsy or bronchoscopic biopsy. These are invasive methods, which carry a risk of bleeding, pneumothorax, and seeding of the bacterium along the needle path. Further, the positive rate of those methods is <20%, and these methods cannot be applied in patients with a poor general condition.[3,4] An alternative is the purified protein derivative (PPD) test, which can be implemented easily, but is highly dependent on the patients’ immune function. A delayed allergic reaction and previous Bacillus Calmette–Guérin (BCG) vaccination can lead to false-positive PPD results, whereas immune suppression, HIV coinfection, other recent infections, malnutrition, and a very young or old age can yield false-negative PPD results.[5,6] Moreover, the sensitivity of PPD is significantly decreased in low- and middle-income countries.[7] T-SPOT®.TB is a new technology, with high sensitivity and specificity for TB, theoretically up to 98% and 99%, respectively. In 2009, it was certified by the American Food and Drug Administration. In 2015, the Editorial Board of the Chinese Journal of Tuberculosis and Respiratory Diseases, a branch of the Chinese Medical Association, recommended that T-SPOT®.TB could be used as a complementary and supplementary diagnostic tool for Mycobacterium tuberculosis (MTB) infection.[8] The present study investigated the effectiveness of T-SPOT®.TB in distinguishing between active, previous TB, and non-TB patients and assessed the diagnostic power of T-SPOT®.TB for active TB.
Methods
Subjects
We conducted this retrospective study with the approval of the Ethics Committee of Henan Province People's Hospital. The patients who attended the Department of Respiratory and Critical Medicine of Henan Province People's Hospital from June 2015 to June 2016 and underwent T-SPOT®.TB assays were recruited for the study. The inclusion criteria were as follows: age >18 years; admitted to the group through telephone counseling; typical TB symptoms and/or signs such as cough, expectoration, hemoptysis, fever, emaciation, fatigue, and night sweats; and chest radiographs revealed nodules, cavities, cysts, calcifications, contours of the large bronchi, and vascular details in the lung parenchyma or other parts. Patients were excluded if they were without a clear diagnosis; had no etiology or histopathological data; had severe pneumonia, acute exacerbation of chronic obstructive pulmonary disease, severe hemoptysis, or other severe respiratory diseases; had severe immunosuppression (such as HIV or continuous use of corticosteroids [e.g., ≥30 mg prednisone daily for more than 2 weeks]); or had ambiguous T-SPOT®.TB and tuberculin skin test (TST) results.
Diagnostic standards and grouping of patients
TB was diagnosed according to the Centers for Disease Control Prevention guidelines: (1) Clinically active TB: This group consisted of patients with clinically active TB who had undergone complete diagnostic procedures, regardless of any previous TB history. This was established most definitively by isolation of MTB. In the absence of a positive culture for MTB, persons in this class had to have a positive reaction to the TST (with no BCG vaccination or previous TB), clinical or radiographic evidence of current TB, or had to have been cured after standard anti-TB treatment. (2) Previous TB: This group consisted of patients with a history of the previous episode(s) of TB or abnormal radiographic findings in a person with a positive reaction to the TST, negative bacteriologic studies (if these were performed), and no clinical and/or radiographic evidence of current disease. Any patients with a history of TB were included in this group, regardless of whether they had received chemotherapy. (3) Non-TB: This group consisted of patients with pathological findings showing a clear tumor, inflammation, or other diseases and included individuals in whom other diseases were clinically diagnosed, after the appropriate treatment or follow-up.
Tuberculin skin test
In cases where the diagnosis was unclear and the patients had no BCG vaccination or previous TB, we performed a TST. The TST was administered by experienced, trained staff. In the TST, 0.1 ml (5 IU) of PPD reagent (Chengdu Institute of Biological Products Co. Ltd., China) was injected intracutaneously into the forearm. After 72 h, two doctors measured the diameter of induration; these clinicians were blinded to other patient information. An average induration diameter of >5 mm was considered a positive result.
Sample collection and T-SPOT®.TB test
For this assay, 5 ml of peripheral venous blood was collected and immersed in heparin lithium anticoagulant tubes. The T-SPOT®.TB kit was supplied by Oxford Immunotec (Abingdon, UK), and testing procedures were implemented strictly according to the kit manual. The deep blue spots were counted as described by the manufacturer to determine the results. Criteria: The positive result: (1) The negative control hole spot points were 0–5, and (A antigen or B antigen spot points) – (the negative control hole spot points) ≥6; (2) while the negative control hole spots ≥6, and (A antigen or antigen B spot points) ≥2 times (the negative control hole spots); the negative result does not meet the positive criteria, and the control hole of aseptic phytohemagglutinin is normal.
Statistical analysis
Two trained laboratory workers judged the results of the T-SPOT®.TB assay and the final diagnosis according to the reference standard at the same time, in a double-blinded manner. Statistical analyses were performed using SPSS software version 17.0 (International Business Machines Corporation, USA). Measurement data were expressed as a mean ± standard deviation (SD). We calculated the diagnostic accuracy of T-SPOT®.TB in all patients diagnosed with active TB including the sensitivity, specificity, positive predictive value, negative predictive value, and Youden index. We also generated receiver operating characteristic (ROC) curves of T-SPOT®.TB data for the diagnosis of active and previous TB and determined the optimal cutoff value for diagnosis. We compared the differences between the TB groups using Kruskal − Wallis rank sum test. All tests were two sided, and P < 0.05 was considered to indicate statistically significant differences.
Results
Clinical diagnosis
We initially enrolled 510 cases; however, after reviewing the recorded test data, we excluded sixty cases: 16 cases did not have a clear diagnosis, 24 cases had neither pathological nor bacteriological data, 11 cases had severe respiratory disease, three cases had HIV, and six cases had no definite TST results. Finally, 450 patients were included (296 men and 154 women). Their age ranged from 18 to 91 years (average 51.9 ± 19.7 years). Among the 450 cases, 132 cases (33%) had active TB, 257 cases (64%) were non-TB patients, and 61 cases (3%) had previous TB.
Overall, 244 cases (55%) were T-SPOT®.TB positive and 206 cases (45%) were T-SPOT®.TB negative. In the active TB group, 14 cases were negative for T-SPOT®.TB and 118 cases were positive for T-SPOT®.TB; this group included 76 cases of pulmonary, 31 pleural, 8 meningeal, 2 endobronchial, 6 abdominal, 4 lymph node, and 5 spinal TB. In the non-TB group, 95 cases were positive for T-SPOT®.TB and 162 were negative for T-SPOT®.TB; these included 144 cases of infectious diseases, 52 cases with tumors, and 64 cases with another diagnosis such as noninfectious fever, interstitial pneumonia, bronchiectasis, and hypersensitivity pneumonitis. In the previous TB group, 31 cases were positive for T-SPOT®.TB and 30 cases were negative; this group included 37 cases with lung infection, 12 cases with chronic obstructive pulmonary disease, and 12 cases with another diagnosis [Table 1].
Table 1.
Results of T-SPOT®.TB assay in each group
| Groups | n | T-SPOT®.TB | Data (SFCs), mean ± SD | ||
|---|---|---|---|---|---|
| Positive (n) | Negative (n) | A antigen | B antigen | ||
| Active TB | 132 | 118 | 14 | 87.57 ± 8.14 | 66.24 ± 8.65 |
| Pulmonary TB | 76 | 72 | 4 | 83.76 ± 8.70 | 57.84 ± 8.95 |
| Pleural TB | 31 | 27 | 4 | 96.00 ± 21.22 | 92.52 ± 22.41 |
| Meningeal TB | 8 | 6 | 2 | 82.40 ± 40.44 | 82.60 ± 39.83 |
| Abdominal TB | 6 | 6 | 0 | 65.40 ± 22.77 | 23.20 ± 9.45 |
| Spinal TB | 5 | 2 | 3 | 11.33 ± 9.40 | 6.00 ± 4.50 |
| Lymphoid TB | 4 | 3 | 1 | 242.50 ± 57.50 | 179.50 ± 170.50 |
| Endobronchial TB | 2 | 2 | 0 | 160.00 ± 45.23 | 30.00 ± 22.58 |
| Non-TB | 257 | 95 | 162 | 9.35 ± 1.52 | 6.66 ± 1.17 |
| Previous TB | 61 | 31 | 30 | 14.30 ± 5.63 | 16.10 ± 10.23 |
TB: Tuberculosis; SD: Standard deviation; SFCs: Spot-forming cells.
Diagnostic value of T-SPOT®.TB in active tuberculosis
The sensitivity, specificity, positive predictive value, negative predictive value, positive likelihood ratio, and the negative likelihood ratio of the T-SPOT®.TB assay in the active TB group were 89.78%, 63.16%, 0.56, 0.92, 2.47, and 0.16, respectively. Youden index was 0.53.
A antigen and B antigen in each group
The values of A antigen and B antigen in the active TB group ranked 204.57 and 198.68, respectively. In the previous TB group, the values of A and B antigen were ranked 120.60 and 123.55, respectively. In the non-TB group, the A and B antigen ranks were 100.04 and 102.90, respectively. There was a significant difference in A antigen (χ2 = 106.93, P < 0.01) and B antigen (χ2 = 91.47, P < 0.01) ranks among the three groups. Upon closer examination, the differences in A and B antigens between the active TB and previous TB (A antigen: χ2 = 12.99, P < 0.01 and antigen B: χ2 = 8.56, P < 0.01) and the non-TB group (A antigen: χ2 = 105.41, P < 0.01 and antigen B: χ2 = 91.03, P < 0.01) were significant. There was no significant difference between the previous TB and non-TB groups (A antigen: χ2 = 1.07, P = 0.30 and B antigen: χ2 = 0.77, P = 0.38) [Table 2]. There were also no significant differences in A and B antigen ranks between the sputum smear-positive and smear-negative individuals (P = 0.68 and P = 0.55, respectively), or among those with pulmonary, pleural, or extrapulmonary TB (P = 0.89 and P = 0.21, respectively).
Table 2.
Differential analysis of A antigen and B antigen ranking in active, previous, and non-TB groups
| Groups | A antigen | B antigen | ||||
|---|---|---|---|---|---|---|
| Rank | χ2 | P | Rank | χ2 | P | |
| Active TB group | 196.08 | 105.41 | <0.01 | 190.85 | 91.03 | <0.01 |
| Sputum smear (+) | 47.38 | 0.18 | 0.68 | 12 | 0.36 | 0.55 |
| Sputum smear (−) | 44.05 | 76 | ||||
| Pulmonary | 45.25 | 0.25 | 0.89 | 44.85 | 3.13 | 0.21 |
| Pleural | 44.83 | 50.48 | ||||
| Extrapulmonary | 41.66 | 35.53 | ||||
| Previous TB group | 107.30 | 1.07 | 0.30 | 104.46 | 0.77 | 0.38 |
TB: Tuberculosis.
Receiver operating characteristic curves of T-SPOT®.TB for diagnosis of active tuberculosis
ROC curves were drawn with sensitivity as the horizontal coordinate and the 1-specificity as the vertical coordinate. In the active TB infection group, the area under the ROC curve (AUC) of A and B antigens was 0.89 and 0.87, respectively, and at a cutoff of 13.5 spot-forming cells (SFCs) per 2.5 × 10⁵ peripheral blood mononuclear cells (PBMCs), the diagnostic value of the A antigen was optimal, and Youden index was maximal (0.71). At this cutoff, sensitivity was 84.10% and specificity was 86.50% [Figure 1].
Figure 1.
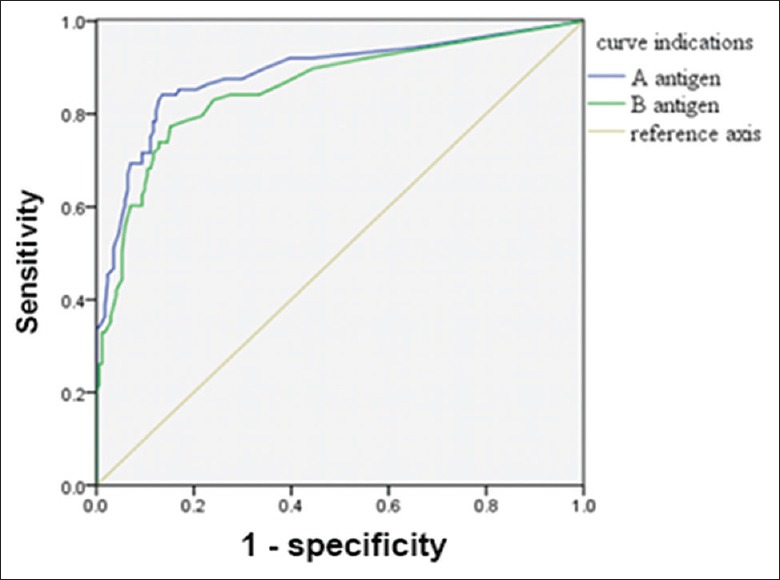
Receiver operating characteristic curve of A antigen and B antigen for the diagnosis of active tuberculosis.
The AUCs of the A and B antigens in the previous TB group were 0.60 and 0.58, respectively. When the cutoff of the A antigen was 2.5 SFCs per 2.5 × 10⁵ PBMCs, the diagnostic power of the A antigen value was optimal and Youden index was 0.16. At this cutoff, the sensitivity was 60.00% and the specificity was 55.60% [Figure 2].
Figure 2.
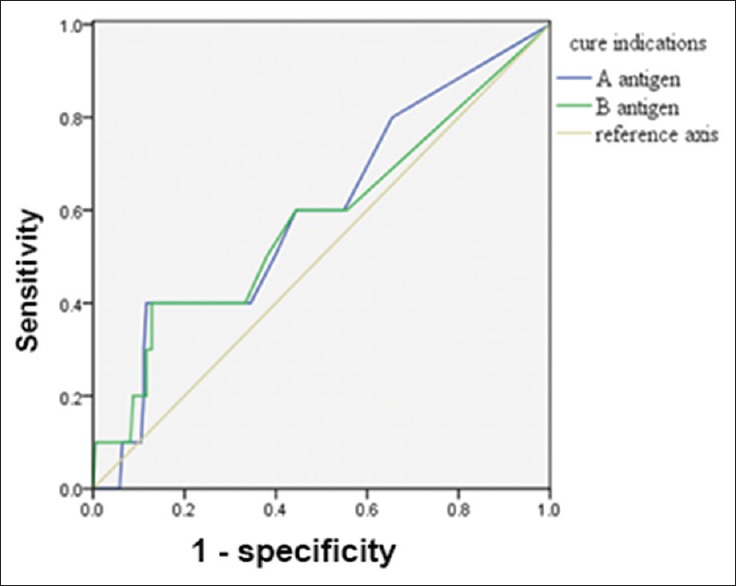
Receiver operating characteristic curve of A antigen and B antigen for the diagnosis of previous tuberculosis.
If both A and B antigens together (A + B antigen) were used as the criterion for diagnosing active and previous TB, the AUCs were 0.89 and 0.618, respectively. When the A + B antigen cutoff was 44 and 14 SFCs per 2.5 × 10⁵ PBMCs, respectively, the diagnostic value was optimal. At these cutoffs, the sensitivity and specificity for diagnosing active and previous TB were 81% and 87%, and 50% and 79%, respectively [Figures 3 and 4].
Figure 3.
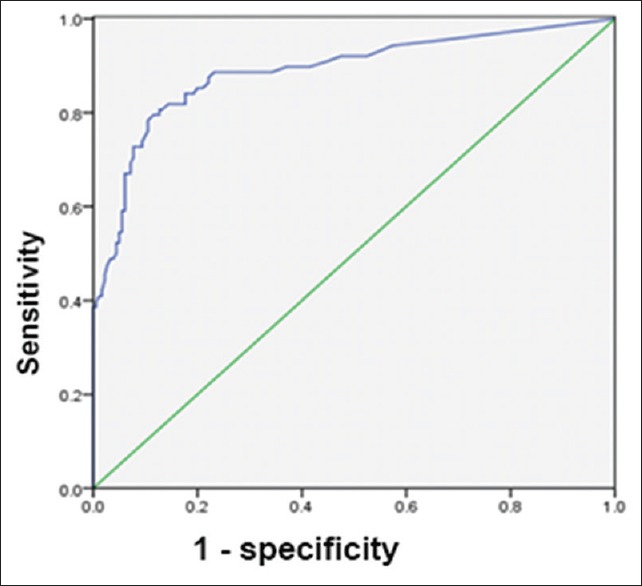
Receiver operating characteristic curve of A + B antigen for the diagnosis of active tuberculosis.
Figure 4.
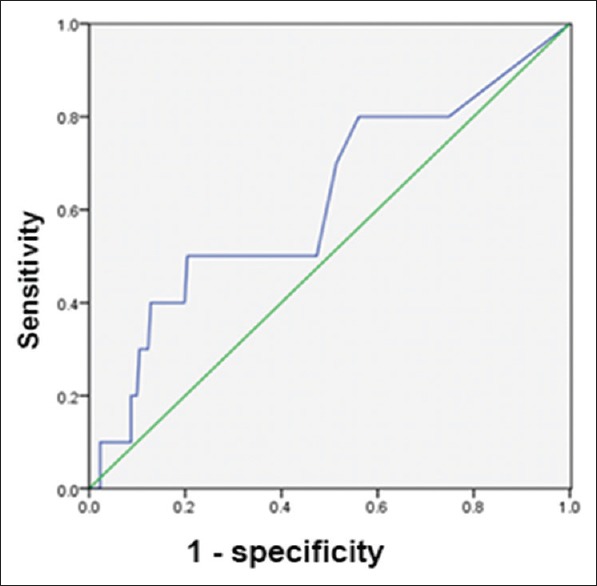
Receiver operating characteristic curve of A + B antigen for the diagnosis of previous tuberculosis.
Discussion
This study verified that T-SPOT®.TB can differentiate different groups of TB infection. The T-SPOT®.TB assay tests for the presence of specific antigens of MTB, i.e., ESAT-6 and CFP-10. As reported by a large number of studies in China, the sensitivity and specificity of T-SPOT®.TB exceed 70%. Sun and Shen[9] performed a meta-analysis of nine studies, showing that the T-SPOT®.TB test had a sensitivity of 94% in the diagnosis of active TB. Pai et al.[10] reported in a meta-analysis of six studies that the overall sensitivity and specificity were 93% and 93% in adults with no history of exposure to TB. Our study concluded that the sensitivity of T-SPOT®.TB was 89.78%, and its specificity was 63.16%, for active TB; these values were slightly lower than those shown by previous studies. This may be related to the older age of the patients in our study, as the average age was 52 years, and individuals exceeding 60 years of age accounted for 42% of our study population. Although our study did not analyze the impact of age on T-SPOT®.TB results, two studies in a Japanese population found that the sensitivity of T-SPOT®.TB was lower in the elderly than in younger individuals with suspected active TB.[11,12,13] An increased age may be associated with low immunity, poor nutritional status, and increased comorbidity. The quantity and function of T-cells declines with age, resulting in decreased specificity of the antigen−antibody reaction, and thus decreased sensitivity of the T-SPOT®.TB test.[14] The low specificity in this study may be caused by latent TB, a vegetarian diet, or Escherichia coli, Mycobacterium kansasii, or Mycobacterium gordonae infection since T-cells activated by these pathogens may also react with the A or B antigen. In addition, Amirzargar et al.[15] reported that some genes in humans offer a form of resistance to MTB infection such as human leukocyte antigen (HLA) genotypes HLA-DRB1*0501 and HLA-DQA1*0301. Individuals harboring these genes are not susceptible to MTB infection, which may also result in decreased sensitivity and specificity.
Our study showed that T-SPOT®.TB did not distinguish between latent TB or active TB.[16] T-SPOT®.TB specifically detects T-cells in blood, to determine whether MTB infection is present. Latent TB does not require immediate chemotherapy, and the disease progression can be monitored by clinical observation; however, active TB requires immediate treatment so as to prevent disease progression. There is an urgent need for effective supplementary means of diagnosis of active TB. In this study, we determined that when the A antigen cutoff was 13.5 SFCs per 2.5 × 10⁵ PBMCs, the diagnostic value was optimal; at this cutoff, Youden index reached a maximum of 0.71, and the sensitivity and specificity were 84.10% and 86.50%, respectively. This suggests that this cutoff value has the most power to distinguish between active and latent TB. Sun et al.[17] also proposed that a cutoff value based on the number of SFCs would allow the identification of active and latent TB.
Anti-TB treatment will affect the results of the T-SPOT®.TB assay. The results of the T-SPOT®.TB test in TB patients were significantly more frequently positive before anti-TB treatment than thereafter (83% and 17%, respectively).[18] Liu et al.[19] reported an average of 47 A antigen (ESAT-6) spots and 18 B antigen (CFP-10) spots per 2.5 × 10⁵ PBMCs, after 2 and 4 weeks of anti-TB treatment, which was significantly lower than that found before treatment (99 and 49, respectively; P < 0.05). However, these findings did not explain the specific value of the A antigen after undergoing treatment for active TB.
Our study findings require further confirmation. If T-SPOT®.TB results can be obtained over a longer period, the specific value of the A antigen in patients with active TB can be determined after the disease has been completely cured. If this value reached 13.5 SFCs per 2.5 × 10⁵ PBMCs or less, it would verify the use of this cutoff value. In cases where the T-SPOT®.TB results are positive, but A antigen levels are <13.5 SFCs per 2.5 × 10⁵ PBMCs, latent TB is the most likely diagnosis, and the diagnosis of active TB would require a combination of clinical and other findings. In addition, we found that using the A + B antigens as the standard for diagnosis was not superior to using only the A or B antigen. Moreover, the diagnostic value of the A antigen was superior to that of the B antigen, suggesting that the A antigen should be used as a standard of judgment in clinical work, as far as possible, using the cutoff value of 13.5 SFCs per 2.5 × 10⁵ PBMCs, for the diagnosis of active TB.
Previous TB accounts for nearly 20% of the diagnoses of TB: Li and Luo[20] reported that 18% of cases diagnosed with pulmonary TB were actually previous TB cases. At present, it is not clear whether a history of TB will affect the results of the T-SPOT®.TB test. Zhang et al.[21] reported that previous TB can cause false-positive results in the T-SPOT®.TB test. In the present study, we obtained AUCs of 0.595 and 0.579 for the A and B antigens, respectively, for previous TB; these values were close to 0.5, implying that these antigens had minimal diagnostic significance for previous TB. Moreover, between the previous TB group and the non-TB group, there were no statistically significant differences in the A and B antigens, whereas there were statistically significant differences in these values between the active TB group and the other two groups. This is probably because the effector T-cells only survive for a short period in vivo and disappear after pathogen eradication;[22] thus, after MTB has been completely cleared and the lesions remain stable, the T-SPOT®.TB test should be negative.[23] Another study found that interferon-gamma release assays also assessed present rather than past infections;[24] however, the T-SPOT®.TB findings of patients with previous TB were sometimes positive, which may indicate latent TB or may be caused by other mycobacterium species such as M. kansasii and M. gordonae.
In summary, T-SPOT®.TB has a high sensitivity and specificity for the diagnosis of active TB and is not influenced by previous TB or BCG vaccination. It can be used to distinguish active TB from latent TB. Thus, it can be useful for the diagnosis of active TB.
Financial support and sponsorship
This study was supported by a grant from the International Scientific and Technological Cooperation Project in Science and Technology Bureau of Zhengzhou City (No. 141PGJHZ533).
Conflicts of interest
There are no conflicts of interest.
Acknowledgments
The authors thank Zhi-Wei Xu of the People's Hospital of Zhengzhou University for his assistance in statistical analysis. We also thank Xi-Tao Ma of the People's Hospital of Zhengzhou University for language assistance.
Footnotes
Edited by: Yi Cui
References
- 1.World Health Organization. Global Tuberculosis Report. Geneva: World Health Organization; 2015. pp. 1–30. [Google Scholar]
- 2.Lin Y, Tan SY. Discussion on the current situation of the establishment of the bacteriological negative pulmonary tuberculosis diagnosis model. J Tuberc Lung Health. 2013;2:235–8. doi: 10.3969/j.issn.2095-3755.2013.04.004. [Google Scholar]
- 3.Cheng XH, Bian SN, Zhang YQ, Zhang LF, Shi XC, Yang B, et al. Diagnostic value of t-cell interferon-γrelease assays on synovial fluid for articular tuberculosis: A pilot study. Chin Med J. 2016;129:1171–8. doi: 10.4103/0366-6999.181958. doi: 10.4103/0366-6999.181958. [DOI] [PMC free article] [PubMed] [Google Scholar]
- 4.Dai T, Xu CM, Yang W. Diagnostic value of CT guided percutaneous lung biopsy in the diagnosis of peripheral pulmonary lesions (in Chinese) J Clin Pulm Med. 2013;18:11–3. doi: 10.3969/j.issn.1009-6663.2013.01.006. [Google Scholar]
- 5.Si ZL, Kang LL, Shen XB, Zhou YZ. Adjuvant efficacy of nutrition support during pulmonary tuberculosis treating course: Systematic review and meta-analysis. Chin Med J. 2015;128:3219–30. doi: 10.4103/0366-6999.170255. doi: 10.4103/0366-6999.170255. [DOI] [PMC free article] [PubMed] [Google Scholar]
- 6.Chu XM, Kong JX. Sensitivity and specificity of enzyme linked immunosorbent assay for diagnosis of tuberculosis. Acta Univ Med Anhui. 2012;47:613–5. doi: 10.3969/j.issn.1000-1492.2012.05.037. [Google Scholar]
- 7.Kerkhoff AD, Kranzer K, Samandari T, Nakiyingi-Miiro J, Whalen CC, Harries AD, et al. Systematic review of TST responses in people living with HIV in under-resourced settings: Implications for isoniazid preventive therapy. PLoS One. 2012;7:e49928. doi: 10.1371/journal.pone.0049928. doi: 10.1371/journal.pone.0049928. [DOI] [PMC free article] [PubMed] [Google Scholar]
- 8.Tuberculosis Branch of the Chinese Medical Association, the Editorial Board of Chinese Journal of Tuberculosis and Respiratory Diseases. Recommendations for the application of interferon gamma release test in China (in Chinese) Chin J Tuberc Respir Dis. 2014;37:744–6. doi: 10.3760/cma.j.issn.1001-0939.2014.10.011. [Google Scholar]
- 9.Sun L, Shen AD. Application of interferon gamma release test in the diagnosis of tuberculosis infection and active tuberculosis (in Chinese) Chin J Evid Based Pediatr. 2010;5:469–76. doi: 10.3969/j.issn.1673-5501.2010.06.013. [Google Scholar]
- 10.Pai M, Zwerling A, Menzies D. Systematic review: T-cell-based assays for the diagnosis of latent tuberculosis infection: An update. Ann Intern Med. 2008;149:177–84. doi: 10.7326/0003-4819-149-3-200808050-00241. doi: 10.7326/0003-4819-149-3-200808050-00241. [DOI] [PMC free article] [PubMed] [Google Scholar]
- 11.Kobashi Y, Mouri K, Yagi S, Obase Y, Miyashita N, Okimoto N, et al. Clinical utility of the QuantiFERON TB-2G test for elderly patients with active tuberculosis. Chest. 2008;133:1196–202. doi: 10.1378/chest.07-1995. doi: 10.1136/pgmj.2003.009456. [DOI] [PubMed] [Google Scholar]
- 12.Kobashi Y, Mouri K, Miyashita N, Okimoto N, Matsushima T, Kageoka T, et al. QuantiFERON TB-2G test for patients with active tuberculosis stratified by age groups. Scand J Infect Dis. 2009;41:841–6. doi: 10.3109/00365540903186215. doi: 10.3109/00365540903186215. [DOI] [PubMed] [Google Scholar]
- 13.Pan LP, Jia HY, Liu F, Gao MQ, Sun HS, Du BP, et al. Diagnostic value of interferon gamma release test for suspected pulmonary tuberculosis in different age groups (in Chinese) Chin J Tuberc Respir Dis. 2015;38:892–6. doi: 10.3760/cma.j.issn.1001-0939.2015.12.005. [PubMed] [Google Scholar]
- 14.Tavares SM, Junior Wde L, Lopes E, Silva MR. Normal lymphocyte immunophenotype in an elderly population. Rev Bras Hematol Hemoter. 2014;36:180–3. doi: 10.1016/j.bjhh.2014.03.021. doi: 10.1016/j.bjhh.2014.03.021. [DOI] [PMC free article] [PubMed] [Google Scholar]
- 15.Amirzargar AA, Yalda A, Hajabolbaghi M, Khosravi F, Jabbari H, Rezaei N, et al. The association of HLA-DRB, DQA1, DQB1 alleles and haplotype frequency in Iranian patients with pulmonary tuberculosis. Int J Tuberc Lung Dis. 2004;8:1017–21. [PubMed] [Google Scholar]
- 16.Gao L, Lu W, Bai L, Wang X, Xu J, Catanzaro A, et al. Latent tuberculosis infection in rural China: Baseline results of a population-based, multicentre, prospective cohort study. Lancet Infect Dis. 2015;15:310–9. doi: 10.1016/S1473-3099(14)71085-0. doi: 10.1016/S1473-3099(14)71085-0. [DOI] [PubMed] [Google Scholar]
- 17.Sun L, Xiao J, Li HM, Jiao WW, Feng WX, Wu XR, et al. Evaluation of the tuberculin skin test and the whole-blood interferon-1 assay for diagnosis of latent tuberculosis infection in children (in Chinese) Chin J Evid Based Pediatr. 2010;5:201–6. doi: 10.3969/j.issn. 16735501.2010.03.007. [Google Scholar]
- 18.Aiken AM, Hill PC, Fox A, McAdam KP, Jackson-Sillah D, Lugos MD, et al. Reversion of the ELISPOT test after treatment in Gambian tuberculosis cases. BMC Infect Dis. 2006;6:66. doi: 10.1186/1471-2334-6-66. doi: 10.1186/1471-2334-6-66. [DOI] [PMC free article] [PubMed] [Google Scholar]
- 19.Liu H, Huang YJ, Jing W, Ni R, Zhang Z, Guo XZ, et al. The value of T-cell spot test in the diagnosis of suspected tuberculosis patients with tuberculosis infection (in Chinese) Chin J Tuberc Respir Dis. 2014;37:192–5. doi: 10.3760/cma.j.issn.1001-0939.2014.03.010. [Google Scholar]
- 20.Li B, Luo WT. Discussion on classification of pulmonary tuberculosis (in Chinese) Chin J Tuberc Respir Dis. 2003;26:234–5. doi: 10.3760/j:issn:1001-0939.1998.12.005. [Google Scholar]
- 21.Zhang SM, Zhou H, Fu YQ, Shen YH, Zhou JY. The clinical value of γ-interferon release test in the diagnosis of active tuberculosis (in Chinese) Chin J Tuberc Respir Dis. 2014;37:372–3. doi: 10.3760/cma.j.issn. 1001-0939.2014.05.016. [Google Scholar]
- 22.Ribeiro S, Dooley K, Hackman J, Loredo C, Efron A, Chaisson RE, et al. T-SPOT.TB responses during treatment of pulmonary tuberculosis. BMC Infect Dis. 2009;9:23. doi: 10.1186/1471-2334-9-23. doi: 10.1186/1471-2334-9-23. [DOI] [PMC free article] [PubMed] [Google Scholar]
- 23.Cruz AT, Geltemeyer AM, Starke JR, Flores JA, Graviss EA, Smith KC. Comparing the tuberculin skin test and T-SPOT.TB blood test in children. Pediatrics. 2011;127:e31–8. doi: 10.1542/peds.2010-1725. doi: 10.1542/peds.2010-1725. [DOI] [PubMed] [Google Scholar]
- 24.Catanzaro A, Daley C. A summary of the Third Global Interferon-gamma Release Assay Symposium. Infect Control Hosp Epidemiol. 2013;34:619–24. doi: 10.1086/670634. doi: 10.1086/670634. [DOI] [PubMed] [Google Scholar]