

Abstract
Understanding and predicting the fate of populations in changing environments require knowledge about the mechanisms that support phenotypic plasticity and the adaptive value and evolutionary fate of genetic variation within populations. Atlantic killifish (Fundulus heteroclitus) exhibit extensive phenotypic plasticity that supports large population sizes in highly fluctuating estuarine environments. Populations have also evolved diverse local adaptations. To yield insights into the genomic variation that supports their adaptability, we sequenced a reference genome and 48 additional whole genomes from a wild population. Evolution of genes associated with cell cycle regulation and apoptosis is accelerated along the killifish lineage, which is likely tied to adaptations for life in highly variable estuarine environments. Genome-wide standing genetic variation, including nucleotide diversity and copy number variation, is extremely high. The highest diversity genes are those associated with immune function and olfaction, whereas genes under greatest evolutionary constraint are those associated with neurological, developmental, and cytoskeletal functions. Reduced genetic variation is detected for tight junction proteins, which in killifish regulate paracellular permeability that supports their extreme physiological flexibility. Low-diversity genes engage in more regulatory interactions than high-diversity genes, consistent with the influence of pleiotropic constraint on molecular evolution. High genetic variation is crucial for continued persistence of species given the pace of contemporary environmental change. Killifish populations harbor among the highest levels of nucleotide diversity yet reported for a vertebrate species, and thus may serve as a useful model system for studying evolutionary potential in variable and changing environments.
Keywords: population genomics, genome sequence, comparative genomics, adaptation, genetic diversity
Introduction
Phenotypic variation enables populations to persist in variable and changing environments. When individual phenotypes change in response to environmental change, this plasticity can serve to maintain or improve fitness. Alternatively, when phenotypes vary among individuals and this variation is heritable, natural selection may shape underlying genotype frequencies across generations resulting in the evolution of locally adapted phenotypes. Furthermore, when phenotypic responses that vary among individuals are heritable, phenotypic plasticity itself may be subject to evolutionary change and contribute to maintaining or elevating fitness in changing environments (Via and Lande 1985; Lande 2009). Indeed, phenotypic plasticity may interact with natural selection to either enable or disable local adaptation depending on the nature of genetic variation within populations, the costs and limits of plasticity, and gene flow (Crispo 2008). Long-standing goals for ecophysiology and evolutionary biology are to understand the genetic and genomic mechanisms that underpin phenotypic plasticity (Scheiner 1993; Via et al. 1995; Schlichting and Smith 2002) and that enable local adaptation (Savolainen et al. 2013). We develop the Atlantic killifish (Fundulus heteroclitus) as a genome-enabled model system for addressing such research questions; individuals exhibit high physiological plasticity, populations demonstrate local adaptation to both old and very recent environmental change, and plasticity itself has evolved within and between Fundulus species.
Estuarine habitats present diverse challenges for native fauna because periodic and stochastic variability in environmental parameters such as salinity, dissolved oxygen, nutrients, and temperature is common and often dramatic (Wolanski 2007), and because they are often transformed by human activities (Lotze et al. 2006). Because of this, estuarine species must exhibit much physiological resilience. Fundulus heteroclitus are estuarine specialists, and they are among the most abundant vertebrate animals inhabiting salt marshes along the North American Atlantic coast (Valiela et al. 1977). They are physiologically resilient to variable temperature, salinity, and dissolved oxygen, contributing to their success and numerical dominance in estuarine habitats. Accordingly, F. heteroclitus has emerged as an important model in physiological ecology (Burnett et al. 2007), especially for the study of ion transport (Wood and Marshall 1994) where their extreme physiological plasticity is rare among fishes (Schultz and McCormick 2013). Indeed, their resilience likely contributed to the choice of F. heteroclitus as the first fish to be used for experiments in outer space (von Baumgarten et al. 1975). Coupled with decades of physiology research, transcriptomics studies are revealing functional genomic mechanisms that enable physiological plasticity (Whitehead, Roach, et al. 2011; Shaw et al. 2014; Dayan et al. 2015), such that comparisons of whole-genome sequences within and between species are now poised to yield crucial insights about the genes and pathways that are important for the physiological plasticity that defines this species.
In addition to phenotypic plasticity, the evolutionary potential of species is intertwined with the abundance, distribution, and adaptive value of the genetic variation that they harbor. Yet understanding the evolutionary forces, and the features of populations and species, that govern the origin and fate of genetic variation within populations remains an enduring challenge. Species with 1) populations distributed along environmental gradients, 2) large population sizes, 3) low migration rates, and 4) closely related species that exhibit parallelism or variation in niche and population size are advantageous models to better understand the genetic basis of environmental adaptation. Atlantic killifish (F. heteroclitus) have all of these attributes. As mentioned, environmental parameters are highly variable within individual coastal estuaries, yet these parameters also vary among different sites. Living along the east coast of North America, F. heteroclitus are subject to gradients in temperature, salinity, dissolved oxygen, and environmental pollution. As F. heteroclitus populations are large with low migration (Able et al. 2012), selection can be efficient such that populations may evolve adaptations to local environments. Indeed, F. heteroclitus populations have derived variable tolerance to temperature and salinity extremes (e.g., Scott et al. 2004; Fangue et al. 2006; Whitehead, Roach, et al. 2011). They have also rapidly and repeatedly evolved adaptations to abruptly and radically altered habitats that are contaminated with industrial pollutants (Van Veld and Nacci 2008). Accordingly, F. heteroclitus is a classic model for understanding evolution along environmental gradients (Powers et al. 1993) and is a novel vertebrate model for studying rapid adaptation to human-induced environmental change and evolutionary rescue (Bell 2013; Reid et al. 2016). Advances in high-throughput DNA sequencing have enabled the characterization of genetic variation across the whole genome for many individuals within a population, opening the door to the development of new model species for studying environmental adaptation (Leffler et al. 2012).
We have developed a well-annotated F. heteroclitus reference genome and characterized whole-genome variation among 48 individuals within a population located near the northern end of their range. Our goal was to produce a high-quality reference genome, with careful annotation of functional features including protein-coding genes, mobile elements, and microRNAs (miRNAs). By comparing genome sequence variation with other fish species, we identify genes and processes that may contribute to the physiological plasticity and adaptability for which F. heteroclitus is known. By characterizing genome-wide sequence variation among many individuals within a population, we model demographic history, reveal surprisingly high genetic variation, and offer insight into the evolutionary forces governing the fate of this variation.
Materials and Methods
Genome Sequencing and Assembly
Four sets of sequencing libraries were prepared from DNA fragments of different sizes including 300-bp, 3-, 8-, and 40-kb (fosmid) fragments. One individual female fish provided source DNA for the 300-bp, 3-, and 8-kb libraries (captured from Chewonki Campground, ME: 43°57′15.01″N, 69°43′13.64″W in August, 2010), whereas a second individual (captured from Northeast Creek, ME: 44°25′29.04″N, 68°19′36.91″W in July, 2010) provided source DNA for the 40-kb fosmid libraries. Fish from Maine were chosen because they have the lowest heterozygosity among F. heteroclitus populations (Duvernell et al. 2008). All sequences were 100-bp paired-end reads collected on an Illumina HiSeq2000. The combined sequence reads were assembled using the ALLPATHS-LG assembler (Gnerre et al. 2011) (release 44849), followed by local scaffold gap filling with Illumina data (300 bp) (Tsai et al. 2010) using PyGap perl scripts (available upon request) and removal of contaminating contigs. To remove contaminating contigs we aligned them to a custom database (at the McDonnell Genome Institute [MGI]) consisting of microbial sequences, vector sequences, and sequences from organisms sequenced at the MGI to identify project cross-contamination, or human contamination. Additional removal and trimming of sequences was determined by the automated NCBI pipeline. All sequences identified by NCBI were manually removed. All assembled sequences less than 200 bp were removed from the assembly as required by NCBI.
Gene Model Prediction and Annotation
We developed and implemented software methods to incorporate data from expressed sequences and protein orthology to human and fish into evidence-based gene models. These gene reconstruction methods are a hybrid of genome gene prediction (EvidentialGene-G; Gilbert 2012) and mRNA assembly (Evigene-R; Gilbert 2013), which produce gene models from independent lines of evidence. EvidentialGene methods have produced accurate gene sets for a number of animal and plant genome projects, and are publicly available (EvidentialGene 2012). We assessed model quality by scoring all models per locus for gene evidence from all sources, then selecting locus representatives that maximize evidence supporting that locus, weighted by evidence quality (e.g., protein homology and RNA-seq intron recovery scores weight above protein or transcript sizes). This assessment was followed by error analyses using orthology and expression evidence, expert evaluations of genes, refinement of model parameters, and some manual curation, contributing to sequential refinement of the gene set. All gene models were supported by expression and/or homology evidence; ab initio predictions without expression or homology evidence were not included. Detailed methods for gene model prediction and annotation are in the supplementary methods, Supplementary Material online. A table of attributes for the final gene set, with associated evidence scores, is available in the supplementary appendix S1, Supplementary Material online. A GFF file of our gene annotations that is compatible with the NCBI-hosted genome is provided in the supplementary appendix S5, Supplementary Material online.
We also annotated the miRNAs, small (19–25 nt) noncoding RNAs that are involved in posttranscriptional regulation of gene expression that play important roles in physiology and development (Mishima 2012). In this study, miRNA precursor sequences were identified using Basic Local Alignment Search Tool (BLAST) searches of known miRNAs from teleost fish species from miRBase (version 21) (Kozomara and Griffiths-Jones 2014) including Danio rerio (N=349 precursor sequences), Takifugu rubripes (N=131), Tetraodon nigroviridis (N=132), and Oryzias latipes (N=168). Secondary structures of the precursor sequences were checked using MiPred (Jiang et al. 2007). A small-RNA-seq library from developing F. heteroclitus embryos (GEO data set GSE70953) sequenced using methods described in Jenny et al. (2012) also was scanned for the presence of mature miRNA sequences. Clustered miRNAs were determined to be those that were less than 36 kb apart. This is the distance between miR-133 and miR-1: Two miRNAs that bound a cluster that is conserved across deuterostomes (Campo-Paysaa et al. 2011).
Fundulus heteroclitus gene models were linked to UniProt accession numbers (supplementary appendix S1, Supplementary Material online) to provide a handle for gene ontology (GO) enrichment analyses through commonly used tools, such as DAVID Bioinformatics Resources (Huang et al. 2009) and Ingenuity Pathway Analysis (Qiagen). Orthology (from OrthoMCL analysis) to human and zebrafish was used (in that order of priority) as UniProt entries for those species tend to have good assignment of GO terms, UniProt accessions for these species are retrievable through commonly used databases such as DAVID, and Ingenuity Pathway Analysis is based mainly on human annotations.
Repetitive Element Analysis
Repetitive elements in the F. heteroclitus genome were annotated using both a de novo approach to identify F. heteroclitus lineage-specific transposable elements (TEs) and a genome-wide search of known teleost fish TEs. RepeatModeler (Smit and Hubley 2008–2015), which utilizes the programs RECON (Bao and Eddy 2002), RepeatScout (Price et al. 2005), and Tandem Repeat Finder (Benson 1999), was used to conduct the de novo TE search (∼220 Mb of the genome assembly sampled to build de novo TE models). RepeatMasker (Smit et al. 2013–2015) was used to conduct a genome-wide exhaustive search combining the known teleost fish and ancestral TEs from RepBase Update (Jurka et al. 2005) with the F. heteroclitus lineage-specific TEs. The modified version of NCBI BLAST for repetitive elements (RMBlast) was used to conduct the genome-wide search. The F. heteroclitus TE landscape was compared with seven other teleost genomes that include well-annotated TEs (D. rerio, Xiphophorus maculatus, O. latipes, Maylandia zebra, Oreochromis niloticus, Gasterosteus aculeatus, T. nigroviridis) (Jaillon et al. 2004; Kasahara et al. 2007; Jones et al. 2012; Howe et al. 2013; Schartl et al. 2013; Brawand et al. 2014).
Phylogenetic Analysis
To identify signatures of selection in the lineage leading to F. heteroclitus, genome-wide analyses of nonsynonymous/synonymous (dN/dS) substitution ratios were calculated using alignments of orthologous protein-encoding sequences from six fish species: zebrafish (D. rerio), stickleback (G. aculeatus), tilapia (Ore. niloticus), zebra mbuna (M. zebra), platyfish (X. maculatus), and Atlantic killifish (F. heteroclitus). Coding sequences from all taxa were downloaded from Ensembl or NCBI RefSeq browsers and aligned using the program Prank (Loytynoja and Goldman 2005). Poorly aligned sequences were trimmed or removed using the program GBlocks (Castresana 2000) with the minimum length of a block (-b4) set to 50. The final orthology build for all six species included 7,042 genes.
For each gene, tests for positive selection were run with the codeml package of PAML (Yang 2007) using a ratio derived from the number of nonsynonymous/synonymous substitutions (dN/dS). Three lineage-specific branch models (“free-ratio,” “one-ratio,” and “two-ratio”) were used to represent different hypotheses. The free-ratio model assumes an independent dN/dS ratio (ω value) for each branch in the phylogenetic tree. In contrast, the one-ratio model assumes a constant ω value across all branches, and rejection of this model indicates a variable ω value among the branches of the gene trees. The two-ratio model was used to confirm positive selection pressure on different gene tree branches by setting different ω values to different branches of the phylogeny: Branches with an estimated ω lower than 1 and branches with an estimated ω value higher than 1. Tests for significance involved two pairs of comparisons (one-ratio vs. free-ratio and one-ratio vs. two-ratio). We report only those genes that were significant and overlapped for each of the two comparisons.
Next, GO enrichment analysis (Fisher exact test) was performed using DAVID Bioinformatics Resources (Huang et al. 2009), where the query set included the genes showing signatures of selection along the F. heteroclitus lineage and the background set included the 7,042-gene input set. GO enrichment was also examined using GOrilla (Eden et al. 2009). As DAVID and GOrilla results were highly congruous, only results from DAVID analyses are reported here. To further validate genes determined to be under positive selection, amino acid substitutions that were predicted to impact protein function were assessed with PROVEAN (Choi et al. 2012) using default run parameters and a significance threshold score of −1.3. Genes showing signatures of selection were also included in gene interaction network analysis using the Ingenuity Pathways Analysis database of interactions (settings: direct relationships, all data sources, all species, confidence experimentally observed).
Genome-Wide Population Genetic Diversity
The pattern of genomic variation within a species provides a window into its history of natural selection and demography. To assess these factors in F. heteroclitus, we resequenced 48 individuals collected from Great Salt Pond on Block Island, RI (41°10′54.51″N, 71°34′45.50″W). Genomic DNA from individual fish was barcoded, pooled, and sequenced to produce 4.5 billion reads (100-bp paired end) on an Illumina 2500. Reads were mapped to the reference genome using bowtie2 (Langmead and Salzberg 2012). All subsequent analyses were restricted to read pairs that mapped properly, had phred-scaled map qualities >30 and bases with quality >20. Coverage depth per base was assessed across the reference genome using SAMtools (Li et al. 2009), excluding approximately 5 Mb with aberrantly high coverage (>2× the mode). Effective coverage of our assembled genome averaged 5.24× per individual (supplementary table S1, Supplementary Material online). Short variants (single nucleotide polymorphisms and indels) were called using FreeBayes (Garrison and Marth 2012). An allele frequency spectrum was estimated using the 20 largest contigs in the genome (encompassing 50 Mb) using an expectation maximization algorithm implemented in ANGSD (Korneliussen et al. 2014). ANGSD was also used to estimate genetic diversity statistics (π, Watterson’s theta, and Tajima’s D) using an empirical Bayesian approach that accounts for uncertainty in variant calling and genotyping at individual loci (Korneliussen et al. 2013). Individual-level inbreeding coefficients were calculated using ngsF (Vieira et al. 2013). Estimates of genetic diversity were processed over several types of genomic intervals using bedtools (Quinlan and Hall 2010): 1) Sliding windows (50-kb window/10-kb step and 5-kb window/1-kb step), 2) coding sequence by gene region (CDS) with codon positions calculated independently, 3) noncoding sequence by gene region (non-CDS) including introns and untranslated regions (UTRs), 4) proximal promoter regions (defined as 1 kb upstream of the start codon) by gene region (Pro), 5) miRNAs, and 6) intergenic regions. The analysis was restricted to intervals longer than 150 bases. Enrichment of functional classes of genes in the 5% and 95% tails of the distributions of π and Tajima’s D was tested using DAVID (Huang et al. 2009). Historical demographic models were fit to the estimated allele frequency spectrum using ∂a∂i and fastsimcoal2 (Gutenkunst et al. 2009; Excoffier and Foll 2011; Excoffier et al. 2013). Models fit included single-population models with up to four epochs of constant population size, a two-population model with migration and an isolation-with-migration model. The program ms (Hudson 2002) was used to simulate distributions of our diversity statistics in 50-kb windows.
Genome-Wide Population Variation in Copy Number
For each of the 48 Block Island individuals, copy number variants (CNVs) were called based on the combination of signals from a read-pair approach (lumpy), split-read approach (lumpy), and read depth approach (CNVnator) (Abyzov et al. 2011; Layer et al. 2014). Deletions and duplications were defined as the decrease or increase of copy-number relative to the reference genome. Final CNV calls required support from all three approaches and were therefore conservative. Discordant alignments (insert size >5 SD from mean insert size) and split read alignments were extracted with samblaster (Faust and Hall 2014). Regions with very high coverage across all samples could indicate repetitive elements and were excluded from this analysis (see above methods for population genetics analysis) to reduce false positive calls. Deletions and duplications found in all individuals were excluded to reduce the impact of reference genome CNVs. Potential CNVs were identified with lumpy, requiring a minimum of five supporting reads and requiring support from both the read-pair module and split-read module.
Copy number variants identified in multiple individuals were merged using a 50% reciprocal overlap approach as the estimated breakpoints of CNVs can vary between individuals, yielding population CNV regions. Each population CNV region was copy-number genotyped in all individuals using CNVnator’s genotyping module after partitioning read depth bins for each individual using a 100-bp sliding window. The CNVnator genotyping module computes the estimated copy number of the given locus compared with the reference genome, such that each reference locus was considered to be in a diploid state with two single-copy alleles. The estimated copy numbers from CNVnator were rounded to the closest integer as a proxy for copy-number. We retained all putative biallelic CNV loci, and final CNV calls were generated from putative lumpy CNV calls that were also supported by CNVnator read depth genotyping in at least one individual. CNV allele frequencies in the population were determined from the CNVnator copy-number genotyping calls for all 48 individuals. To estimate nucleotide diversity (π) within CNV regions, we computed π in 500-bp windows across the genome using the window-pi function in VCFtools (Danecek et al. 2011). We separated these 500-bp windows into three categories: Those overlapping or contained within deletion regions, those overlapping or contained within duplication regions, or those outside of CNV regions.
Results and Discussion
Genome Sequencing and Assembly
Based on flow cytometry and bulk fluorometric analysis, the estimated F. heteroclitus haploid genome size is between 1.3 and 1.5 Gb (Hinegardner 1968; Dawley 1992; Hardie and Hebert 2004), which is intermediate in size between Japanese medaka and zebrafish (Gregory 2001). Our total sequence coverage was 85× from 300-bp, 3-, 8-, and 40-kb libraries using a genome size estimate of 1.3 Gb. The assembly spans 932 Mb and is made up of 10,180 scaffolds with an N50 contig and scaffold length of 16.7 kb and ∼1.2 Mb, respectively. Contiguity measures of the F. heteroclitus genome are similar to those of other teleost fish genomes that have been assembled using similar strategies (e.g., Illumina sequence only and using the same assembly algorithm; supplementary table S2, Supplementary Material online). The Fundulus_heteroclitus-3.0.2 assembly is available under GenBank accession number JXMV00000000.1. Extensive assembly statistics are available at http://www.ncbi.nlm.nih.gov/assembly/GCF_000826765.1 (last accessed 14 February 2017). Assembled gene representation as measured by CEGMA (Parra et al. 2007) showed that 235 of 248 (95%) ultraconserved eukaryotic genes are present in the genome as complete sequences, where the remaining 13 are present as partial sequences (supplementary table S3, Supplementary Material online), demonstrating sufficient genic coverage for the studies described herein.
Gene Model Prediction and Annotation
The F. heteroclitus genome has data supporting 34,924 gene loci: 27,512 (79%) from mRNA assembly, 7,407 (21%) from genome gene prediction (table 1; supplementary appendix S1, Supplementary Material online), and 5 are curated models of orthologs. For these gene loci, mRNA sequences provide the most convincing evidence. For the 27,512 genes with strong mRNA evidence, 73% (20,067) are complete proteins and 76% are orthologs or paralogs (table 1). For the 7,407 gene models that do not have corresponding complete transcript assemblies, 96% have measurable expression. Also 4,097 (55%) of these have orthologs or paralogs in other species (3,054 are orthologs, and 1,043 are paralogs). Five genes were manually curated from ortholog proteins mapping to this genome that lacked corresponding gene models or full transcripts (four are odorant receptor genes common to fish and human). Thus, 31,614 (91%) genes have mRNA sequences, or are orthologs or paralogs. This leaves 3,310 genes with less evidence; yet nearly all of these gene models (94%) are complete proteins and have low counts of RNA-seq reads that map to the gene model from RNA-seq studies.
Table 1.
Gene Set Numbers (version kfish2rae5g, Dec 2013)
| 34,924 Genes | Total | Orthology |
Mapping |
Proteins |
|||||
|---|---|---|---|---|---|---|---|---|---|
| Orthologs to Other Species | Inparalogs of Orthologs | Weak Homology or Are Species- Unique (unclassified) | Properly Mapped to Genome (≥80% coverage) | Partial-Mapped <80% Coverage | Unmapped Genes | Complete Proteins | Partial Proteins | ||
| Total | 34,924 | 21,122 | 3,679 | 10,123 | 27,521 | 5,122 | 2,281 | 27,044 | 7,880 |
| 100% | 60% | 11% | 29% | 79% | 15% | 6% | 77% | 23% | |
| Evidence from mRNA assemblies | 27,512 | 18,066 | 2,636 | 6,810 | 20,182 | 5,050 | 2,280 | 20,067 | 7,445 |
| 79% | 66% | 10% | 25% | 73% | 18% | 8% | 73% | 27% | |
| Evidence: are genome-modeled | 7,407 | 3,054 | 1,043 | 3,310 | 7,334 | 72 | 1 | 6,972 | 435 |
| 21% | 41% | 14% | 45% | 99% | 1% | 0% | 94% | 6% | |
| Expert added | 5 | 2 | 0 | 3 | 5 | 0 | 0 | 5 | 0 |
| 0% | 40% | 0% | 60% | 100% | 0% | 0% | 100% | 0% | |
In comparison to humans (fig. 1), F. heteroclitus has 17,072 orthologs, on average 1,899 (range 201–3,991) more than the other nine fish species that we used for comparison. In comparison to other fish and humans, F. heteroclitus has 24,801 homologs (21,122 orthologs plus 3,679 paralogs) (table 1). Of the 24,801 genes supported by homology evidence, 85% (20,702) are also supported by mRNA sequence assemblies. Fundulus heteroclitus also has 10,123 genes with weak evidence for orthology with other species (specified in the supplementary appendix S1, Supplementary Material online, as “noor” or “udup,” and as “unclassified” in the supplementary table S4, Supplementary Material online), but 6,810 (67%) of these are supported by evidence from mRNA assemblies. The remaining 3,313 of genes with weak orthology are supported by evidence from gene models or expert annotation.
Fig. 1.—

Fish phylogeny indicating number of shared human orthologs and genome assembly size and repeat content. % Identity is the average percent identity for the shared orthologs. % Align is the average percent of total length of a gene model that aligns to its human ortholog. Among fish relative to the human genome, the F. heteroclitus genome harbors the most human orthologs and genes with the greatest percent alignment. Assembled genome size and repeat content are reported for select fish genomes. Phylogeny and divergence times are based on Betancur et al. (2013).
The quality of the F. heteroclitus genome annotation can be assessed by determining the number of orthologous genes (Waterhouse et al. 2013) it contains and how many are missing. The F. heteroclitus genome has the most orthologous genes (21,122) when compared among the other fish and human genomes (supplementary table S4, Supplementary Material online). Fundulus heteroclitus is only missing ten of the orthologous genes found in all other fish species (supplementary table S4, Supplementary Material online: Missing Orthologs) whereas other species are missing from 54 to 1,514. These data suggest that the annotated genes in other fish species are most often also annotated in F. heteroclitus.
We compared the frequencies of shared genes among species (supplementary table S5, Supplementary Material online) by first calculating the maximum number of genes shared between each species and two other species (see first data column [Max Shared with 2 Spp orthologs] in the supplementary table S5, Supplementary Material online). We find that the F. heteroclitus genome has 15,415 genes that have orthologs in at least two other species, which is the most genes for all comparisons. For each species, we then calculated the proportion of two-species orthologs that are present between all species pairs. This comparison creates an asymmetric matrix where comparisons are across rows. Thus F. heteroclitus has 100% of platyfish and medaka orthologs (supplementary table S5, Supplementary Material online). That is, all of platyfish and medaka genes are found in F. heteroclitus. Yet, platyfish (X. maculatus) has only 94% of F. heteroclitus orthologs and medaka (O. latipes) has 82% of F. heteroclitus orthologs. Supplementary table S5, Supplementary Material online, demonstrates that among genes shared by two species, F. heteroclitus has all of these. A number of notable human genes that are conspicuously missing in the zebrafish genome (Howe et al. 2013) are present in the killifish genome, including BRCA1 and interleukin-6 (IL6). The orthoDB database (Waterhouse et al. 2013) has been updated to include F. heteroclitus genes (genes draft version 1, at http://cegg.unige.ch/orthodb7, last accessed 14 February 2017).
To summarize, F. heteroclitus has approximately 35K gene loci, and 90% have mRNAs or homologs in other species. Importantly, we have identified gene models for 100% of the genes found in seven of nine other species and for 98% in the other two species. Thus, the F. heteroclitus genome is well annotated; it includes a more complete gene set than for other currently available fish genomes.
High Repetitive Element Content
The F. heteroclitus genome assembly harbors an overall repeat content of 33%, which is among the largest for known teleost fish genomes and second only to D. rerio (fig. 1). Teleost genomes show wide variation in genome size and repeat content, where genome sizes range 4-fold from 310 Mb (T. nigroviridis) to 1.4 Gb (D. rerio), with genome repeat content varying from <1% (T. nigroviridis) to 55.2% (D. rerio) (fig. 1). Using seven published teleost genomes, we found a significant positive correlation between teleost genome assembly size and repeat content (Pearson’s correlation, r = 0.955, n=8, P < 0.001; supplementary fig. S1, Supplementary Material online), consistent with expansion and contraction of TEs contributing to expansion and contraction of genome sizes within fish. All genome assemblies are currently incomplete partly because repeat elements complicate assembly, such that current highly fragmented genome assemblies probably underestimate the total repeat content.
As in other teleosts, TEs in F. heteroclitus were highly diverse, including many families present in fish but absent in mammals (Volff et al. 2003). The F. heteroclitus TE landscape includes at least 22 DNA transposon families, 13 long interspersed nuclear element (LINE) families, and 7 long terminal repeat element families. In total, 1.46 million TEs were identified in the F. heteroclitus genome (supplementary table S6, Supplementary Material online). In contrast to mammalian genomes where LINE retrotransposons are the most abundant (Han and Boeke 2005; Wicker et al. 2007), DNA transposons were the most abundant type of TE in the F. heteroclitus genome, with >587,000 copies representing 12.7% of the genome (130 Mb). The most abundant families of DNA transposons included the Tc1–Mariner superfamily (>387,000 copies, 8.24% of genome) and the hAT superfamily (>135,000 copies, 2.84% of genome). Retrotransposons represent 9.1% of the F. heteroclitus genome (93.5 Mb), with the most abundant families consisting of the LINE L2 element (>127,000 copies, 3.25% of genome) and the LINE Rex-Babar element (>62,000 copies, 1.65% of genome). We found that 2.2% of the F. heteroclitus transcriptome was derived from TE sequences, indicating that some F. heteroclitus TEs are likely still active.
Over 500,000 novel F. heteroclitus lineage-specific TEs, which are diverged from currently known TEs, were identified in the F. heteroclitus genome, representing 11.1% of the genome (113.5 Mb). These we refer to as novel because they could not be automatically placed into a known annotated TE family. The O. latipes genome also contained a similar percentage of novel repeats (Kasahara et al. 2007), suggesting that several uncharacterized TE families are present in teleost fish genomes. With the large amount of DNA transposons relative to mammals and many novel repeat element families, teleost genomes provide a new opportunity for the comparative study of repetitive element evolution and diversification.
Positive Selection with Cell Cycle Gene Enrichment
Orthology across six fish species produced 7,042 genes that were used for phylogenetic tests for positive selection. PAML analysis (codeml package) revealed 649 of 7,042 genes (9%) showing signatures of positive selection along the lineage leading to F. heteroclitus (supplementary table S7, Supplementary Material online). This gene set is significantly enriched for genes associated with “cell cycle regulation” (N = 46, P < 0.0001) (particularly “M-phase of mitotic cell cycle”: N = 24, P < 0.001) and “regulation of cell death” (apoptosis; N = 50, P < 0.001) functions (supplementary table S8, Supplementary Material online). A subset of these genes has amino acid substitutions that are predicted to impact protein function (PROVEAN analysis), and these are also enriched for the same functions. These genes form a highly connected interaction network (supplementary fig. S2, Supplementary Material online) implying parallel evolution of a functional module of genes. This network retains significant enrichment for “cell cycle” and “cell death and survival” functions, in particular for apoptosis of epithelial cells (P < 0.001).
Fundulus heteroclitus are euryhaline and can quickly remodel the physiology and morphology of their gill epithelium to maintain osmotic homeostasis in the face of very broad changes in environmental salinity (Wood and Marshall 1994). This ability enables a level of extreme physiological plasticity that is rare among fishes (Schultz and McCormick 2013). Cell cycle arrest at the G2/M-phase of mitosis is activated during osmotic challenge in diverse species, as is apoptosis during gill epithelial remodeling in euryhaline fish (Kammerer and Kultz 2009). Genes and gene networks associated with cell cycle regulation and apoptosis are transcriptionally regulated during acclimation to osmotic challenge in F. heteroclitus (Whitehead et al. 2012, 2013). These observations are consistent with the hypothesis that the evolved network of genes that we report here contributes to the exceptional ability of killifish to remodel gill epithelia in response to variable salinity, and thereby supports their persistence and dominance in osmotically dynamic environments as well as across the continuum of osmotic niches within coastal ecosystems. These data set the stage for network-based analyses to characterize and explore the genomic infrastructure that supports the extraordinary physiological plasticity of F. heteroclitus.
High Genome-Wide Population Genetic Diversity
Among 48 fish within a single population, the genome-wide average nucleotide diversity (π) is 0.0119, whereas genome-wide Tajima’s D is −0.1130 (bootstrapped 95% confidence interval: −0.1185, −0.1078). The allele frequency spectrum is not consistent with a population in equilibrium, reflected by the negative Tajima’s D. To test some possible causes of this pattern, we conducted several analyses. A small number of newly immigrated individuals from a differentiated population could skew the allele frequency spectrum in this way, a pattern that might manifest as excess homozygosity within individuals. We first estimated individual-level inbreeding coefficients, which ranged from 0 to 0.13, with an average of 0.03. We interpret this as evidence that we have not sampled any recent migrants, or across any substantial population breaks. Additionally, a plot of genetic distances between individuals suggests no outliers. Demographic history may also impact this pattern, so we tested demographic models to explain this shift in the site frequency spectrum, including competing models that differed in the number of discrete historical epochs and that exchanged migrants with an unsampled population. Each epoch could model stable population size, exponential expansion or contraction, or migration with an unsampled population. Models were compared by fit to the data, as well as by stability and plausibility of parameter estimates. The best model was composed of three epochs showing historical population growth from the ancestral population through the first two epochs (accounting for negative Tajima’s D), followed by a substantial reduction in the most recent epoch. If we assume a per base mutation rate on the order of 10−8 per generation (Burridge et al. 2008), our model suggests a reduction of 50–80% in effective population size since the last glacial maximum (LGM). This model implies a reduction of genetic diversity following the LGM, which is consistent with a northern refugium or a founder effect from northward expansion following the LGM (Duvernell et al. 2008). Though this model provided a good fit to the allele frequency spectrum, it poorly reproduced the distribution of summary statistics across 50-kb windows (supplementary fig. S3, Supplementary Material online), particularly the long negative tail of Tajima’s D and low π. This implies either a highly complicated demographic history, or that nonneutral processes, such as background selection and selective sweeps, have impacted a large fraction of genetic variation and this signature is superimposed upon a signal of demographic history.
Genome-wide nucleotide diversity measures are higher for F. heteroclitus (π=0.0119) than for other species for which comparable whole-genome data are available. For example, genome-wide average π in F. heteroclitus is 4.8-fold higher than that among six marine stickleback fishes (π=0.0025) (Feulner et al. 2013). Similarly, variation in F. heteroclitus is higher than variation among black cottonwood trees, rice, wild and cultivated maize, Drosophila melanogaster, baker’s yeast isolates, crows, and Darwin’s finches (Liti et al. 2009; Sackton et al. 2009; Kolaczkowski et al. 2011; Huang et al. 2012; Hufford et al. 2012; Pool et al. 2012; Evans et al. 2014; Poelstra et al. 2014; Lamichhaney et al. 2015). Placed within the context of a recent broad comparison of genetic diversity across the tree of life, where estimates of π were calculated from a few loci to genome-wide depending on the species, F. heteroclitus ranks as the most genetically diverse among fishes, and ranks in the 98th percentile among vertebrates (Leffler et al. 2012); F. heteroclitus diversity falls firmly within the range of arthropods and at the extreme upper end of the diversity range of vertebrates (median π for arthropod and chordate species was 0.0125 and 0.0026, respectively) (Leffler et al. 2012). Furthermore, the Block Island (RI) population we assess here is from the northern end of the species range, where genetic diversity is lower than in the south (Duvernell et al. 2008). Indeed, nucleotide diversity in coastal Virginia populations of F. heteroclitus is higher (π=0.016) (Reid et al. 2016).
High nucleotide diversity within a F. heteroclitus population is consistent with the pattern of positive correlation between population census size and genetic diversity (Leffler et al. 2012). Within their coastal marsh habitats F. heteroclitus are the numerically dominant fish (Yozzo and Smith 1998) where densities are typically ∼14 fish per square meter (Sweeney et al. 1998) and neighborhood sizes can range into the many tens of thousands (Meredith and Lotrich 1979; Teo and Able 2003). Very large populations can harbor much standing genetic variation that is a crucial substrate for adaptation to novel environments, thereby relaxing reliance on new mutations and alleviating the variation-reducing influence of selection on new mutations (Hermisson and Pennings 2005). Indeed, F. heteroclitus populations have recently and quickly evolved extreme tolerance to the normally lethal effects of highly polluted environments (Nacci et al. 2010), suggesting the adaptive importance of standing genetic variation within this species (Reid et al. 2016). However, repeated selection may reduce variation at linked sites through genetic hitchhiking (Maynard Smith and Haigh 1974) or background selection (Charlesworth et al. 1993) and may thereby reduce neutral diversity to levels lower than one might expect based on population size. For both genetic hitchhiking and background selection, recombination is important for determining the size of the footprint of reduced genetic variation. Genetic hitchhiking and background selection may be weak within F. heteroclitus, leading to higher genetic variation, because recombination rates are relatively high. This has yet to be tested in a robust comparative framework (Romiguier et al. 2014).
Across the genome, coding regions have less nucleotide diversity compared with all classes of noncoding regions (mean coding π=0.0060, mean noncoding π=0.0122, Mann–Whitney U test P < 2.2 × 10⁻¹⁶) consistent with coding regions being subject to greater selective constraint than noncoding regions (fig. 2, table 2). In contrast, among classes of noncoding DNA (introns and UTRs within gene models, proximal promoter, intergenic) distributions of nucleotide diversity vary by only ∼1%. Similarly, Tajima’s D is substantially more negative for coding regions (D=−0.5937) than for all classes of noncoding sequence (mean D=−0.1235, Mann–Whitney U test P < 2.2 × 10⁻¹⁶). This indicates that coding regions have more rare variation than noncoding regions. We interpret this discrepancy to be a result of weak purifying selection failing to efficiently purge rare weakly deleterious alleles (Fay et al. 2001).
Fig. 2.—

Distributions of genome-wide genetic variation among 48 individuals within a population for different regions of the genome, including for coding sequence (black line), genic noncoding sequence (e.g., UTRs and introns, navy blue line), proximal promoter (e.g., 1,000 bases upstream of the transcription start site, aqua blue line), and noncoding intergenic DNA outside of gene models and promoters (green line). Genetic diversity is summarized as π (top panel) and Tajima’s D (bottom panel). Coding sequence has lower within-population genetic variation compared with sequence found in genic noncoding, promoter, and intergenic regions. Low- and high-diversity genes are those that occupy the 5th and 95th percentiles of the coding sequence π distribution, respectively, and these genes are significantly enriched for the biological functions listed.
Table 2.
Genetic Diversity among 48 Individuals within a Population
| Nucleotide Diversity (π) per Site | Waterson’s Theta per Site | Tajima’s D | |
|---|---|---|---|
| Genome-wide | 0.0119 | 0.0124 | −0.1130 |
| Genic—coding | 0.0060 | 0.0072 | −0.5937 |
| Genic—noncoding | 0.0122 | 0.0126 | −0.1170 |
| Intergenic | 0.0122 | 0.0125 | −0.0948 |
| Proximal promotera | 0.0123 | 0.0129 | −0.1585 |
| Codon position 1 | 0.0040 | 0.0056 | −0.9320 |
| Codon position 2 | 0.0034 | 0.0049 | −1.0479 |
| Codon position 3 | 0.0101 | 0.0109 | −0.2536 |
| 5′-UTR | 0.0083 | 0.0095 | −0.4167 |
| 3′-UTR | 0.0096 | 0.0105 | −0.2850 |
| miRNAs | 0.0012 | 0.0028 | −1.9877 |
Proximal promoter is a subset of intergenic.
Though the pervasive reduction in Tajima’s D in coding sequence compared with noncoding sequence is best explained by the action of purifying selection on weakly deleterious mutations, we also find that genetic variation within coding sequence is correlated with both variation in linked genic noncoding sequences (R2 = 0.43) and variation in linked promoter sequences (R2 = 0.29) (fig. 3A and B). This correlation is consistent with the expectation that the evolutionary fates of DNA sequence variation in physically linked regions of the genome are coupled and suggestive of a role for linked selection in shaping patterns of genetic variation in this population (Maynard Smith and Haigh 1974; Begun and Aquadro 1992). Indeed, we find evidence for linked selection in F. heteroclitus, insofar as Tajima’s D negatively correlates with gene density (supplementary fig. S4, Supplementary Material online). In examining the pattern of correlation in Tajima’s D, the overall mass of Tajima’s D is above the 1:1 line for coding versus noncoding sequence (fig. 3D and E), which is consistent with weak purifying selection of greater influence in coding versus noncoding DNA. However genes within the lower left quadrant of the plots (fig. 3D and E) tend to converge on a 1:1 correlation, where Tajima’s D is very low for both coding and linked noncoding sequences, which is consistent with a single dominant process (such as selective sweeps) influencing variation in regions of the genome that are linked with coding sequence. We infer pervasive roles for both weak purifying selection and adaptive selective sweeps for shaping coding sequence variation within this population, and that these processes likely account for variation that is not efficiently explained by a purely demographic model (supplementary fig. S3, Supplementary Material online).
Fig. 3.—

Correlations between genetic variation (log per-base π) between coding sequence (CDS) and genic noncoding sequence (noncoding) (A), between promoter sequence and CDS (B), and between promoter sequence and genic noncoding sequence (C), for each gene model. The same contrasts are repeated for Tajima’s D (D–F). Correlations between π and Tajima’s D are represented for coding sequence (G), genic noncoding sequence (H), and promoter sequence (I) for each gene model. The solid gray line indicates the 1:1 relationship, whereas the dotted red line indicates the slope of the correlation.
Low-Diversity Genes Are Associated with Neurological, Developmental, and Cytoskeletal Functions, and Tight Junctions
We tested whether genes with shared functional attributes clustered within the tails of the diversity distributions. Genes (coding sequence) with the lowest diversity among individuals (those genes that occupy the 5th percentile π measurements) tend to be associated with biological processes that include neurological systems and development (fig. 2). Within the context of neurological systems, this gene set was significantly enriched for GO terms including “neurological system process” (N=81, P < 0.0001), “neuron differentiation” (N=46, P=0.002), “synapse” (N=39, P=0.001) including cholinergic receptor, GABA receptor, glutamate receptor, and insulin receptor genes, “sensory organ development” (N=31, P < 0.001), and “ion transport” (N=63, P=0.003) including sodium, chloride, calcium, and potassium channel genes—both voltage and ligand gated—and solute carrier genes. Within the context of developmental processes, this gene set was significantly enriched for GO terms including “HOX” genes (N=29, P < 0.001), “fore-brain development” (N=20, P=0.013), and “embryonic morphogenesis” (N=39, P≤0.001). Other significantly enriched GO terms included “actin cytoskeleton” (N=34, P < 0.0001) including actin, actinin, myosin, tropomyosin, and troponin subunits, “protein transport” (N=72, P=0.002), and “protein kinase activity” (N=52, P=0.048). Since π and Tajima’s D are correlated, and π of coding sequences is correlated with π of linked noncoding genic and promoter sequences (fig. 3), we find that GO terms enriched in the tails of each of these distributions are highly overlapping, so we report here only data from the tails of the coding sequence distributions. We also compared nucleotide diversity between genes that were expressed only in adult gill tissues versus those expressed only in embryos (Illumina RNA-seq data, threshold for detection of expression=10 reads per kilobase per million; supplementary appendix S1, Supplementary Material online) and found that diversity was lower for genes with embryo-specific expression (supplementary fig. S5, Supplementary Material online). This indicates that genes expressed specifically during early developmental stages are more likely to be involved in conserved biological processes compared with those expressed in specialized adult tissues.
Low-diversity genes within this F. heteroclitus population tend to be associated with neurological, developmental, and cytoskeletal functions, which is consistent with findings in other species. For example, in the Drosophila melanogaster genetic reference panel, those GO terms that were enriched among the lowest diversity genes included “synapse, ion transport, appendage development”, and “actin cytoskeleton” (Mackay et al. 2012). Similarly, among primates, the most slowly evolving genes include those preferentially expressed in the brain, and those enriched for functions including neurogenesis, synaptic transmission, and intracellular signaling (Mikkelsen et al. 2005). This suggests that these processes, and the genes that govern them, are subject to shared selective constraint in diverse taxa. Surprisingly, neurological system genes are not among the most slowly evolving genes in Japanese medaka (Kasahara et al. 2007), which are closely related to F. heteroclitus.
Although π and Tajima’s D are often correlated, one notable exception is “tight junction” proteins, which are not enriched in the π distribution but are enriched (N=13, P=0.008) in the 5th percentile of the Tajima’s D distribution for coding sequences. This enrichment is consistent with selective constraint on regulation of paracellular permeability in this euryhaline estuarine specialist. Atlantic killifish are unusual among fish insofar as they appear to lack the mechanisms that would enable active chloride uptake to maintain osmotic homeostasis in low-salinity environments; instead, they adjust paracellular permeability of gill epithelia to limit ion loss in low-salinity conditions (Patrick et al. 1997; Patrick and Wood 1999; Scott et al. 2004). Claudin proteins are localized to gill epithelial tight junctions and regulate paracellular permeability and ion selectivity (Van Itallie and Anderson 2006). Transcripts of tight junction proteins including claudins are consistently differentially regulated during both hypo- and hyperosmotic acclimation in killifish (Whitehead, Galvez, et al. 2011; Whitehead, Roach, et al. 2011; Whitehead et al. 2012, 2013; Brennan et al. 2015) and show signatures of diversifying selection between populations native to different osmotic environments (Kozak et al. 2014). Claudins, and other tight junction components, are likely important proteins that contribute to the extreme physiological plasticity and estuarine success that distinguishes Fundulus species.
miRNAs Are among the Least Variable of Genomic Elements
We identified 197 precursor miRNA sequences in the F. heteroclitus genome (supplementary appendices S2 and S3, Supplementary Material online), 126 of which were detected as mature miRNAs expressed in developing embryos. Average nucleotide diversity of the 197 miRNA loci is the lowest among genomic regions compared (table 2): average π=0.0012 is approximately 3-fold less than at first and second codon positions and nearly 10-fold less than at third codon positions. Similarly, average Tajima’s D for miRNAs was very low (−1.99), at the extreme negative end of the genome-wide distribution (supplementary fig. S6, Supplementary Material online). To test whether discovery bias might have skewed these results, we compared the distribution of diversity statistics for miRNA in humans (Quach et al. 2009) to the human miRNA subset that is homologous to F. heteroclitus miRNAs. We find that within humans, the genetic diversity of F. heteroclitus miRNA orthologs is representative of the genetic diversity of all miRNAs in humans. Thus, we predict that the diversity of the 197 F. heteroclitus miRNAs that we initially discovered is representative of F. heteroclitus miRNA diversity. We found that 48.7% (96 of 197) of miRNAs appear in 39 clusters (supplementary appendix S4, Supplementary Material online). This is similar to what is observed in zebrafish (Chen et al. 2005); indeed, many of these clusters are conserved among vertebrates and, in some cases, across bilateria (Campo-Paysaa et al. 2011). These patterns of variation are consistent with the influence of strong purifying selection of mostly deleterious mutations resulting in a skewed distribution of segregating variation that is mostly very rare. In humans, miRNA nucleotide diversity is similar to that of coding sequence (Rawlings-Goss et al. 2014), whereas average Tajima’s D is close to zero for European and East Asian populations but shifted negative in African populations. A similar pattern is reported for nematodes, where nucleotide diversity tends to be low for miRNAs, but Tajima’s D centers on zero (Jovelin and Cutter 2014). These important regulatory elements appear to be under similar selective constraint in F. heteroclitus compared with other species, but the marked skew toward excess rare variation may be unusual compared with other species. As single miRNAs can have hundreds of binding partners (Selbach et al. 2008), their low nucleotide diversity is consistent with pleiotropy constraining their evolution.
Balancing Selection Governs Variation in Immune System and Olfaction Genes
At the opposite end of the among-individual diversity distribution, we find that the highest diversity genes (coding sequence in genes that occupy the 95th percentile π measurements) tend to be associated with immune system processes (fig. 2). This gene set was significantly enriched for GO or INTERPRO terms including “immunoglobulin and immunoglobulin-like” (N=32, P < 0.0001, and N=93, P < 0.0001, respectively), “C-type lectin” (N=22, P < 0.0001), “MHC protein complex” (N=10, P < 0.0001), “cell adhesion” (N=46, P < 0.0001), and “positive regulation of immune system process” (N=16, P < 0.0001). Again, as coding sequence variation correlates with promoter sequence variation (fig. 3), these immune system genes are also among the most variable of genes in their promoter sequence. Consistent with this, we find that the gene set with the highest variation in gene expression levels among individuals within populations (measured as coefficient of variation from microarray experiments in F. heteroclitus; (Whitehead et al. 2012) is significantly enriched for immune system genes (CV 95th percentile, significant GO enrichment). Another enriched GO term within this set included “olfactory receptor” (N=5, P=0.007).
The high-diversity genes with both high π and positive Tajima’s D suggest the influence of balancing selection. This is consistent with classic studies in mammals that reveal the influence of diversity-enhancing selection in immunoglobulin genes (Tanaka and Nei 1989) and major histocompatibility complex genes (Hughes and Nei 1988, 1989). Similarly, comparative genomics reveals immune system genes and olfaction genes to be among the fastest evolving between chimpanzees and humans (Mikkelsen et al. 2005). In fish, within-species variation in immunoglobulin genes is particularly high compared with other vertebrates (Das et al. 2008), and the genes with highest sequence diversity among six stickleback fish included immune response genes (Feulner et al. 2013).
Low- and High-Diversity Genes Occupy Different Regions within Interaction Networks
As purifying selection contributes to the fate of “low-diversity” genes and as genes that are positioned at hubs within interaction networks tend to be subject to selective constraint (Fraser et al. 2002), we predicted that the low-diversity genes would more likely be “hub” genes and the high-diversity genes would more likely be connected toward the periphery (tips) of interaction networks. We selected 1,000 UniProt annotated genes with the highest nucleotide diversity (median π=1.29e-2) and compared them with 1,000 UniProt annotated genes with the lowest nucleotide diversity (median π=7.23e-4). Cellular location and biological function annotations for the two sets showed substantial systematic differences. Genes with the lowest nucleotide diversity were significantly more likely to be located in the cytoplasm or nucleus (Benjamini Hochberg adjusted P value < 0.01, odds ratio > 1.5), whereas high-diversity genes were more likely to be found at the plasma membrane or in the extracellular space (Benjamini Hochberg adjusted P value < 0.001, odds ratio < 0.6) (supplementary fig. S7, Supplementary Material online). Furthermore, low-diversity genes were more likely to be transcription regulators, transporters or kinases (Benjamini Hochberg adjusted P value < 0.02, odds ratio > 1.8), whereas high-diversity genes were more likely to be transmembrane receptors or G-protein coupled receptors (Benjamini Hochberg adjusted P value < 1.0e-5, odds ratio < 0.14) (supplementary fig. S7, Supplementary Material online).
To further test our hypotheses about “connectivity” differences between low- and high-diversity genes (not including miRNAs), we used Ingenuity’s (Qiagen) knowledge base to identify downstream targets of each set. As biological networks are scale free, one can summarize their general degree of connectedness as the regression line slope fitted to the log frequency of observing a particular node degree and the log of the node degree observed; that is, scale free networks can be described by a power law (Wagner 2001). We tested for significant differences between the power laws of high- and low-diversity genes using an analysis of covariance of the log node frequency as a function of log node degree (as in Shaw et al. [2014]). The regression was performed in R as an analysis of covariance of log-transformed node degree as a function of log-transformed node frequency to test the null hypothesis that both high- and low-diversity genes do not significantly differ in the power law that governs this relationship. Low-diversity gene sets were significantly more connected than high-diversity gene sets (P=0.008, analysis of covariance of their respective power law slopes) (fig. 4). These results are consistent with the proposal that pleiotropy constrains evolution (Fisher 1930), and consistent with a negative relationship between connectivity and evolutionary rate (Fraser et al. 2002).
Fig. 4.—
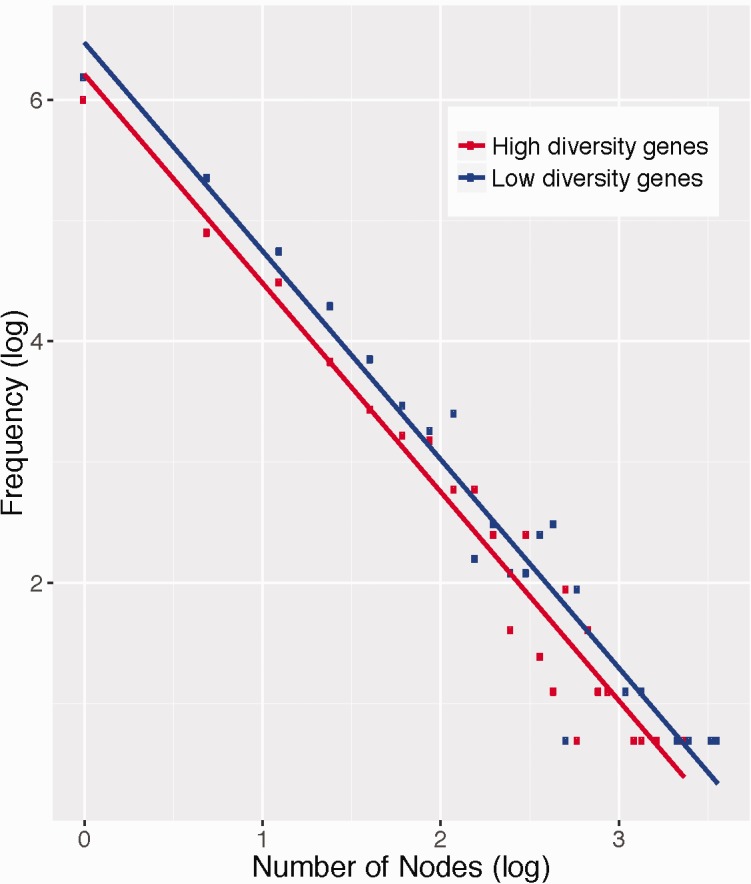
Scatterplots of the natural log of node frequency as a function of natural log of node degree for genes with highest (red line) and lowest (blue line) within-population genetic diversity (coding sequence π), and their respective linear regression lines. Genes with the lowest diversity have a significantly right-shifted distribution compared with genes with the highest genetic diversity (P = 0.008, analysis of covariance), showing that low-diversity genes tend to have higher gene network connectivity than high-diversity genes.
Much Genome-Wide Copy Number Variation Is Segregating among Individuals
Across all 48 F. heteroclitus genomes within the Block Island population we detected 24,764 deletions (median length of 656 bp) and 4,069 duplications (median length of 3,576 bp) (table 3). CNV calling methods are sensitive to deletions and simple tandem duplications but have limited ability to detect more complex duplications, which may explain some of the skew in the number of deletions and duplications identified. These copy number variable regions affect 57.3 Mb of the F. heteroclitus genome, representing 6.37% of the genome assembly (excluding gaps), which is comparable to the CNV density within three-spined sticklebacks (Chain et al. 2014).
Table 3.
Copy Number Variation across 48 Individuals within a Population
| Total Events | Median Length (bp) | Total Bases Affected (Mb) | Percent Genome Affected | |
|---|---|---|---|---|
| Deletions | 24,764 | 656 | 27.7 | 3.08 |
| Duplications | 4,069 | 3,576 | 31.8 | 3.61 |
| All CNV | 28,833 | 716 | 57.3 | 6.37 |
We examined the distribution of CNV lengths in the population and found differing distributions between deletions and duplications (fig. 5A). Deletion events follow a negative exponential distribution, which is similar to the CNV length distribution found in the human genome (Chaisson et al. 2015) where the majority of human CNV events are <1,000 bp in length. These are often difficult to call using Illumina-generated sequence. Due to the insert size used for our Illumina sequencing libraries and our CNV calling methods, our ability to detect CNVs <500 bp was limited. Even with this limitation, 70.8% of F. heteroclitus deletion events were <1,000 bp in length. Among humans, 85% of CNVs called with single molecule sequencing were unable to be detected using Illumina sequencing, with most of these undetected CNVs being short length (<1,000 bp) (Chaisson et al. 2015). Therefore, there is most likely an excess of short CNVs in this killifish population that we were unable to detect using Illumina sequencing, in addition to the CNVs reported here. Duplication lengths followed a bimodal distribution, with a peak at <1,000 bp and another peak at ∼4,000 bp (fig. 5B). To assess whether TEs played a role in these duplication events, we scanned duplications with lengths 2.5–5 kb for repeat element sequences. The duplication sequences showed no significant enrichment of repeat elements compared with random sampling from the genome.
Fig. 5.—

Distribution of the lengths of deletions (white) and duplications (black) within the Block Island population, binned into 2.5-kb bins with the last bin containing all CNVs greater than 20 kb in length (A). Distribution of the lengths of duplications less than 10 kb in length, showing the abundance of duplications with length of ∼4 kb (B).
We explored the distribution of CNVs among individuals using both the allele frequency spectrum and CNV presence/absence per individual. CNV allelic frequencies were analyzed using depth of coverage in each individual at biallelic sites. CNVs generally occur at low frequency in the population; 52.5% of CNVs have allele frequencies <0.125 (<12/96 alleles) and 45.8% of CNVs are present in <10 individuals (supplementary fig. S8, Supplementary Material online). CNVs occurring in only one individual account for 7% of all CNVs. Though the majority of CNVs occur at low frequency, this F. heteroclitus population harbors higher CNV levels compared with sticklebacks; for sticklebacks about half of all CNVs are found in a single individual among 66 individuals sampled from across 11 populations (Chain et al. 2014).
To assess the impact of CNVs on nucleotide diversity within the population, we compared the distribution of nucleotide diversity within regions that harbor deletions, within duplicated regions, and within non-CNV regions in the genome (supplementary fig. S9, Supplementary Material online). We found lower nucleotide diversity within regions that harbor deletions compared with non-CNV regions, due to the loss of heterozygosity caused by deletion events. We found no difference in the distribution of nucleotide diversity between duplicated regions and non-CNV regions.
To evaluate the potential functional impacts of CNVs, we calculated the proportion of deletions and duplications that are completely intergenic or intronic, that overlap an exon (but not an entire gene), or that completely encompass a gene (fig. 6). We found that 94% of deletions are located completely within intergenic or intronic sequence whereas only 66% of duplications are completely intergenic or intronic; 28% of duplications overlap an exon and 6% of duplications completely encompass a gene. Genes affected by the deletion or duplication of exonic sequence (but not the entire gene) make up 9.1% of all genes (2,414 genes). In total, 820 complete genes are copy number variable (3.1% of all genes) in the population; only 15% (126) of those genes have deletions only, whereas 82% (673) have duplications only, and 2.56% (21) have both deletions and duplications in the population. This asymmetry between deleted and duplicated genes likely reflects relaxation of selective constraint on duplications relative to deletions for functional parts of the genome. Homozygous complete-gene deletions were rare; 7% of them were found in homozygote form, and of those, on average 3 of 48 individuals were homozygous. No gene functional categories were enriched among the genes that have duplication variation, whereas genes associated with immune response were enriched within the genes that are variably deleted (N=11, P < 0.001). Considering that immune system genes are among those with highest nucleotide diversity, these data are consistent with a relative lack of selective constraint for some genes involved in regulation of immune responses, and with high birth and death rates for immune genes (Nei et al. 1997).
Fig. 6.—

Proportion of deletions (white) and duplications (black) overlapping four mutually exclusive genomic categories (from left to right): entirely within intergenic regions, entirely within intronic regions, partially overlapping a gene including an exonic region, or completely overlapping at least one gene.
Conclusions
The evidence-based approach used to identify F. heteroclitus gene models, with all loci supported by expression and/or homology (usually both), produced a robust and thorough final gene set. To enable gene function analyses, gene models were linked to human and zebrafish UniProt accessions based on orthology. Genome-wide variation among 48 individuals within a northern F. heteroclitus population (which has less variation than southern populations) shows that F. heteroclitus ranks among the most genetically diverse of vertebrates (98th percentile) and firmly within the range of arthropod diversity. This high level of standing genetic variation likely contributes to F. heteroclitus’ ability to adapt to environmental change. High and low variation is nonrandomly distributed across gene functional categories, and across positions within interaction networks, such that evolutionary constraint imposed by pleiotropy linked with core biological processes can be inferred. Patterns of population genetic variation in epithelial tight junction proteins, and patterns of accelerated evolution of cell cycle regulation and apoptosis genes along the F. heteroclitus lineage, offer insight into the mechanisms that may contribute to their physiological plasticity. We detected a genome-wide skew in the relative frequencies of common and rare variation that suggests a post-Pleistocene colonization, which is consistent with the geological history of northwestern Atlantic coastal habitats. This new genome resource, and catalog of variation among many individuals within a population, coupled with our knowledge of their ecology and physiology, provides a foundation for advancing F. heteroclitus as a key model system for understanding gene-by-environment interactions in an evolutionary context.
Supplementary Material
Supplementary data are available at Genome Biology and Evolution online.
Supplementary Material
Acknowledgments
Dawoon Jung (Dartmouth College, present address at Seoul National University, Korea) collected the fish used for fosmid sequencing. Dr Pieter de Jong (Children’s Hospital Oakland Research Institute) prepared fosmid libraries. Dr Haixu Tang (Indiana University) contributed to the transposable elements analysis. This work was primarily supported by a grant from the National Science Foundation (collaborative research grants DEB-1265282, DEB-1120512, DEB-1120013, DEB-1120263, DEB-1120333, DEB-1120398 to J.K.C., D.L.C., M.E.H., S.I.K., M.F.O., J.R.S., W.W., and A.W.). Further support was provided by the National Institute of Environmental Health Sciences (1R01ES021934-01 to A.W., P42ES7373 to T.H.H., P42ES007381 to M.E.H., and R01ES019324 to J.R.S.), the National Institute of General Medical Sciences (P20GM103423 and P20GM104318 to B.L.K.), and the National Science Foundation (DBI-0640462 and XSEDE-MCB100147 to D.G.). Extensive comments contributed by two anonymous reviewers served to significantly improve the manuscript. The views expressed in this article are those of the authors and do not necessarily represent the views or policies of the US EPA.
Literature Cited
- Able KW, Vivian DN, Petruzzelli G, Hagan SM. 2012. Connectivity among salt marsh subhabitats: residency and movements of the Mummichog (Fundulus heteroclitus). Estuaries Coast. 35:743–753. [Google Scholar]
- Abyzov A, Urban AE, Snyder M, Gerstein M. 2011. CNVnator: an approach to discover, genotype, and characterize typical and atypical CNVs from family and population genome sequencing. Genome Res. 21:974–984. [DOI] [PMC free article] [PubMed] [Google Scholar]
- Bao Z, Eddy SR. 2002. Automated de novo identification of repeat sequence families in sequenced genomes. Genome Res. 12:1269–1276. [DOI] [PMC free article] [PubMed] [Google Scholar]
- Begun DJ, Aquadro CF. 1992. Levels of naturally-occurring DNA polymorphism correlate with recombination rates in D. melanogaster. Nature 356:519–520. [DOI] [PubMed] [Google Scholar]
- Bell G. 2013. Evolutionary rescue and the limits of adaptation. Philos Trans R Soc Lond B Biol Sci. 368:20120080.. [DOI] [PMC free article] [PubMed] [Google Scholar]
- Benson G. 1999. Tandem repeats finder: a program to analyze DNA sequences. Nucleic Acids Res. 27:573–580. [DOI] [PMC free article] [PubMed] [Google Scholar]
- Betancur RR, et al. 2013. The tree of life and a new classification of bony fishes. PLoS Curr. 5. doi: 10.1371/currents.tol.53ba26640df0ccaee 75bb165c8c26288. [DOI] [PMC free article] [PubMed] [Google Scholar]
- Brawand D, et al. 2014. The genomic substrate for adaptive radiation in African cichlid fish. Nature 513:375–381. [DOI] [PMC free article] [PubMed] [Google Scholar]
- Brennan RS, Galvez F, Whitehead A. 2015. Reciprocal osmotic challenges reveal mechanisms of divergence in phenotypic plasticity in the killifish Fundulus heteroclitus. J Exp Biol. 218:1212–1222. [DOI] [PubMed] [Google Scholar]
- Burnett KG, et al. 2007. Fundulus as the premier teleost model in environmental biology: opportunities for new insights using genomics. Comp Biochem Physiol Part D Genomics Proteomics. 2:257–286. [DOI] [PMC free article] [PubMed] [Google Scholar]
- Burridge CP, Craw D, Fletcher D, Waters JM. 2008. Geological dates and molecular rates: fish DNA sheds light on time dependency. Mol Biol Evol. 25:624–633. [DOI] [PubMed] [Google Scholar]
- Campo-Paysaa F, et al. 2011. microRNA complements in deuterostomes: origin and evolution of microRNAs. Evol Dev. 13:15–27. [DOI] [PubMed] [Google Scholar]
- Castresana J. 2000. Selection of conserved blocks from multiple alignments for their use in phylogenetic analysis. Mol Biol Evol. 17:540–552. [DOI] [PubMed] [Google Scholar]
- Chain FJJ, et al. 2014. Extensive copy-number variation of young genes across stickleback populations. PLoS Genet. 10:e1004830. [DOI] [PMC free article] [PubMed] [Google Scholar]
- Chaisson MJ, et al. 2015. Resolving the complexity of the human genome using single-molecule sequencing. Nature 517:608–611. [DOI] [PMC free article] [PubMed] [Google Scholar]
- Charlesworth B, Morgan MT, Charlesworth D. 1993. The effect of deleterious mutations on neutral molecular variation. Genetics 134:1289–1303. [DOI] [PMC free article] [PubMed] [Google Scholar]
- Chen PY, et al. 2005. The developmental miRNA profiles of zebrafish as determined by small RNA cloning. Genes Dev. 19:1288–1293. [DOI] [PMC free article] [PubMed] [Google Scholar]
- Choi Y, et al. 2012. Predicting the functional effect of amino acid substitutions and indels. PLoS One 7:e46688.. [DOI] [PMC free article] [PubMed] [Google Scholar]
- Crispo E. 2008. Modifying effects of phenotypic plasticity on interactions among natural selection, adaptation and gene flow. J Evol Biol. 21:1460–1469. [DOI] [PubMed] [Google Scholar]
- Danecek P, et al. 2011. The variant call format and VCFtools. Bioinformatics 27:2156–2158. [DOI] [PMC free article] [PubMed] [Google Scholar]
- Das S, Nozawa M, Klein J, Nei M. 2008. Evolutionary dynamics of the immunoglobulin heavy chain variable region genes in vertebrates. Immunogenetics 60:47–55. [DOI] [PMC free article] [PubMed] [Google Scholar]
- Dawley RM. 1992. Clonal hybrids of the common laboratory fish Fundulus heteroclitus. Proc Natl Acad Sci U S A. 89:2485–2488. [DOI] [PMC free article] [PubMed] [Google Scholar]
- Dayan DI, Crawford DL, Oleksiak MF. 2015. Phenotypic plasticity in gene expression contributes to divergence of locally adapted populations of Fundulus heteroclitus. Mol Ecol. 24:3345–3359. [DOI] [PubMed] [Google Scholar]
- Duvernell DD, Lindmeier JB, Faust KE, Whitehead A. 2008. Relative influences of historical and contemporary forces shaping the distribution of genetic variation in the Atlantic killifish, Fundulus heteroclitus. Mol Ecol. 17:1344–1360. [DOI] [PubMed] [Google Scholar]
- Eden E, et al. 2009. GOrilla: a tool for discovery and visualization of enriched GO terms in ranked gene lists. BMC Bioinformatics 10:48. [DOI] [PMC free article] [PubMed] [Google Scholar]
- Evans LM, et al. 2014. Population genomics of Populus trichocarpa identifies signatures of selection and adaptive trait associations. Nat Genet. 46:1089–1096. [DOI] [PubMed] [Google Scholar]
- EvidentialGene. 2012. EvidentialGene, Evidence Directed Gene Construction for Eukaryotes [Internet]. Available from: http://eugenes.org/EvidentialGene/, last accessed 14 February 2017.
- Excoffier L, et al. 2013. Robust demographic inference from genomic and SNP data. PLoS Genet. 9:e1003905.. [DOI] [PMC free article] [PubMed] [Google Scholar]
- Excoffier L, Foll M. 2011. Fastsimcoal: a continuous-time coalescent simulator of genomic diversity under arbitrarily complex evolutionary scenarios. Bioinformatics 27:1332–1334. [DOI] [PubMed] [Google Scholar]
- Fangue NA, Hofmeister M, Schulte PM. 2006. Intraspecific variation in thermal tolerance and heat shock protein gene expression in common killifish, Fundulus heteroclitus. J Exp Biol. 209:2859–2872. [DOI] [PubMed] [Google Scholar]
- Faust GG, Hall IM. 2014. SAMBLASTER: fast duplicate marking and structural variant read extraction. Bioinformatics 30:2503–2505. [DOI] [PMC free article] [PubMed] [Google Scholar]
- Fay JC, Wyckoff GJ, Wu C-I. 2001. Positive and negative selection on the human genome. Genetics 158:1227–1234. [DOI] [PMC free article] [PubMed] [Google Scholar]
- Feulner PGD, et al. 2013. Genome-wide patterns of standing genetic variation in a marine population of three-spined sticklebacks. Mol Ecol. 22:635–649. [DOI] [PubMed] [Google Scholar]
- Fisher RA. 1930. The genetical theory of natural selection. Oxford: The Clarendon Press. [Google Scholar]
- Fraser HB, et al. 2002. Evolutionary rate in the protein interaction network. Science 296:750–752. [DOI] [PubMed] [Google Scholar]
- Garrison E, Marth G. 2012. Haplotype-based variant detection from short-read sequencing. arXiv Preprint arXiv 1207.3907. [Google Scholar]
- Gilbert D. 2013. Gene-omes built from mRNA seq not genome DNA. In: 7th Annual Arthropod Genomics Symposium. F1000 Research, Notre Dame. Available from: https://doi.org/10.7490/f1000research.1112594.1.
- Gilbert D. 2012. Perfect arthropod genes constructed with gigabases of RNA. In: 6th Annual Arthropod Genomics Symposium. F1000 Research, Kansas State U. Available from: https://doi.org/10.7490/f1000research.1112595.1.
- Gnerre S, et al. 2011. High-quality draft assemblies of mammalian genomes from massively parallel sequence data. Proc Natl Acad Sci U S A. 108:1513–1518. [DOI] [PMC free article] [PubMed] [Google Scholar]
- Gregory TR. 2001. Animal Genome Size Database [Internet]. Available from: http://www.genomesize.com.
- Gutenkunst RN, Hernandez RD, Williamson SH, Bustamante CD. 2009. Inferring the joint demographic history of multiple populations from multidimensional SNP frequency data. PLoS Genet. 5:e1000695.. [DOI] [PMC free article] [PubMed] [Google Scholar]
- Han JS, Boeke JD. 2005. LINE-1 retrotransposons: modulators of quantity and quality of mammalian gene expression? Bioessays 27:775–784. [DOI] [PubMed] [Google Scholar]
- Hardie DC, Hebert PDN. 2004. Genome-size evolution in fishes. Can J Fish Aquat Sci. 61:1636–1646. [Google Scholar]
- Hermisson J, Pennings PS. 2005. Soft sweeps: molecular population genetics of adaptation from standing genetic variation. Genetics 169:2335–2352. [DOI] [PMC free article] [PubMed] [Google Scholar]
- Hinegardner R. 1968. Evolution of cellular DNA content in teleost fishes. Am Nat. 102:517–523. [Google Scholar]
- Howe K, et al. 2013. The zebrafish reference genome sequence and its relationship to the human genome. Nature 496:498–503. [DOI] [PMC free article] [PubMed] [Google Scholar]
- Huang DW, Sherman BT, Lempicki RA. 2009. Systematic and integrative analysis of large gene lists using DAVID bioinformatics resources. Nat Protoc. 4:44–57. [DOI] [PubMed] [Google Scholar]
- Huang XH, et al. 2012. Genome-wide association study of flowering time and grain yield traits in a worldwide collection of rice germplasm. Nat Genet. 44:32–39. [DOI] [PubMed] [Google Scholar]
- Hudson RR. 2002. Generating samples under a Wright-Fisher neutral model of genetic variation. Bioinformatics 18:337–338. [DOI] [PubMed] [Google Scholar]
- Hufford MB, et al. 2012. Comparative population genomics of maize domestication and improvement. Nat Genet. 44:808–811. [DOI] [PMC free article] [PubMed] [Google Scholar]
- Hughes AL, Nei M. 1989. Nucleotide substitution at major histocompatibility complex class-II loci—evidence for overdominant selection. Proc Natl Acad Sci U S A. 86:958–962. [DOI] [PMC free article] [PubMed] [Google Scholar]
- Hughes AL, Nei M. 1988. Pattern of nucleotide substitution at major histocompatibility complex class-I loci reveals overdominant selection. Nature 335:167–170. [DOI] [PubMed] [Google Scholar]
- Jaillon O, et al. 2004. Genome duplication in the teleost fish Tetraodon nigroviridis reveals the early vertebrate proto-karyotype. Nature 431:946–957. [DOI] [PubMed] [Google Scholar]
- Jenny MJ, Aluru N, Hahn ME. 2012. Effects of short-term exposure to 2,3,7,8-tetrachlorodibenzo-p-dioxin on microRNA expression in zebrafish embryos. Toxicol Appl Pharmacol. 264:262–273. [DOI] [PMC free article] [PubMed] [Google Scholar]
- Jiang P, et al. 2007. MiPred: classification of real and pseudo microRNA precursors using random forest prediction model with combined features. Nucleic Acids Res. 35:W339–W344. [DOI] [PMC free article] [PubMed] [Google Scholar]
- Jones FC, et al. 2012. The genomic basis of adaptive evolution in threespine sticklebacks. Nature 484:55–61. [DOI] [PMC free article] [PubMed] [Google Scholar]
- Jovelin R, Cutter AD. 2014. Microevolution of nematode miRNAs reveals diverse modes of selection. Genome Biol Evol. 6:3049–3063. [DOI] [PMC free article] [PubMed] [Google Scholar]
- Jurka J, et al. 2005. Repbase Update, a database of eukaryotic repetitive elements. Cytogenet Genome Res. 110:462–467. [DOI] [PubMed] [Google Scholar]
- Kammerer BD, Kultz D. 2009. Prolonged apoptosis in mitochondria-rich cells of tilapia (Oreochromis mossambicus) exposed to elevated salinity. J Comp Physiol B. 179:535–542. [DOI] [PubMed] [Google Scholar]
- Kasahara M, et al. 2007. The medaka draft genome and insights into vertebrate genome evolution. Nature 447:714–719. [DOI] [PubMed] [Google Scholar]
- Kolaczkowski B, Kern AD, Holloway AK, Begun DJ. 2011. Genomic differentiation between temperate and tropical Australian populations of Drosophila melanogaster. Genetics 187:245–260. [DOI] [PMC free article] [PubMed] [Google Scholar]
- Korneliussen TS, Albrechtsen A, Nielsen R. 2014. ANGSD: analysis of next generation sequencing data. BMC Bioinformatics 15:356.. [DOI] [PMC free article] [PubMed] [Google Scholar]
- Korneliussen TS, Moltke I, Albrechtsen A, Nielsen R. 2013. Calculation of Tajima’s D and other neutrality test statistics from low depth next-generation sequencing data. BMC Bioinformatics 14:289.. [DOI] [PMC free article] [PubMed] [Google Scholar]
- Kozak GM, et al. 2014. Functional and population genomic divergence within and between two species of killifish adapted to different osmotic niches. Evolution 68:63–80. [DOI] [PubMed] [Google Scholar]
- Kozomara A, Griffiths-Jones S. 2014. miRBase: annotating high confidence microRNAs using deep sequencing data. Nucleic Acids Res. 42:D68–D73. [DOI] [PMC free article] [PubMed] [Google Scholar]
- Lamichhaney S, et al. 2015. Evolution of Darwin’s finches and their beaks revealed by genome sequencing. Nature 518:371–375. [DOI] [PubMed] [Google Scholar]
- Lande R. 2009. Adaptation to an extraordinary environment by evolution of phenotypic plasticity and genetic assimilation. J Evol Biol. 22:1435–1446. [DOI] [PubMed] [Google Scholar]
- Langmead B, Salzberg SL. 2012. Fast gapped-read alignment with Bowtie 2. Nat Methods. 9:357–359. [DOI] [PMC free article] [PubMed] [Google Scholar]
- Layer RM, Chiang C, Quinlan AR, Hall IM. 2014. LUMPY: a probabilistic framework for structural variant discovery. Genome Biol. 15:R84.. [DOI] [PMC free article] [PubMed] [Google Scholar]
- Leffler EM, et al. 2012. Revisiting an old riddle: what determines genetic diversity levels within species? PLoS Biol. 10:e1001388.. [DOI] [PMC free article] [PubMed] [Google Scholar]
- Li H, et al. 2009. The sequence alignment/map format and SAMtools. Bioinformatics 25:2078–2079. [DOI] [PMC free article] [PubMed] [Google Scholar]
- Liti G, et al. 2009. Population genomics of domestic and wild yeasts. Nature 458:337–341. [DOI] [PMC free article] [PubMed] [Google Scholar]
- Lotze HK, et al. 2006. Depletion, degradation, and recovery potential of estuaries and coastal seas. Science 312:1806–1809. [DOI] [PubMed] [Google Scholar]
- Loytynoja A, Goldman N. 2005. An algorithm for progressive multiple alignment of sequences with insertions. Proc Natl Acad Sci U S A. 102:10557–10562. [DOI] [PMC free article] [PubMed] [Google Scholar]
- Mackay TFC, et al. 2012. The Drosophila melanogaster genetic reference panel. Nature 482:173–178. [DOI] [PMC free article] [PubMed] [Google Scholar]
- Maynard Smith J, Haigh J. 1974. The hitch-hiking effect of a favourable gene. Genet Res. 23:23–35. [PubMed] [Google Scholar]
- Meredith WH, Lotrich VA. 1979. Production dynamics of a tidal creek population of Fundulus heteroclitus (Linnaeus). Estuar Coast Mar Sci. 8:99–118. [Google Scholar]
- Mikkelsen TS, et al. 2005. Initial sequence of the chimpanzee genome and comparison with the human genome. Nature 437:69–87. [DOI] [PubMed] [Google Scholar]
- Mishima Y. 2012. Widespread roles of microRNAs during zebrafish development and beyond. Dev Growth Differ. 54:55–65. [DOI] [PubMed] [Google Scholar]
- Nacci D, Champlin D, Jayaraman S. 2010. Adaptation of the estuarine fish Fundulus heteroclitus (Atlantic Killifish) to polychlorinated biphenyls (PCBs). Estuaries Coast. 33:853–864. [Google Scholar]
- Nei M, Gu X, Sitnikova T. 1997. Evolution by the birth-and-death process in multigene families of the vertebrate immune system. Proc Natl Acad Sci U S A. 94:7799–7806. [DOI] [PMC free article] [PubMed] [Google Scholar]
- Parra G, Bradnam K, Korf I. 2007. CEGMA: a pipeline to accurately annotate core genes in eukaryotic genornes. Bioinformatics 23:1061–1067. [DOI] [PubMed] [Google Scholar]
- Patrick ML, Part P, Marshall WS, Wood CM. 1997. Characterization of ion and acid-base transport in the fresh water adapted mummichog (Fundulus heteroclitus). J Exp Zool. 279:208–219. [Google Scholar]
- Patrick ML, Wood CM. 1999. Ion and acid-base regulation in the freshwater mummichog (Fundulus heteroclitus): a departure from the standard model for freshwater teleosts. Comp Biochem Physiol A Mol Integr Physiol. 122:445–456. [Google Scholar]
- Poelstra JW, et al. 2014. The genomic landscape underlying phenotypic integrity in the face of gene flow in crows. Science 344:1410–1414. [DOI] [PubMed] [Google Scholar]
- Pool JE, et al. 2012. Population genomics of sub-Saharan Drosophila melanogaster: African diversity and non-African admixture. PLoS Genet. 8:e1003080. [DOI] [PMC free article] [PubMed] [Google Scholar]
- Powers DA, et al. 1993. A multidisciplinary approach to the selectionist/neutralist controversy using the model teleost, Fundulus heteroclitus In: Futuyma D, Antonovics J, editors. Oxford surveys in evolutionary biology. New York: Oxford University Press; p. 43-108. [Google Scholar]
- Price AL, Jones NC, Pevzner PA. 2005. De novo identification of repeat families in large genomes. Bioinformatics 21(Suppl. 1):i351–i358. [DOI] [PubMed] [Google Scholar]
- Quach H, et al. 2009. Signatures of purifying and local positive selection in human miRNAs. Am J Hum Genet. 84:316–327. [DOI] [PMC free article] [PubMed] [Google Scholar]
- Quinlan AR, Hall IM. 2010. BEDTools: a flexible suite of utilities for comparing genomic features. Bioinformatics 26:841–842. [DOI] [PMC free article] [PubMed] [Google Scholar]
- Rawlings-Goss RA, Campbell MC, Tishkoff SA. 2014. Global population-specific variation in miRNA associated with cancer risk and clinical biomarkers. BMC Med Genomics. 7:53. [DOI] [PMC free article] [PubMed] [Google Scholar]
- Reid NM, et al. 2016. The genomic landscape of rapid repeated evolutionary adaptation to toxic pollution in wild fish. Science 354:1305–1308. [DOI] [PMC free article] [PubMed] [Google Scholar]
- Romiguier J, et al. 2014. Comparative population genomics in animals uncovers the determinants of genetic diversity. Nature 515:261–263. [DOI] [PubMed] [Google Scholar]
- Sackton TB, et al. 2009. Population genomic inferences from sparse high-throughput sequencing of two populations of Drosophila melanogaster. Genome Biol Evol. 1:449–465. [DOI] [PMC free article] [PubMed] [Google Scholar]
- Savolainen O, Lascoux M, Merila J. 2013. Ecological genomics of local adaptation. Nat Rev Genet. 14:807–820. [DOI] [PubMed] [Google Scholar]
- Schartl M, et al. 2013. The genome of the platyfish, Xiphophorus maculatus, provides insights into evolutionary adaptation and several complex traits. Nat Genet. 45:567–572. [DOI] [PMC free article] [PubMed] [Google Scholar]
- Scheiner SM. 1993. Genetics and evolution of phenotypic plasticity. Annu Rev Ecol Syst. 24:35–68. [Google Scholar]
- Schlichting CD, Smith H. 2002. Phenotypic plasticity: linking molecular mechanisms with evolutionary outcomes. Evol Ecol. 16:189–211. [Google Scholar]
- Schultz ET, McCormick SD. 2013. Euryhalinity in an evolutionary context. In: Stephen D. McCormick, Anthony Peter Farrell, and Colin J. Brauner, editors. Elsevier, New York. Euryhaline fishes. 32: 477–533. [Google Scholar]
- Scott GR, et al. 2004. Intraspecific divergence of ionoregulatory physiology in the euryhaline teleost Fundulus heteroclitus: possible mechanisms of freshwater adaptation. J Exp Biol. 207:3399–3410. [DOI] [PubMed] [Google Scholar]
- Selbach M, et al. 2008. Widespread changes in protein synthesis induced by microRNAs. Nature 455:58–63. [DOI] [PubMed] [Google Scholar]
- Shaw JR, et al. 2014. Natural selection canalizes expression variation of environmentally induced plasticity-enabling genes. Mol Biol Evol. 31:3002–3015. [DOI] [PMC free article] [PubMed] [Google Scholar]
- Smit A, Hubley R. 2008–2015. RepeatModeler Open-1.0 [Internet]. Institute for Systems Biology. Available from: http://www.repeatmasker.org.
- Smit A, Hubley R, Green P. 2013–2015. RepeatMasker Open-4.0 [Internet]. Institute for Systems Biology. Available from: http://www.repeatmasker.org.
- Sweeney J, Deegan L, Garritt R. 1998. Population size and site fidelity of Fundulus heteroclitus in a macrotidal saltmarsh creek. Biol Bull. 195:238–239. [DOI] [PubMed] [Google Scholar]
- Tanaka T, Nei M. 1989. Positive Darwinian selection observed at the variable-region genes of immunoglobulins. Mol Biol Evol. 6:447–459. [DOI] [PubMed] [Google Scholar]
- Teo SLH, Able KW. 2003. Growth and production of the mummichog (Fundulus heteroclitus) in a restored salt marsh. Estuaries 26:51–63. [Google Scholar]
- Tsai IJ, Otto TD, Berriman M. 2010. Improving draft assemblies by iterative mapping and assembly of short reads to eliminate gaps. Genome Biol. 11:R41.. [DOI] [PMC free article] [PubMed] [Google Scholar]
- Valiela I, Wright JE, Teal JM, Volkmann SB. 1977. Growth, production and energy transformations in the salt-marsh killifish Fundulus heteroclitus. Mar Biol. 40:135–144. [Google Scholar]
- Van Itallie CM, Anderson JM. 2006. Claudins and epithelial paracellular transport. Annu Rev Physiol. 68:403–429. [DOI] [PubMed] [Google Scholar]
- Van Veld PA, Nacci DE. 2008. Toxicity resistance In: Di Giulio RT, Hinton DE, editors. The toxicology of fishes. Boca Raton (FL: ): Taylor and Francis. [Google Scholar]
- Via S, et al. 1995. Adaptive phenotypic plasticity: consensus and controversy. Trends Ecol Evol. 10:212–217. [DOI] [PubMed] [Google Scholar]
- Via S, Lande R. 1985. Genotype-environment interaction and the evolution of phenotypic plasticity. Evolution 39:505–522. [DOI] [PubMed] [Google Scholar]
- Vieira FG, Fumagalli M, Albrechtsen A, Nielsen R. 2013. Estimating inbreeding coefficients from NGS data: impact on genotype calling and allele frequency estimation. Genome Res. 23:1852–1861. [DOI] [PMC free article] [PubMed] [Google Scholar]
- Volff JN, Bouneau L, Ozouf-Costaz C, Fischer C. 2003. Diversity of retrotransposable elements in compact pufferfish genomes. Trends Genet. 19:674–678. [DOI] [PubMed] [Google Scholar]
- von Baumgarten RJ, Simmonds RC, Boyd JF, Garriott OK. 1975. Effects of prolonged weightlessness on the swimming pattern of fish aboard Skylab 3. Aviat Space Environ Med. 46:902–906. [PubMed] [Google Scholar]
- Wagner A. 2001. The yeast protein interaction network evolves rapidly and contains few redundant duplicate genes. Mol Biol Evol. 18:1283–1292. [DOI] [PubMed] [Google Scholar]
- Waterhouse RM, et al. 2013. OrthoDB: a hierarchical catalog of animal, fungal and bacterial orthologs. Nucleic Acids Res. 41:D358–D365. [DOI] [PMC free article] [PubMed] [Google Scholar]
- Whitehead A, Galvez F, et al. 2011. Functional genomics of physiological plasticity and local adaptation in killifish. J Hered. 102:499–511. [DOI] [PMC free article] [PubMed] [Google Scholar]
- Whitehead A, Roach JL, Zhang S, Galvez F. 2011. Genomic mechanisms of evolved physiological plasticity in killifish distributed along an environmental salinity gradient. Proc Natl Acad Sci U S A. 108:6193–6198. [DOI] [PMC free article] [PubMed] [Google Scholar]
- Whitehead A, Roach JL, Zhang SJ, Galvez F. 2012. Salinity- and population-dependent genome regulatory response during osmotic acclimation in the killifish (Fundulus heteroclitus) gill. J Exp Biol. 215:1293–1305. [DOI] [PubMed] [Google Scholar]
- Whitehead A, Zhang SJ, Roach JL, Galvez F. 2013. Common functional targets of adaptive micro- and macro-evolutionary divergence in killifish. Mol Ecol. 22:3780–3796. [DOI] [PubMed] [Google Scholar]
- Wicker T, et al. 2007. A unified classification system for eukaryotic transposable elements. Nat Rev Genet. 8:973–982. [DOI] [PubMed] [Google Scholar]
- Wolanski E. 2007. Estuarine ecohydrology. Amsterdam/Oxford: Elsevier. [Google Scholar]
- Wood CM, Marshall WS. 1994. Ion balance, acid-base regulation, and chloride cell function in the common killifish, Fundulus heteroclitus: a euryhaline estuarine teleost. Estuaries 17:34–52. [Google Scholar]
- Yang ZH. 2007. PAML 4: phylogenetic analysis by maximum likelihood. Mol Biol Evol. 24:1586–1591. [DOI] [PubMed] [Google Scholar]
- Yozzo DJ, Smith DE. 1998. Composition and abundance of resident marsh-surface nekton: comparison between tidal freshwater and salt marshes in Virginia, U S A. Hydrobiologia 362:9–19. [Google Scholar]
Associated Data
This section collects any data citations, data availability statements, or supplementary materials included in this article.