

Abstract
A fundamental goal in biology is to gain a quantitative understanding of how appropriate cell responses are achieved amid conflicting signals that work in parallel. Here, through live, single-cell imaging, we monitored both the dynamics of nuclear factor κB (NF-κB) signaling and inflammatory cytokine transcription in macrophages exposed to the bacterial product lipopolysaccharide (LPS). Our analysis revealed a previously uncharacterized positive feedback loop involving induction of the expression of Rela [which encodes the RelA (p65) subunit of NF-κB], which rewires the regulatory network when cells were stimulated with LPS above a distinct concentration. Paradoxically, this rewiring of NF-κB signaling in macrophages (a myeloid cell type) required the transcription factor Ikaros, which promotes the development of lymphoid cells. Mathematical modeling and experimental validation showed that the RelA positive feedback overcame existing negative feedback loops and enabled cells to discriminate between different concentrations of LPS so as to mount an effective innate immune response only at higher concentrations. We suggest that this switching in the relative dominance of feedback loops (“feedback dominance switching”) may be a general mechanism whereby immune cells integrate opposing feedback on a key transcriptional regulator and set a response threshold for the host.
Introduction
Microbe-sensing and subsequent responses by innate immune cells exemplify a physiological event in which a cell receives a signal, processes the relevant information encoded, and makes fateful decisions. Macrophages provide a first line of defense against gram-negative bacteria by recognizing the microbial product lipopolysaccharide (LPS) as a conserved pathogen-associated molecular pattern through Toll-like receptor 4 (TLR4) (1–3). The stimulation of TLR4 with LPS leads to the activation of a complex signaling network involving the adaptor proteins myeloid differentiation primary response protein 88 (MyD88) and TIR domain-containing adaptor inducing interferon-beta (TRIF); the activation of transcription factors, such as nuclear factor κB (NF-κB), activator protein 1 (AP-1), and interferon regulatory factors (IRFs); and induction of the expression of genes that encode cytokines, such as tumor necrosis factor α (TNF-α) and type I interferons (IFNs), as well as their secretion (4).
The complexity of early and late signaling cascades and genetic networks and the induction of feedback loops pose a great challenge to our understanding of how macrophages resolve concurrently activated opposing signals to achieve an appropriate host response. In particular, the expression of multiple genes encoding feedback components is directly induced after the initial activation of NF-κB by inhibitor of NF-κB (IκB) kinase (IKK)–mediated degradation of IκB proteins (5). Most notably, the IκB family of proteins provide potent negative feedback, such that a delayed re-synthesis of IκB proteins forms the basis for the oscillatory activity of NF-κB (6, 7). Previous studies of the NF-κB regulatory network have focused on these negative feedback mechanisms (8–10) and have not considered the signal-processing consequences that arise from the integration of positive and negative feedback loops. Moreover, although single-cell studies have demonstrated that true signaling dynamics are often masked by population-based methods (6, 7, 11–15), NF-κB signaling dynamics have not been examined in any immune cells at the single-cell level, and no previous studies have addressed both NF-κB dynamics and consequent transcriptional output in the same cells.
Here, we characterized both the dynamics of NF-κB signaling and the transcriptional output from a TNF-α promoter in individual macrophages, which are critical effector cells of innate immunity. We found that the LPS-induced NF-κB dynamics in these cells are markedly different from the previously reported patterns measured in non-immune cells. Through quantitative live-cell imaging and analysis, we discovered that macrophages are capable of interpreting the concentration of LPS through analog, single-cell responses to variations in dose. Closely linked to this behavior was a previously uncharacterized positive feedback mechanism on a gene encoding NF-κB itself. Namely, we characterized Rela, which encodes the key transactivation subunit RelA (also known as p65), as an NF-κB target gene in macrophages. Through mathematical modeling, genome-wide small interfering RNA (siRNA) screening, and expression profiling, we identified the transcription factor Ikaros as a key requirement for the activation of the NF-κB positive feedback mechanism in response to a distinct concentration of LPS, which we described as “feedback dominance switching.” This switching coincided with the transition point to the activation of an effective anti-bacterial transcriptional program. Our findings underscore the complexity of long-term signaling and transcriptional dynamics in single cells, and provide insight into how innate immune cells can sense a critical dose of LPS and mount a decisive response despite the presence of opposing feedback mechanisms.
Results
Live-cell imaging of a dual reporter clone reveals longer-term signaling dynamics and gene expression kinetics in single macrophages
To monitor real-time NF-κB signaling dynamics in immune cells, we generated a macrophage cell line that expresses an endogenous Rela promoter–driven fusion of enhanced green fluorescent protein (EGFP) and RelA (EGFP-RelA) together with a Tnf promoter–driven fast-degrading mCherry fluorescent protein. This reporter cell clone enables visualization of both NF-κB nuclear translocation and the regulation of a key NF-κB target gene in live cells (Fig. 1A and fig. S1). In response to LPS (10 ng/ml), most cells showed maximal nuclear translocation of NF-κB by 1 hour, which was followed by a decrease within five hours (Fig. 1 and movies S1 to S3). After this initial phase, individual cells had varying degrees of subsequent nuclear localization of NF-κB. These kinetics of NF-κB signaling are different from the previously characterized short-lived responses observed in LPS-treated fibroblasts or the oscillatory dynamics observed in response to cytokines (6, 7, 13). This suggests that previous models of NF-κB dynamics may not apply directly to LPS signaling in macrophages, a physiologically relevant model for innate immune activation by pathogenic stimuli. The Tnf promoter–driven expression of mCherry was induced by LPS as expected, and was sustained for several hours (Fig. 1C and fig. S1D). The short half-life of mCherry caused by the presence of the PEST motif enabled us to estimate the synthesis rate of the Tnf promoter–driven mCherry reporter from the observed net fluorescence (fig. S2A, and see the Materials and Methods). From an initial analysis, the correlation between the extent of mCherry synthesis and the nuclear abundance of EGFP-RelA at any fixed time point was low (fig. S2B), which suggested that additional aspects of NF-κB signaling and the reporter response needed to be considered.
Fig. 1. Quantitative live-cell imaging of NF-κB dynamics and target gene expression in LPS-treated RAW264.7 cells at the single-cell level.
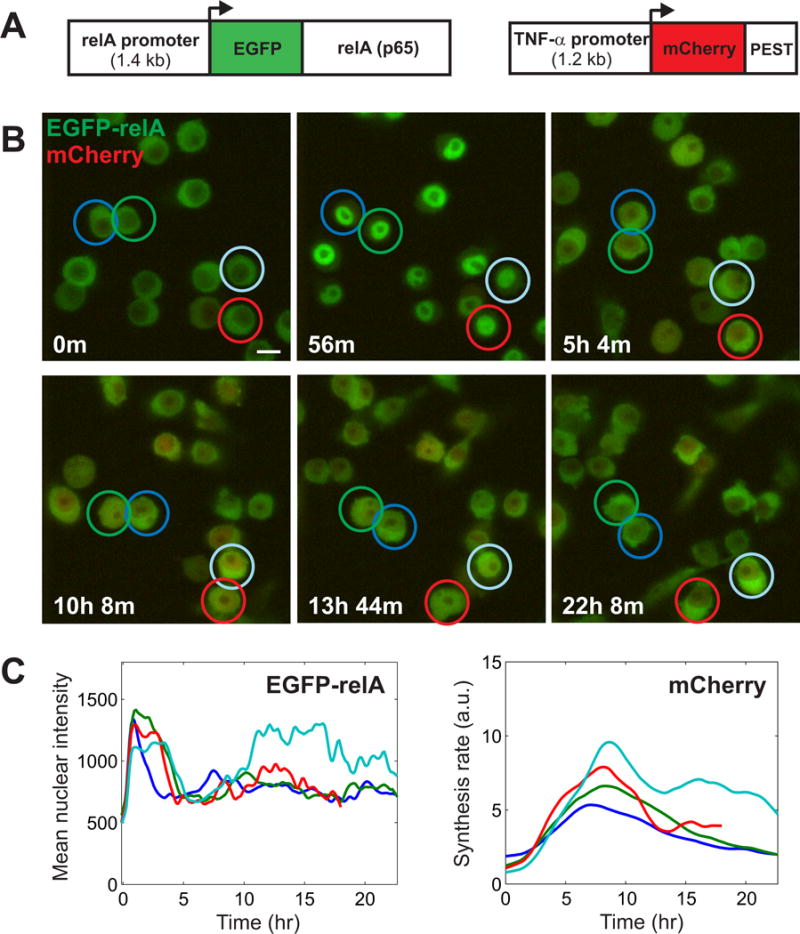
(A) Schematic showing the two fluorescent proteins expressed by the lentiviral construct used to generate the reporter clone from RAW264.7 cells (see fig. S1). (B and C) Time-lapse images taken of the RAW264.7 dual reporter cell clone at the specified times after treatment with LPS (10 ng/ml). Four cells that are marked were tracked over time. A designated color is used to match each cell and its quantified time series between (B) and (C). (C) Quantification of EGFP fluorescence and the estimated extent of mCherry synthesis from the cells shown in (B) (see Materials and Methods and fig. S2). The time lapse data in (B) and (C) are taken from Movie S3. Scale bar: 10 μm.
The response to varying concentrations of LPS is analog
To determine how LPS signaling information is processed through NF-κB dynamics, we varied the dose of LPS within a physiological range and examined the characteristics of the single-cell responses (Fig. 2A, fig. S3, and movies S3 to S7). Consistent with an analog response, nearly all of the cells underwent the first phase of NF-κB activation in response to all of the doses of LPS tested (Fig. 2B), which was in contrast to the digital response observed in non-immune cells in which only a fraction of cells respond to low concentrations of cytokine (14). The time to the first peak of NF-κB nuclear localization shortened gradually with increasing concentrations of LPS, as expected (Fig. 2C); however, the maximal nuclear EGFP-RelA intensity and the duration of the first phase were similar for all but the lowest dose of LPS (Fig. 2, D and E). Moreover, the correlation between the activity of the TNF-α:mCherry reporter and dynamics of NF-κB nuclear translocation was low (Fig. 2F, left). The single cells treated with high concentrations of LPS (above the diagonal, with increased mCherry synthesis but with a low area under the nuc:total curve) contributed to the poor correlation. A closer examination revealed that these individual cells sustained high EGFP-RelA abundance in the nucleus even when the relative ratio of nuclear EGFP-RelA to total cellular EGFP-RelA returned to that of unstimulated cells (Fig. 2G and fig. S4). This unexpected observation was attributable to an increase in the total cellular EGFP-RelA fluorescence beyond a threshold dose of LPS (Fig. 2H and fig. S5). This threshold dose was higher than that required for maximal peak height and duration (Fig. 2, D and E). As a consequence of the increase in EGFP-RelA abundance, the nuclear translocation dynamics diverged from the dynamics of the nuclear intensity in these cells (fig. S4).
Fig. 2. Analog encoding of LPS dose information by NF-κB dynamics and dose-dependent increase of RelA abundance.
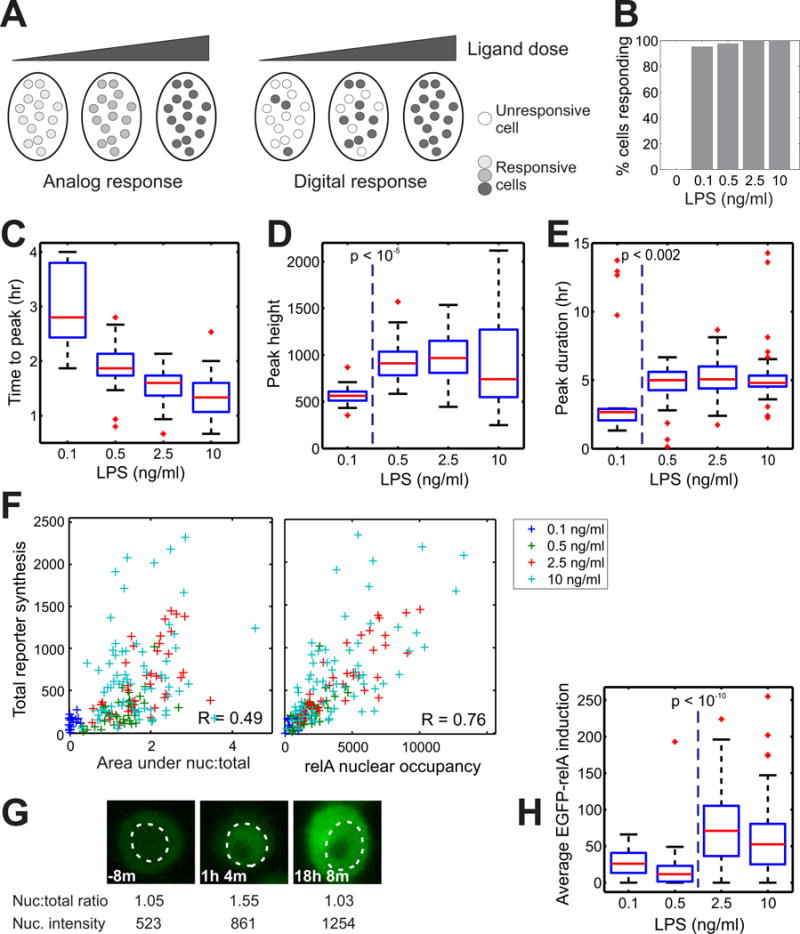
(A) Outline of the two different scenarios for single-cell responses to stimuli. (B) RAW264.7 cells were left untreated or were treated with the indicated doses of LPS, and the percentages of responding cells were determined by live-cell imaging. (C to E) Data from the cells treated in (B) were analyzed to determine (C) the time taken to reach the first peak of nuclear translocation of RelA, (D) the magnitude of the first peak, which was quantified by measurement of the maximal intensity of nuclear EGFP, and (E) the duration of the first peak of RelA nuclear translocation. (F) The correlation of total mCherry synthesis versus the area under the curve of the ratio of nuclear to total EGFP-RelA abundance (the area between the curve and 1) (left) or the RelA nuclear occupancy (right) for the indicated doses of LPS. R values are correlation coefficients. (G) Time-lapse images of a cell showing the increased abundance of EGFP-RelA after stimulation with LPS (10 ng/ml), whereas the ratio of the intensities of nuclear EGFP-RelA to total EGFP-RelA returned to the basal ratio. The white dashed line marks the outline of the nucleus. (H) Activation of the positive feedback by RelA above a distinct dose of LPS. P values were calculated by the Kruskal-Wallis test for (C) to (E) and (H). The number of cells analyzed in (B) to (H) are 20, 41, 39, and 68 for 0.1, 0.5, 2.5, 10 ng/ml of LPS, respectively, combined from two or more experiments for each condition.
We therefore considered a large number of kinetic measurements from single-cell imaging and determined the most informative feature that explained reporter output by partial least squares regression. This analysis revealed that “RelA nuclear occupancy,” which represents the activity of nuclear NF-κB integrated over time and reflects the EGFP-RelA abundance, is the best determinant of reporter activity (Fig. 2F, right, and fig. S6). Indeed, the correlation between NF-κB nuclear occupancy and Tnfpromoter–driven reporter output was substantial at the single-cell level, despite the stochastic nature of gene expression (16, 17) and other transcription factors that regulate gene expression downstream of TLR4 (4, 18–23). This finding highlights a central regulatory function for NF-κB in Tnf expression in macrophages, and suggests that the increased abundance of RelA is linked to the tight control of gene expression by NF-κB.
The increase in RelA abundance above a threshold dose of LPS constitutes a previously uncharacterized positive feedback loop that promotes a functional response
The increase in the abundance of EGFP-RelA that we observed was unexpected, because the amount of RelA protein is thought to be cell type–specific, but invariant in response to stimuli. Given that the genes encoding all of the other members of the NF-κB family, except Rela, are direct target genes of NF-κB (5, 18), we tested whether the endogenous Rela locus is also inducible. We found that the amounts of RelA mRNA and protein were indeed increased, not only in our macrophage cell line but also in primary bone marrow–derived macrophages (BMDMs), by LPS or by the purified TLR4 ligand Kdo2-lipid A, specifically at high doses (Fig. 3, A to D, and fig. S7A). Moreover, the RelA subunit of NF-κB bound to the Rela promoter as determined by chromatin immunoprecipitation (ChIP) assay (fig. S7, B and C). The inclusion of this endogenous binding site in our construct (Fig. 1A and fig. S1A) likely enabled the similar regulation of EGFP-RelA abundance by NF-κB. A previously developed reporter clone expressing EGFP-RelA driven by a constitutive Ubc (ubiquitin-c) promoter does not exhibit an LPS-dependent increase in EGFP abundance (24). These data suggest that Rela is a direct NF-κB target gene, and that RelA abundance is increased by NF-κB signaling in LPS-stimulated macrophages. This constitutes a previously unappreciated positive feedback loop, and we propose that this mechanism of positive feedback counteracts the well-known negative feedback loops that regulate NF-κB signaling to promote the sustained nuclear occupancy of NF-κB in response to higher doses of LPS.
Fig. 3. The induction of endogenous RelA underlies the activation of a focused innate immune defense program in primary macrophages.
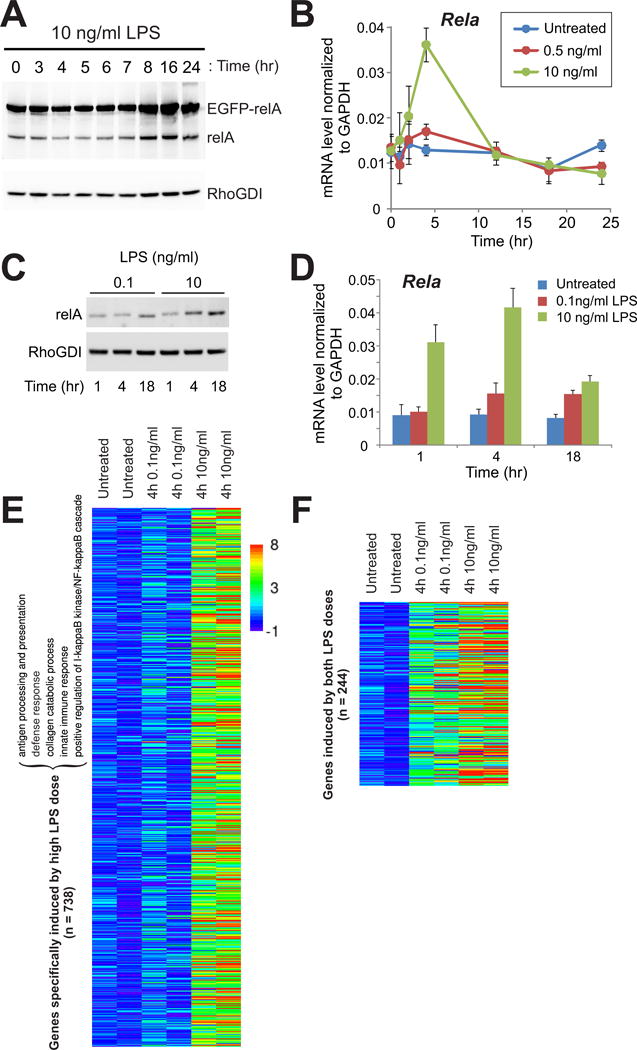
(A) RAW264.7 cells were left untreated or were treated with LPS (10 ng/ml) for the indicated times before being analyzed by Western blotting with antibodies against RelA and RhoGDI as a loading control. Data are representative of two independent experiments. (B) LPS dose–dependent induction of Rela expression. RAW264.7 cells were left untreated or were stimulated with the indicated concentrations of LPS, and the amounts of Rela mRNA were measured by quantitative RT-PCR analysis. Data are means ± SD and are representative of two independent experiments. (C) BMDMs were treated with the indicated concentrations of LPS for the indicated times before being analyzed by Western blotting with antibodies specific for RelA and RhoGDI. Data are representative of three independent experiments. (D) LPS dose–dependent induction of of Rela expression in BMDMs. BMDMs were left untreated or were treated with the indicated concentrations of LPS for the indicated times. The amounts of Rela mRNA were measured by quantitative RT-PCR analysis, and are expressed relative to the amount of GAPDH mRNA. Data are means ± SD and are representative of two independent experiments. (E to F) Identification of two classes of genes based on their responses to variations in LPS dose. The heat maps in (E) and (F) display Illumina microarray data from BMDMs as normalized expression ratios in log2 scale. For full GO analysis, see fig. S8. N, number of genes.
Noting the switch-like onset of RelA induction at a distinct dose of LPS (Fig. 2H), we then sought to determine what distinguished between the macrophage response regimes above and below this threshold. To evaluate the functional importance of this LPS dose threshold, we performed expression microarray analysis of primary macrophages stimulated with increasing concentrations of LPS. From the gene expression profiles, we identified two gene sets based on whether their expression was induced by both low and high doses of LPS or specifically by the higher LPS dose (Fig. 3, E and F). Although substantially more genes were induced specifically in response to the higher dose of LPS (738 versus 244), only a small number of gene ontology (GO) categories were enriched in this set (Fig. 3, E and F, and fig. S8). This response to high-dose LPS coincided with a shift toward the dominance of positive feedback, which may have been sufficient to override the negative feedback from numerous genes, including IκBα, IκBε, and A20 (fig. S9). Notably, the gene classes enriched for high-dose LPS are more functionally coherent and consistent with a robust anti-bacterial macrophage response, whereas the genes induced by both high and low doses of LPS had opposing functions (figs. S8 and S9A). These patterns suggest that the LPS dose threshold may represent the transition point at which macrophages resolve opposing feedback signals to mount a decisive immune response.
Switching of feedback dominance enhances the ability of cells to discriminate between different doses of LPS
Next, we incorporated the newly characterized positive feedback loop into a mathematical model of LPS-induced NF-κB dynamics to explore its quantitative effect. The increase in RelA abundance was represented as a delayed synthesis process that depended both on the concentration of LPS and the amount of NF-κB in the nucleus (Fig. 4A). The simulations revealed that, as the LPS dose increased, the presence of the positive feedback loop counteracted the negative feedback loops provided by IκBs (despite a concomitant increase in their induction rates), and enabled a more sustained response, in agreement with the imaging data (Fig. 4B). Consequently, the integrated activity of NF-κB over the signaling time course distinguished between the different doses of LPS more efficiently, especially through differential late-stage activity (Fig. 4, B and C). Our modeling result suggests that the dose-dependent activation of positive feedback facilitates a much greater dynamic range of NF-κB signaling across different doses of LPS. This result and the dose-sensitive transcriptional program suggest a role for the RelA positive feedback loop in the discrimination between different concentrations of LPS and the subsequent functional response.
Fig. 4. Switching of feedback dominance through self-amplified NF-κB enhances the ability to discriminate between doses of LPS.
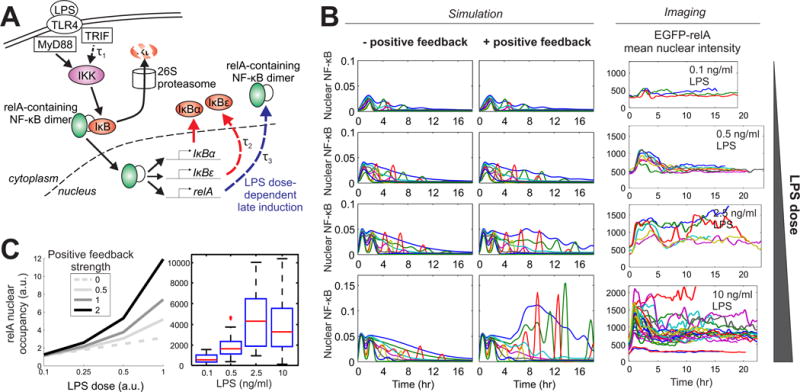
(A) Representation of the computational model for LPS signaling in macrophages. The processes incorporated with an explicit time delay are marked with dashed arrows. The TRIF pathway is activated by LPS with the delay τ1. The synthesis of IκBε induced by NF-κB involves the delay τ2. The late induction of RelA synthesis is included with the delay τ3. (B) Simulated time series with or without the RelA positive feedback (left two columns), and single-cell time courses of NF-κB dynamics (the intensity of EGFP-RelA in the nucleus) from live-cell imaging (right column; data are from fig. S3). Curves in different colors represent individual single cells. (C) Positive feedback from RelA provides better discrimination of LPS doses. The integrated nuclear occupancy of NF-κB (area under curve from the time series of free nuclear NF-κB) is plotted against the simulated LPS dose (coded in the model as a multiplicative constant for the rate of IKK activation). The strength of the positive feedback is varied by multiplying the reference value for the rate of RelA production parameter by 2 or 0.5. The result in the absence of the positive feedback is also included for comparison. Right: the observed LPS dose–dependence of RelA nuclear occupancy from live-cell imaging.
Another consequence of a functionally important positive feedback loop is often exhibited as hysteresis, a phenomenon in which the response to a given dose depends on the past history of stimulation (Fig. 5A). We tested for the presence of hysteresis in LPS-induced responses first by mathematical modeling and then by experimentation. When we simulated dose-responses separately for different dose trajectories with the mathematical model that we described earlier, we observed hysteresis (Fig. 5B). To evaluate this experimentally, we treated RAW264.7 cells with either a high or low concentration of LPS and then we subsequently switched the dose LPS to various concentrations (Fig. 5C). For a response read-out, we measured the abundances of transcripts of the innate immune genes Ifit3, Ifih1, and Il18. Previous exposure of cells to the high concentration of LPS elicited substantially higher transcriptional output than was observed in cells that were treated with a low dose of LPS (Fig. 5D). We confirmed the rapid turnover of mRNAs to validate the use of transcript abundance for a response read-out. Thus, the hysteresis that we predicted by modeling was also experimentally validated, which lends additional support to the functionality of positive feedback in the system.
Fig. 5. The prediction and validation of hysteresis by analyzing the LPS dose–dependent transcriptional patterns of innate immune response genes support the functionality of the RelA positive feedback loop.
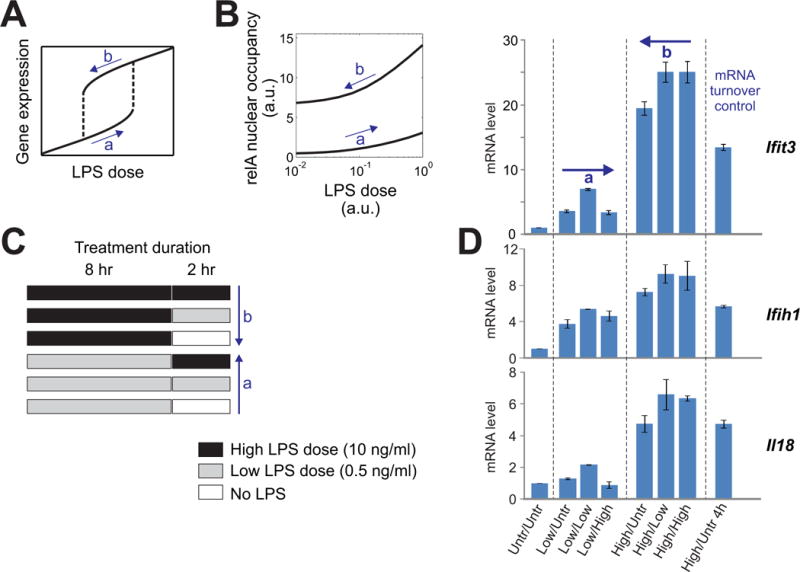
(A) Hysteresis in a schematic dose-response curve. (B) Computational simulations of dose-responses with a model of NF-κB dynamics in macrophages. The simulations were implemented by two successive runs (of 8 hour time-course each) of a numerical solver in MATLAB, with the solution of the first run provided as the history for the second run (see Materials and Methods for details). (C) Treatment protocols for testing hysteresis in a macrophage cell line. The labeled arrows “a” and “b” correspond to the arrows in (A). (D) RAW264.7 cells were stimulated according to the protocol in (C). The amounts of Ifit3, Ifih1, and Il18 mRNAs were evaluated by quantitative RT-PCR analysis and were normalized to those of untreated control cells. The labeled arrows “a” and “b” correspond to the arrows in (A). The sample labeled “mRNA turnover control” was collected with a longer waiting time after removing the high dose of LPS. The decrease from the “b” samples observed in this control shows that the maintenance of increased amounts of mRNA in group “b” were not a result of the stability of the mRNAs. Data are means ± SD and are representative of two independent experiments. Untr, untreated; low, low dose of LPS; high, high dose of LPS.
The LPS dose–specific positive feedback loop and transcriptional response require Ikaros
The dose-dependency of the RelA induction suggested the involvement of an unknown factor that might be activated specifically by high doses of LPS to enable the transcriptional induction of Rela in macrophages. In the course of a genome-wide siRNA screen using the same cell line, we identified genes whose knockdown perturbed both LPS-induced EGFP-RelA expression and TNF-α reporter activity. Hypothesizing that this unknown factor might also be among our list of genes specifically induced in primary macrophages by a high dose of LPS (Fig. 3E), we overlapped genes from these two genome-scale analyses. This led to the identification of Ikaros (Ikzf1) as a candidate transcription factor involved in the induction of Rela expression (fig. S10). Indeed, we used ChIP assays to detect the binding of Ikaros to the Rela promoter in response to a high dose of LPS (Fig. 6A). Moreover, the LPS-induced increase in Rela mRNA abundance was highly dependent on Ikaros (Fig. 6B); thus we were able to block the positive feedback by knocking down Ikaros with specific siRNA (Fig. 6C). Through knockdown of Ikaros to remove the RelA positive feedback loop, but not the constitutive expression of RelA, we then assessed how the dose-dependent expression of LPS-responsive genes was altered in the absence of the positive feedback, amid numerous other induced gene products that have positive and negative effects on NF-κB signaling (25). As predicted by the mathematical model (Fig. 4C, left), LPS dose discrimination by the macrophage cells was substantially hampered for a series of innate immune response genes in the absence of the positive feedback loop (Fig. 6D). We next tested how the increase in RelA abundance was affected in primary macrophages derived from a homozygous Ikaros-deficient mouse (26). We found that the LPS dose–dependent increase in RelA abundance occurred only in primary macrophages from a wild-type mouse (littermate control), but not from an Ikaros-deficient mouse (Fig. 6, E to G). Moreover, the induction of innate immune genes in response to a high dose of LPS was markedly attenuated in the absence of Ikaros (Fig. 6H).
Fig. 6. The RelA positive feedback loop and the LPS dose–dependent transcriptional response depend on Ikaros.
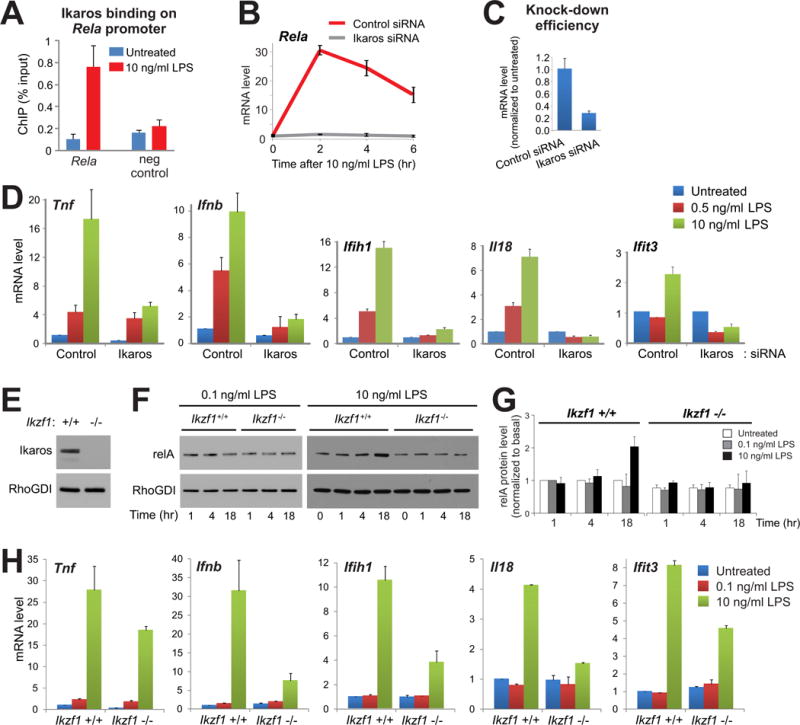
(A) LPS-induced binding of Ikaros to the Rela promoter was assessed by ChIP-qPCR analysis of RAW264.7 cells 3 hours after treatment with LPS (10 ng/ml). (B) Knockdown of Ikaros (which is encoded by Ikzf1) abolishes LPS-induced Rela expression. RAW264.7 cells were treated with either non-targeting control siRNA or Ikaros-specific siRNA. The amounts of Rela mRNA were evaluated by quantitative PCR analysis of cells stimulated with LPS (10 ng/ml) for the indicated times and were normalized to those of untreated control cells. (C) Analysis of the efficiency of Ikzf1 knockdown by siRNA. (D) RAW264.7 cells were treated with control siRNA or Ikaros-specific siRNA and then were stimulated with the indicated doses of LPS for 2 hours (Ifnb), 4 hours (Ifih1, Il18, Ifit3), or 6 hours (Tnf, Saa3), depending on the induction kinetics of the individual genes analyzed. The amounts of the indicated mRNAs were evaluated by quantitative RT-PCR analysis and were normalized to those of untreated control cells. (E) Western blotting analysis of BMDMs from Ikaros knockout mice confirmed the lack of Ikaros protein. (F) BMDMs from wild-type (Ikzf1+/+ littermate control) and Ikaros-deficient (Ikzf1−/−) mice were left untreated or were treated with a low (0.1 ng/ml) or high (10 ng/ml) dose of LPS for the indicated times. Samples were then analyzed by Western blotting with antibodies specific for RelA and RhoGDI, which was used as a loading control. Blots are representative of three independent experiments. (G) Quantification of RelA protein amounts (normalized to those of RhoGDI) from three independent Western blotting experiments, one of which is shown in (F). Data are means ± SD. (H) BMDMs derived from wild-type (Ikzf1+/+ littermate control) or Ikaros knockout (Ikzf1−/−) mice were stimulated with low-dose (0.1 ng/ml) or high-dose (10 ng/ml) LPS for 4 hours. The abundances of Tnf, Ifnb, Ifih1, Il18, and Ifit3 mRNAs were evaluated by quantitative PCR analysis and were normalized to those in untreated BMDMs from wild-type mice. All quantitative RT-PCR data are from replicate experiments. Data are means ± SD.
We found that Ikaros protein is present in unstimulated macrophages (Fig. 6E and fig. S10D). This basal abundance appears to be important for the regulation of macrophage gene expression, as evident from the effects of knockdown of Ikaros on transcription in cells treated with a low dose of LPS (Fig. 6D). Both the basal and induced expressions of Ikaros might play roles in the LPS dose–dependent activation of Rela (fig. S10E). Basal amounts of Ikaros did not support Rela induction in response to a low dose of LPS, possibly because the lower nuclear occupancy of NF-κB might not support the amplitude or the duration of NF-κB activity that is necessary for cooperation with Ikaros on target sites. Examination of the cooperation between Ikaros and NF-κB in innate immune cells will be an important topic for further investigation.
Discussion
The NF-κB signaling network has been a paradigm for a broadly conserved cellular signaling pathway model involving transcription factor activation, induction of gene transcription, and negative feedback regulation. The generation of knockout mice for each of the components of the NF-κB family, and the consequent availability of fibroblast cell lines from single and combined knockout animals has fueled the generation of mathematical models of stimulus-dependent NF-κB activation dynamics (27). Subsequent single-cell analyses of NF-κB dynamics have led to a model of oscillatory behavior at the single-cell level (6, 7, 14). Studies with fibroblasts and neuroblasts have suggested a digital NF-κB activation phenomenon in which increasing fractions of cells in a population respond stochastically to increasing concentrations of cytokines (14, 28).
Despite the central role played by the NF-κB system in the function of almost all hematopoietic cell lineages, we are not aware of any single-cell studies describing NF-κB activation dynamics in live immune cells responding to an immune challenge. With a dual-reporter system in a macrophage cell line, we characterized live-cell, LPS-induced NF-κB dynamics and their correlation with inflammatory cytokine gene output at the single-cell level. We found that individual macrophages exhibit analog responses to different doses of LPS, in contrast to the digital responses previously observed in cytokine-treated non-immune cells (14, 28). The coupled transcriptional read-out in our reporter cells enabled us to determine which characteristics of the analog NF-κB dynamics are predictive of TNF-α synthesis in macrophages, a hallmark of numerous inflammatory and malignant diseases (29). Unexpectedly, TNF-α output was poorly correlated with NF-κB dynamics when the latter were calculated in terms of the ratio of nuclear NF-κB abundance to total NF-κB abundance, or with single-time snapshot measurements of NF-κB activation. Rather, the key determinant of the macrophage transcriptional response was identified by an unbiased regression analysis to be the nuclear occupancy of NF-κB integrated over the entire time-course of a pathogenic stimulation.
Sustained nuclear occupancy of NF-κB occurred only with higher doses of LPS, and was not a result of insufficient negative feedback, but, surprisingly, through the induction of Rela expression. The self-amplification of NF-κB that we describe is a previously uncharacterized positive feedback loop that may be relevant in other immune cells. Mathematical modeling suggested an unknown event elicited specifically by a high dose of LPS that activates the positive feedback. Through a combination of data from genome-wide siRNA screening and transcriptional profiling, we identified Ikaros, a transcription factor known for promoting lymphoid cell development (30) but not previously implicated in innate immune responses, as a relevant factor. We found that Ikaros is critical for both the RelA positive feedback mechanism and for a robust macrophage response to LPS. It is notable that a non-NF-κB component, Ikaros, drives the re-wiring of the NF-κB network, which suggests its potential as a therapeutic target that has less pleiotropic effects for inflammatory diseases compared to steroids or NF-κB inhibitors.
The RelA positive feedback loop is engaged at a distinct dose of LPS and becomes dominant over the multiple negative feedback loops in NF-κB signaling. This NF-κB “feedback dominance switching” provides a mechanism for the robust discrimination of ligand doses, despite the limited information-coding capacity of signaling networks (31). Such discrimination ensures a full anti-bacterial macrophage response only against critical doses of LPS (Fig. 7). It will be interesting in the future to examine which features of the signaling dynamics are shared across different sources of LPS (32) and other TLR ligands. Analog information processing and feedback dominance switching may also be important in other cell types that require accurate single-cell-level decision-making to mount functional responses to specific signals.
Fig. 7. Switching of feedback dominance enables macrophages to discriminate between different doses of LPS.
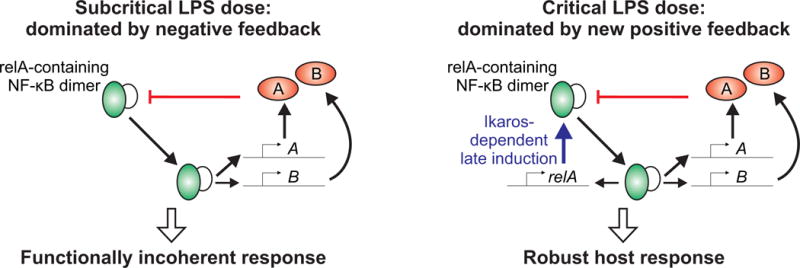
Models illustrate how the re-wiring of the NF-κB regulatory circuit at a critical dose of LPS is proposed to elicit a full innate immune response. Below a critical dose of LPS, the induction of genes that effect predominantly negative feedback and genes with conflicting functional consequences prevents a coherent response in macrophages. Above a critical dose of LPS, Ikaros-dependent amplification of NF-κB becomes a dominant feedback loop, which overcomes the various negative feedback loops and promotes a full-blown innate immune response.
Materials and Methods
Generation of the dual reporter cell line
The lentiviral construct pFUW-p65P-GFPp65, containing the Rela promoter driving the expression of EGFP-RelA, was generously provided by Markus Covert (Stanford University). The plasmid pcDNA3-mTNFaP-mCherry-PEST, containing the murine Tnf promoter (−1229 to −27) driving the expression of mCherry fused to a destabilizing PEST sequence, was generously provided by Catherine Branda (Sandia National Laboratory). A fragment containing the Tnf promoter-mCherry-PEST cassette and a bovine growth hormone (BGH) polyA sequence was excised from pcDNA3-mTNFaP-mCherry-PEST with Bam HI and Sph I, treated with T4 DNA polymerase, and inserted into the pFUW-p65p-GFPp65 plasmid at the Pac I site. Recombinants were screened for the reverse orientation of the TNF-α promoter-mCherry-PEST-polyA cassette relative to the Rela expression cassette (fig. S1). Lentiviral particles were generated and used to infect RAW264.7 cells as previously described (33). Infected cells were cultured for five days and then were sorted for GFP-containing (GFP+) cells. Single-cell clones were expanded in number and screened for consistent nuclear translocation of EGFP-RelA and increases in mCherry abundance in response to LPS (10 ng/ml) through live cell assays. A single clone (G9) was chosen for all subsequent experiments.
Cell culture
RAW264.7 EGFP-RelA cells were maintained according to AfCS protocol PP00000159 (http://www.signaling-gateway.org/data/ProtocolLinks.html) in Dulbecco’s Modified Eagle’s Medium (DMEM) medium containing 10% (v/v) fetal bovine serum (FBS), glucose (4.5 g/l), and 10 mM Hepes at 37°C and 5% CO2. For each assay, cells were subjected to a pre-incubation in Hank’s balanced salt solution (HBSS) medium containing 2% FBS (v/v) at 37°C and 5% CO2 for at least 2 hours before the application of LPS (Alexis Biochemicals; Salmonella minnesota R595 TLRgrade, ALX-581-008-L002) or Kdo2-LipidA (Avanti Polar Lipids; 699500P). Only those cells from passages 5 to 20 were used for assays. Bone marrow–derived macrophages (BMDMs) were isolated from C57BL/6 mice or from Ikzf1−/− mice (26) and were cultured according to AfCS protocol PP00000172. All animal procedures were performed under IACUC guidelines and approved NIAID, NIH Animal Care and Use Committee study protocols.
Western blotting
A CelLytic M lysis buffer (Sigma) supplemented with proteinase inhibitor cocktail (Sigma) was used to extract total protein from RAW264.7 cells (200 μl lysis buffer for approximately 2 × 10⁵ cells). BMDM protein lysates were prepared with RIPA buffer (Sigma; R0278) containing proteinase and phosphatase inhibitor cocktail (Roche) (80 μl lysis buffer for approximately 1 × 10⁶ cells). Samples (10 μg of protein for RAW264.7 cells, 25 μg for BMDMs) were denatured with a 4× LDS sampling buffer (Invitrogen) at 70°C for 10 min, resolved by SDS-polyacrylamide gel electrophoresis (SDS-PAGE) with a 4 to 12% Bis-Tris gel/MOPS running buffer system, and then analyzed by Western blotting according to a standard protocol. The antibodies and dilutions used are as follows: rabbit polyclonal anti-RelA antibody (Abcam, 1:20000), rabbit polyclonal anti-GAPDH antibody (Sigma, 1:20000), horseradish peroxidase (HRP)-conjugated goat anti-rabbit antibody (Jackson ImmunoResearch, 1:10000), mouse anti-RhoGDI antibody (BD Biosciences, 1:200000), and HRP-conjugated donkey anti-mouse antibody (GE, 1:10000).
Quantitative RT-PCR analysis
Total RNA was isolated from approximately 6.4 × 10⁵ cells with an RNAeasy Mini Kit (Qiagen). Quantitative RT-PCR analyses were performed with the iScript cDNA kit (Bio-RAD) and Solaris qPCR gene-specific probe sets and master mix (Thermo Fisher) with a Mastercycler realplex4 real-time PCR detection system (Eppendorf), according to the manufacturers’ protocols. The abundances of the mRNAs of interest in each sample were normalized to that of β-actin mRNA, and fold-changes in target mRNAs relative to their basal abundances were calculated by the 2−ΔΔCt method.
ChIP-qPCR
Chromatin was isolated from approximately 2 × 10⁷ cells and then processed as follows. The lysis buffer to shear the chromatin contained 1% SDS, 10 mM EDTA (pH 8), 50 mM Tris-HCl (pH 8), and proteinase inhibitor cocktail. Sonication was performed to shear the chromatin to generate DNA fragments with a size range of 400 to 500 bp. The sheared chromatin samples were diluted 1:10 in dilution buffer [0.01% SDS, 1.1% Triton-X, 1.2 mM EDTA (pH 8), 16.68 mM Tris-HCl (pH 8), 167 mM NaCl, and proteinase inhibitor cocktail] and stored at −80°C until required for use. For each ChIP, 500 μg (DNA) of chromatin and 10 μl of a rabbit polyclonal anti-RelA antibody (Abcam) or a goat polyclonal anti-Ikaros antibody (Santa Cruz) were used. The ChIP products were subjected to quantitative PCR analysis with an IQ SYBR GREEN supermix and a MyIQ single-color, real-time PCR detection system (BioRad) according to the manufacturers’ instructions. DNA mixtures (0.4 μg each) purified from aliquots of each chromatin sample were also subjected to quantitative PCR analysis as input samples, and the results were presented as the ChIP-qPCR measurements normalized to their respective input measurements. The following primers were used for RelA ChIP-qPCR analysis: Rela forward: gtgggaggggcgtaactatt; Rela reverse: ccactatgccagaaggagga; Rela amplicon: chromosome 19, 5636663-5636846; Tnf forward: cttggaggaagtggctgaag; Tnf reverse: gctgagttcattccctctgg; Tnf amplicon: chr 17, 35339476-35339598. The following primers were used for Ikaros ChIP-qPCR: Rela forward: ctcatggctctcagggactc; Rela reverse: acgttttcctaagcgtgcag; Rela amplicon: ch19, 5637090-5637282. The negative controls for both the RelA and Ikaros ChIP-qPCR assays were as follows: forward: aggcctgcactaccaaacac; reverse: taatgcccttgcagaagacc; amplicon: chr 19, 5636066-5636245. Genomic coordinates of amplicons are in basepairs from the reference genome mm9.
Microarray analysis
BMDMs were treated with LPS (0, 0.1, or 10 ng/ml) for 4 hours. Total RNA was isolated from approximately 1 × 10⁶ cells for each condition with an RNAeasy Mini Kit (Qiagen). Each condition was represented by duplicate biological samples. Amplification and labeling of cRNA were performed with the Illumina TotalPrep RNA Amplification Kit (Invitrogen), and the cRNAs were hybridized to Illumina MouseRef-8 microarrays according to the manufacturer’s instructions. Raw log2 intensity values were quantile-normalized for subsequent analyses. Gene-specific variability was calculated as the standard deviation (SD) of expression values from the unstimulated samples. The 738 high-dose LPS–specific genes were obtained from the 917 microarray probes whose expression increased by more than three-fold the SD from the high dose of LPS, but by less than two-fold the SD from the low dose of LPS. The 244 dose-independent genes were from the 314 microarray probes whose expression increased by more than two-fold the SD from both the high and low doses of LPS. Heat maps were generated to visualize the probe expression values that were obtained by subtracting the probe-specific duplicate average from unstimulated samples and then by dividing by the SD of the probe. Gene ontology (GO) analysis was performed with the genome version NCBI 37 and custom R scripts. NF-κB feedback genes were retrieved by selecting for the GO terms “positive regulation of NF-kappaB” and “negative regulation of NF-kappaB”, excluding those genes with both GO terms and those genes that encode secreted factors that have indirect autocrine effects.
Time-lapse microscopy
Live imaging of RAW264.7 cells expressing EGFP-p65 and mCherry was performed with a Zeiss LSM 5 Live microscope with an enclosed incubation system in which cells were stably maintained in a humidified atmosphere at 37°C and 5% CO2. Time-lapse images were acquired at 8-min intervals with two sequential frames for EGFP and mCherry signals for each stage position with 1.2% of the laser power at 489 nm and 2.4% of the laser power at 561 nm, a 63× Plan-Apochromat oil objective (1.4 NA), no zoom, and 495 to 555 nm band pass and 580 nm long pass filters for EGFP and mCherry, respectively. The pinhole was maximally open, and focus was automatically corrected before each time point by a customized Zeiss Multitime autofocus macro. LPS was added before the second time point by a gentle injection through tubing to achieve the desired final concentration. Acquired LSM files were exported as 16-bit TIFF files for further analysis.
Image quantification and time series analysis
16-bit image files were segmented, quantified, and tracked with a custom-written MATLAB program that uses its Image Processing toolbox. In each time lapse field, we excluded from analysis the cells that moved out of view or focus, died, overlapped with other cells, or divided during the time course. Cell boundaries were identified first automatically by intensity-thresholding and then by manual correction. Nuclear boundaries were all manually defined. The same cells were tracked from the previous time point by finding cells with the closest cell centroids. Background intensities, estimated for each time point and stage position, were subtracted from all intensity values. We analyzed about 210 cells, typically tracked for 170 time points, from roughly 35,000 nuclear segmentations in total, sampling all of the conditions (LPS doses and replicates). Quantitative features of the EGFP-RelA temporal profiles were calculated as follows. The nuclear occupancy of RelA is the area under the nuclear EGFP intensity curve and above the initial intensity at t = 0. The time to first peak and the duration of the first phase were determined with the nuclear:total EGFP-RelA ratio curve rather than the nuclear intensity, because the nuclear intensity did not decrease appreciably at the end of the first phase in some cells treated with a high dose of LPS. The duration is defined as the difference between the end and the start time points of the first phase, which started when the ratio of nuclear to total EGFP-RelA began to increase, and ended when the ratio fell below 1. The time to peak is defined as the moment when the slope of the curve of the ratio of nuclear to total EGFP-RelA was zero over the time window (after the start of the first phase) where the ratio was greater than 1. For the small number of cells with atypical temporal profiles that did not permit such systematic identification, the last time point was assigned to be the end of the first phase, and the time to peak was the end of the first phase. The peak height is the maximal fluorescence intensity of nuclear EGFP during the first phase detected, as described earlier. The average RelA induction shown in Fig. 2H was calculated by [gfp(last time point)-gfp(first time point)]/(time lapse duration) where gfp is the mean cellular intensity of EGFP-RelA. All computations were automated with a program written in MATLAB. The synthesis rate of mCherry [S(t)] was inferred from the mCherry intensity profile C(t) by assuming a half-life of ~1 hour for mCherry-PEST (34) in the equation: d/dt C(t) = S(t) – ((log 2)/T) ∙ C(t). Then, S(t) ≈ d/dt C(t) + 0.016 C(t) (a.u./min). Practically, S(t) and C(t) track each other quite closely, albeit in different scales, because of the short half-life imposed by PEST (fig. S2A). The PEST sequence is a faster degradation variant containing the mutations E428A, E430A, and E431A within the original PEST used in a destabilized EGFP (34). “Total reporter synthesis” is defined as the area under the curve of the synthesis rate of mCherry.
Partial least squares regression
Single-cell time series data from all doses of LPS were pooled for a partial least squares regression analysis with the function “plsregress” in MATLAB. Eight kinetic variables were calculated for each time series: (i) area under the nuc:total ratio curve; (ii) RelA nuclear occupancy; (iii) magnitude of the first peak in the nuc:total ratio curve; (iv) magnitude of the first peak in RelA nuclear intensity; (v) duration of the first peak; (vi) time to reach the first peak; (vii) maximal induction rate of RelA intensity; (viii) average RelA induction. The total mCherry synthesis was the dependent variable for the regression. Because one or two components were sufficient for predicting the mCherry output, the final regression was performed with two components, and the contributions of the kinetic variables described earlier were computed.
Mathematical modeling
The 14-variable, 23-parameter delay differential equations model was constructed by expanding the core NF-κB network from a previous model that was based on TNF-α–induced dynamics in single mouse embryonic fibroblasts (MEFs) (7). We added variables and reactions specific to LPS signaling in macrophages, and then modified key system parameters to produce time-course profiles that were similar to the quantified live-cell data. Below, we describe these revisions to the model; see Supplementary File 1 for a full model specification (MATLAB M file). Briefly, the 9-variable, 18-parameter equations in our previous report (7) represent the conserved minimal regulatory module containing NF-κB, IκBα, IKK, and their protein-protein interactions, kinase activities, degradation, inducible synthesis of IκBα, and nucleocytoplasmic shuttling. Despite extensive parameter variations, none of the eight temporal patterns generated by this model resemble the LPS-induced dynamics seen in macrophages. This indicated that the simple model was insufficient to explain the current data, and that major modifications were necessary. Modeling LPS signaling upstream of IKK is challenging because of a lack of quantitative data on the temporal profile of the kinase activity in this context. Therefore, we incorporated the best-understood TLR4 adaptor pathways, MyD88 and TRIF, which are activated at different times after treatment with LPS (13, 35). The rate of IKK activation after LPS stimulation at t = 0 has two corresponding components: a sharp Gaussian (σ = 5 min) at t = 0 from the MyD88 signal, and a slower, delayed Gaussian (σ = 20 min) at t = 80 min from the TRIF signal. The values were calibrated to achieve a qualitative agreement with the imaging data. We did not include the TNF-α autocrine feedback that was observed to have a role in LPS signaling in fibroblasts (13), because the RAW264.7 cells do not respond to physiologically relevant concentrations (expected from local secretion) of TNF-α, indicating that LPS signaling does not rely on the TNF-α autocrine loop in macrophages. Instead, the rationale for the delayed TRIF signal is to represent the intracellular trafficking of TLR4 and its subsequent endosomal signaling (36, 37). The variation of the LPS doses is reflected in the common multiplicative constant applied to the two components (see Fig. 4C, “LPS dose”). We also added IκBε (and all the cytoplasmic and nuclear molecular species that contain it) to moderate the oscillatory tendency promoted by IκBα. The induced synthesis of IκBε is introduced with an explicit time delay τ2 (50 min) (8, 9). The increase in the abundance of RelA that was observed late for high doses of LPS is included as a term that depends on both the concentration of free nuclear NF-κB (with the time delay τ2) and the magnitude of prior IKK activity (with the time delay τ3). Because we do not understand the factors responsible for this newly discovered feedback, we hypothesized a situation in which a gene encoding a transcription factor X is induced by a strong early IKK activity, X cooperates with NF-κB at regulatory elements of Rela to activate its transcription, and then the RelA protein is synthesized with the time delay τ2. This way, we minimized the number of new variables and unknown parameters. Table S1 describes all of the processes that are represented in the model and the reference values for the corresponding kinetic parameters. All of the values are from our previous model (7), except for the LPS- and macrophage-specific modifications noted. The modified or newly introduced values were estimated arbitrarily so that the LPS response profiles were qualitatively similar to those observed by imaging. The absence of the RelA positive feedback for Fig. 4 was implemented by setting srel = 0. The variability in the time series seen within each plot in Fig. 4B was generated by varying the relative strengths of key negative feedback parameters (s, neg) with multiplicative constants: ½, 1, 2. These are the two parameters previously identified to have the largest effect on temporal profiles (7). For Fig. 4C, the values of s and neg were fixed at ½ of the reference values, and srel was varied ½-, 1-, 2-fold from the reference value to assess the effect of varying the strength of the positive feedback. The use of other values for s and neg did not change the pattern over the range of LPS doses, but reduced the absolute range of RelA nuclear occupancy. Computational simulations of hysteresis were performed as follows. First, we fixed the parameter set that best matched the observed single-cell time lapse data. Ten values for LPS doses were sampled in the log scale between 1% and 100% of the maximal dose. For part “b” of the hysteresis curve, the first stimulation with the maximal LPS dose was simulated for 8 hours followed by a reset to zero signal (corresponding to wash), and the second stimulation with one of the lower dose values for another 8 hours. Part “a” of the hysteresis curve was similarly computed by simulating the first stimulation with a lowest dose (1% of maximal) for 8 hours, followed by a reset to zero signal and the second stimulation with one of the higher dose values for another 8 hours. These simulations were implemented by two successive runs of “dde23” in MATLAB with the solution of the first run provided as the history for the second run.
Supplementary Material
Acknowledgments
We thank T. Karpova for technical support with microscopes; S. Kwon, D. Echikson, and L. Lee for help with image quantification; K. Georgopoulos and S. Winandy for help in obtaining Ikzf1 knockout mice; and E. Batchelor, D. Larson, and R. Germain for helpful comments on the manuscript.
Funding: This work was supported by the Intramural Research Program of NCI and NIAID at the National Institutes of Health.
Footnotes
Author contributions: M.H.S., G.L.H., and I.D.C.F. designed the study; N.L. generated and characterized the reporter cell clone, performed siRNA screening, microarrays, quantitative RT-PCR, and Western blotting analyses; M.H.S. performed microscopy, image analysis, microarray statistical analysis, and mathematical modeling; Q.L. performed quantitative RT-PCR, Western blotting, and ChIP analyses; N.L. and R.A.G. performed analyses of primary macrophages from wild-type and mutant mice; M.H.S. and I.D.C.F. wrote the paper; and all authors commented on the manuscript.
Competing interests: The authors declare that they have no competing interests.
Data and materials availability: Raw data and reagents are available upon request.
References and Notes
- 1.Banerjee A, Gerondakis S. Coordinating TLR-activated signaling pathways in cells of the immune system. Immunol Cell Biol. 2007;85:420–424. doi: 10.1038/sj.icb.7100098. [DOI] [PubMed] [Google Scholar]
- 2.Medzhitov R. Recognition of microorganisms and activation of the immune response. Nature. 2007;449:819–826. doi: 10.1038/nature06246. [DOI] [PubMed] [Google Scholar]
- 3.Monie TP, Bryant CE, Gay NJ. Activating immunity: lessons from the TLRs and NLRs. Trends Biochem Sci. 2009;34:553–561. doi: 10.1016/j.tibs.2009.06.011. [DOI] [PubMed] [Google Scholar]
- 4.Smale ST. Selective transcription in response to an inflammatory stimulus. Cell. 2010;140:833–844. doi: 10.1016/j.cell.2010.01.037. [DOI] [PMC free article] [PubMed] [Google Scholar]
- 5.O’Dea E, Hoffmann A. The regulatory logic of the NF-kappaB signaling system. Cold Spring Harb Perspect Biol. 2010;2:a000216. doi: 10.1101/cshperspect.a000216. [DOI] [PMC free article] [PubMed] [Google Scholar]
- 6.Nelson DE, Ihekwaba AE, Elliott M, Johnson JR, Gibney CA, Foreman BE, Nelson G, See V, Horton CA, Spiller DG, Edwards SW, McDowell HP, Unitt JF, Sullivan E, Grimley R, Benson N, Broomhead D, Kell DB, White MR. Oscillations in NF-kappaB signaling control the dynamics of gene expression. Science. 2004;306:704–708. doi: 10.1126/science.1099962. [DOI] [PubMed] [Google Scholar]
- 7.Sung MH, Salvatore L, De Lorenzi R, Indrawan A, Pasparakis M, Hager GL, Bianchi ME, Agresti A. Sustained oscillations of NF-kappaB produce distinct genome scanning and gene expression profiles. PLoS One. 2009;4:e7163. doi: 10.1371/journal.pone.0007163. [DOI] [PMC free article] [PubMed] [Google Scholar]
- 8.Kearns JD, Basak S, Werner SL, Huang CS, Hoffmann A. IkappaBepsilon provides negative feedback to control NF-kappaB oscillations, signaling dynamics, and inflammatory gene expression. J Cell Biol. 2006;173:659–664. doi: 10.1083/jcb.200510155. [DOI] [PMC free article] [PubMed] [Google Scholar]
- 9.Paszek P, Ryan S, Ashall L, Sillitoe K, Harper CV, Spiller DG, Rand DA, White MR. Population robustness arising from cellular heterogeneity. Proc Natl Acad Sci U S A. 2010;107:11644–11649. doi: 10.1073/pnas.0913798107. [DOI] [PMC free article] [PubMed] [Google Scholar]
- 10.Werner SL, Kearns JD, Zadorozhnaya V, Lynch C, O’Dea E, Boldin MP, Ma A, Baltimore D, Hoffmann A. Encoding NF-kappaB temporal control in response to TNF: distinct roles for the negative regulators IkappaBalpha and A20. Genes Dev. 2008;22:2093–2101. doi: 10.1101/gad.1680708. [DOI] [PMC free article] [PubMed] [Google Scholar]
- 11.Ashall L, Horton CA, Nelson DE, Paszek P, Harper CV, Sillitoe K, Ryan S, Spiller DG, Unitt JF, Broomhead DS, Kell DB, Rand DA, See V, White MR. Pulsatile stimulation determines timing and specificity of NF-kappaB-dependent transcription. Science. 2009;324:242–246. doi: 10.1126/science.1164860. [DOI] [PMC free article] [PubMed] [Google Scholar]
- 12.Bartfeld S, Hess S, Bauer B, Machuy N, Ogilvie LA, Schuchhardt J, Meyer TF. High-throughput and single-cell imaging of NF-kappaB oscillations using monoclonal cell lines. BMC Cell Biol. 2010;11:21. doi: 10.1186/1471-2121-11-21. [DOI] [PMC free article] [PubMed] [Google Scholar]
- 13.Lee TK, Denny EM, Sanghvi JC, Gaston JE, Maynard ND, Hughey JJ, Covert MW. A noisy paracrine signal determines the cellular NF-kappaB response to lipopolysaccharide. Sci Signal. 2009;2:ra65. doi: 10.1126/scisignal.2000599. [DOI] [PMC free article] [PubMed] [Google Scholar]
- 14.Tay S, Hughey JJ, Lee TK, Lipniacki T, Quake SR, Covert MW. Single-cell NF-kappaB dynamics reveal digital activation and analogue information processing. Nature. 2010;466:267–271. doi: 10.1038/nature09145. [DOI] [PMC free article] [PubMed] [Google Scholar]
- 15.Rand U, Rinas M, Schwerk J, Nohren G, Linnes M, Kroger A, Flossdorf M, Kaly-Kullai K, Hauser H, Hofer T, Koster M. Multi-layered stochasticity and paracrine signal propagation shape the type-I interferon response. Mol Syst Biol. 2012;8:584. doi: 10.1038/msb.2012.17. [DOI] [PMC free article] [PubMed] [Google Scholar]
- 16.Ozbudak EM, Thattai M, Kurtser I, Grossman AD, van Oudenaarden A. Regulation of noise in the expression of a single gene. Nat Genet. 2002;31:69–73. doi: 10.1038/ng869. [DOI] [PubMed] [Google Scholar]
- 17.Raser JM, O’Shea EK. Noise in gene expression: origins, consequences, and control. Science. 2005;309:2010–2013. doi: 10.1126/science.1105891. [DOI] [PMC free article] [PubMed] [Google Scholar]
- 18.Litvak V, Ramsey SA, Rust AG, Zak DE, Kennedy KA, Lampano AE, Nykter M, Shmulevich I, Aderem A. Function of C/EBPdelta in a regulatory circuit that discriminates between transient and persistent TLR4-induced signals. Nat Immunol. 2009;10:437–443. doi: 10.1038/ni.1721. [DOI] [PMC free article] [PubMed] [Google Scholar]
- 19.Rao P, Hayden MS, Long M, Scott ML, West AP, Zhang D, Oeckinghaus A, Lynch C, Hoffmann A, Baltimore D, Ghosh S. IkappaBbeta acts to inhibit and activate gene expression during the inflammatory response. Nature. 2010;466:1115–1119. doi: 10.1038/nature09283. [DOI] [PMC free article] [PubMed] [Google Scholar]
- 20.Barish GD, Yu RT, Karunasiri M, Ocampo CB, Dixon J, Benner C, Dent AL, Tangirala RK, Evans RM. Bcl-6 and NF-kappaB cistromes mediate opposing regulation of the innate immune response. Genes Dev. 2010;24:2760–2765. doi: 10.1101/gad.1998010. [DOI] [PMC free article] [PubMed] [Google Scholar]
- 21.Doyle S, Vaidya S, O’Connell R, Dadgostar H, Dempsey P, Wu T, Rao G, Sun R, Haberland M, Modlin R, Cheng G. IRF3 mediates a TLR3/TLR4-specific antiviral gene program. Immunity. 2002;17:251–263. doi: 10.1016/s1074-7613(02)00390-4. [DOI] [PubMed] [Google Scholar]
- 22.Gilchrist M, Thorsson V, Li B, Rust AG, Korb M, Roach JC, Kennedy K, Hai T, Bolouri H, Aderem A. Systems biology approaches identify ATF3 as a negative regulator of Toll-like receptor 4. Nature. 2006;441:173–178. doi: 10.1038/nature04768. [DOI] [PubMed] [Google Scholar]
- 23.Garber M, Yosef N, Goren A, Raychowdhury R, Thielke A, Guttman M, Robinson J, Minie B, Chevrier N, Itzhaki Z, Blecher-Gonen R, Bornstein C, Amann-Zalcenstein D, Weiner A, Friedrich D, Meldrim J, Ram O, Cheng C, Gnirke A, Fisher S, Friedman N, Wong B, Bernstein BE, Nusbaum C, Hacohen N, Regev A, Amit I. A high-throughput chromatin immunoprecipitation approach reveals principles of dynamic gene regulation in mammals. Molecular cell. 2012;47:810–822. doi: 10.1016/j.molcel.2012.07.030. [DOI] [PMC free article] [PubMed] [Google Scholar]
- 24.Wall EA, Zavzavadjian JR, Chang MS, Randhawa B, Zhu X, Hsueh RC, Liu J, Driver A, Bao XR, Sternweis PC, Simon MI, Fraser ID. Suppression of LPS-induced TNF-alpha production in macrophages by cAMP is mediated by PKA-AKAP95-p105. Sci Signal. 2009;2:ra28. doi: 10.1126/scisignal.2000202. [DOI] [PMC free article] [PubMed] [Google Scholar]
- 25.Escoubet-Lozach L, Benner C, Kaikkonen MU, Lozach J, Heinz S, Spann NJ, Crotti A, Stender J, Ghisletti S, Reichart D, Cheng CS, Luna R, Ludka C, Sasik R, Garcia-Bassets I, Hoffmann A, Subramaniam S, Hardiman G, Rosenfeld MG, Glass CK. Mechanisms establishing TLR4-responsive activation states of inflammatory response genes. PLoS Genet. 2011;7:e1002401. doi: 10.1371/journal.pgen.1002401. [DOI] [PMC free article] [PubMed] [Google Scholar]
- 26.Wang JH, Nichogiannopoulou A, Wu L, Sun L, Sharpe AH, Bigby M, Georgopoulos K. Selective defects in the development of the fetal and adult lymphoid system in mice with an Ikaros null mutation. Immunity. 1996;5:537–549. doi: 10.1016/s1074-7613(00)80269-1. [DOI] [PubMed] [Google Scholar]
- 27.Hoffmann A, Levchenko A, Scott ML, Baltimore D. The IkappaB-NF-kappaB signaling module: temporal control and selective gene activation. Science. 2002;298:1241–1245. doi: 10.1126/science.1071914. [DOI] [PubMed] [Google Scholar]
- 28.Turner DA, Paszek P, Woodcock DJ, Nelson DE, Horton CA, Wang Y, Spiller DG, Rand DA, White MR, Harper CV. Physiological levels of TNFalpha stimulation induce stochastic dynamics of NF-kappaB responses in single living cells. Journal of cell science. 2010;123:2834–2843. doi: 10.1242/jcs.069641. [DOI] [PMC free article] [PubMed] [Google Scholar]
- 29.Coussens LM, Werb Z. Inflammation and cancer. Nature. 2002;420:860–867. doi: 10.1038/nature01322. [DOI] [PMC free article] [PubMed] [Google Scholar]
- 30.Yoshida T, Ng SY, Georgopoulos K. Awakening lineage potential by Ikaros-mediated transcriptional priming. Curr Opin Immunol. 2010;22:154–160. doi: 10.1016/j.coi.2010.02.011. [DOI] [PMC free article] [PubMed] [Google Scholar]
- 31.Cheong R, Rhee A, Wang CJ, Nemenman I, Levchenko A. Information transduction capacity of noisy biochemical signaling networks. Science. 2011;334:354–358. doi: 10.1126/science.1204553. [DOI] [PMC free article] [PubMed] [Google Scholar]
- 32.Gutschow MV, Hughey JJ, Ruggero NA, Bajar BT, Valle SD, Covert MW. Single-cell and population NF-kappaB dynamic responses depend on lipopolysaccharide preparation. PLoS One. 2013;8:e53222. doi: 10.1371/journal.pone.0053222. [DOI] [PMC free article] [PubMed] [Google Scholar]
- 33.Fraser I, Liu W, Rebres R, Roach T, Zavzavadjian J, Santat L, Liu J, Wall E, Mumby M. The use of RNA interference to analyze protein phosphatase function in mammalian cells. Methods Mol Biol. 2007;365:261–286. doi: 10.1385/1-59745-267-X:261. [DOI] [PubMed] [Google Scholar]
- 34.Li X, Zhao X, Fang Y, Jiang X, Duong T, Fan C, Huang CC, Kain SR. Generation of destabilized green fluorescent protein as a transcription reporter. J Biol Chem. 1998;273:34970–34975. doi: 10.1074/jbc.273.52.34970. [DOI] [PubMed] [Google Scholar]
- 35.Covert MW, Leung TH, Gaston JE, Baltimore D. Achieving stability of lipopolysaccharide-induced NF-kappaB activation. Science. 2005;309:1854–1857. doi: 10.1126/science.1112304. [DOI] [PubMed] [Google Scholar]
- 36.Kagan JC, Su T, Horng T, Chow A, Akira S, Medzhitov R. TRAM couples endocytosis of Toll-like receptor 4 to the induction of interferon-beta. Nat Immunol. 2008;9:361–368. doi: 10.1038/ni1569. [DOI] [PMC free article] [PubMed] [Google Scholar]
- 37.Zanoni I, Ostuni R, Marek LR, Barresi S, Barbalat R, Barton GM, Granucci F, Kagan JC. CD14 controls the LPS-induced endocytosis of Toll-like receptor 4. Cell. 2011;147:868–880. doi: 10.1016/j.cell.2011.09.051. [DOI] [PMC free article] [PubMed] [Google Scholar]
Associated Data
This section collects any data citations, data availability statements, or supplementary materials included in this article.