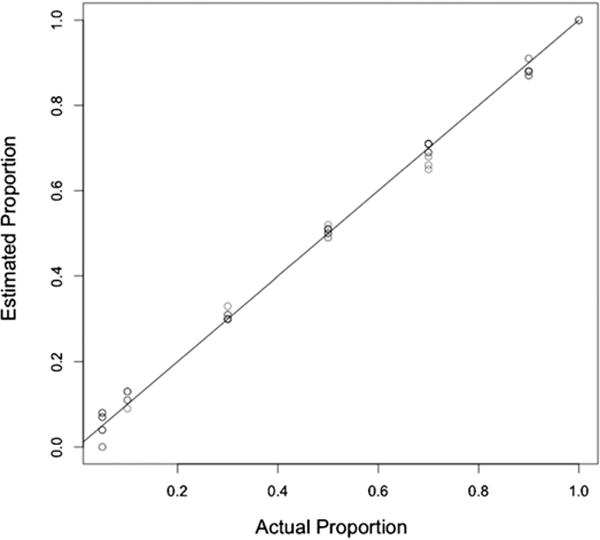
Fig. 2.

Calibration of the two different methods for determining the frequency of alleles at polymorphic loci. The three estimates obtained by pyrosequencing (black symbols) and three obtained by CSA (grey symbols) are plotted for each mixture, along with a 1:1 line illustrating the known frequency.
