

Abstract
Pancreatic ductal adenocarcinoma (PDAC) is characterized by prominent stromal involvement, which plays complex roles in regulating tumor growth and therapeutic response. The extracellular matrix (ECM)-rich PDAC stroma has been implicated as a barrier to drug penetration, though stromal depletion strategies have had mixed clinical success. It remains less clear how interactions with ECM, acting as a biophysical regulator of phenotype, not only a barrier to drug perfusion, regulate susceptibilities and resistance to specific therapies. In this context, an integrative approach is used to evaluate invasive behavior and motility in rheologically-characterized ECM as determinants of chemotherapy and photodynamic therapy (PDT) responses. We show that in 3D cultures with ECM conditions that promote invasive progression, response to PDT is markedly enhanced in the most motile ECM-infiltrating populations while the same cells exhibit chemoresistance. Conversely, drug-resistant sublines with enhanced invasive potential were generated to compare differential treatment response in identical ECM conditions, monitored by particle tracking microrheology measurements of matrix remodeling. In both scenarios, ECM-infiltrating cell populations exhibit increased sensitivity to PDT, whether invasion is consequent to selection of chemoresistance, or whether chemoresistance is correlated with acquisition of invasive behavior. However, while ECM-invading, chemoresistant cells exhibit mesenchymal phenotype, induction of EMT in monolayers without ECM was not sufficient to enhance PDT sensitivity, yet does impart chemoresistance as expected. In addition to containing platform development with broader applicability to inform microenvironment-dependent therapeutics, these results reveal the efficacy of PDT for targeting the most aggressive, chemoresistant, invasive PDAC associated with dismal outcomes for this disease.
Implications
ECM-infiltrating and chemoresistant pancreatic tumor populations exhibit increased sensitivity to photodynamic therapy (PDT).
Keywords: pancreatic cancer, 3D tumor models, microrheology, PDT, tumor microenvironment
Introduction
Tumor growth and invasive progression are determined not only by the biology of the tumor itself, but also by its interaction with components of the microenvironment. The latter encompasses a broad set of factors including immune response, paracrine crosstalk with stromal cells and the intertwined biochemical and biophysical properties of the extracellular matrix (ECM) (1–3). Extracellular rigidity associated with ECM-rich stroma has been shown to promote malignant growth behavior (4–6), and type I collagen itself, a major ECM component in solid tumors, promotes increased epithelial mesenchymal transition (EMT) and invasive behavior (7,8). The role of these interactions is particularly provocative for pancreatic ductal adenocarcinoma (PDAC), a lethal cancer with a median survival of about 6 months (9,10), which is also associated with exceptionally dense fibrotic stroma (11–13).
PDAC stroma has been explicitly linked with its dismal response to chemotherapy, being implicated as a poorly vascularized barrier that physically inhibits drug perfusion (14). The paradigm of stromal depletion has however had mixed results in the clinic, and further investigation revealed that PDAC stroma plays complex roles both promoting and constraining tumor progression (15–17). At the same time, it is unclear how interactions with stroma, as a biophysical regulator of phenotype, not just a barrier to drug delivery, also modulate response to specific therapies. Given that the 5-year survival rate for late-stage PDAC remains at only about 2% (18), there is strong motivation not only to identify new treatments, but also the manner in which prominent stromal involvement impacts upon their efficacy.
Investigation of mechanistically independent treatments for PDAC has motivated the development of photodynamic therapy (PDT), a photochemistry-based modality. In PDT, cancer cells are photosensitized by administration of an exogenous agent, which is activated by an appropriate (usually red) light source to initiate photochemistry resulting in tumor destruction by generating reactive oxygen species (19). Preclinical studies demonstrated PDT efficacy for PDAC and specifically in experiments using the photosensitizer verteporfin that PDT is effective against cells that are non-responsive to gemcitabine (20). While the delivery of light to the pancreas does present a technical challenge to clinical implementation of PDT, a recent study (also using verteporfin) established the clinical efficacy of this approach using an innovative system of interstitial light delivery and dosimetry in patients with locally advanced unresectable disease (21). However, as noted above, there is compelling motivation to elucidate how PDT response in PDAC cells is impacted by ECM properties which in turn influence the characteristically aggressive growth and invasive behavior of this disease.
In this study, we combine an integrative set of cancer biology and biophysical methods to identify how contrasting ECM-dependent growth and motility in PDAC 3D cell cultures leads also to contrasting therapeutic susceptibilities. Motivated by the background above, we specifically examine response to PDT in contrast to chemotherapy in PDAC spheroids transplanted into laminin-rich and collagen I ECM environments with differing physical and biological composition shown in studies with breast cancer models to constrain and promote invasion respectively (22). As shown in the experimental schema (Figure 1), the use of previously established high content imaging for 3D tumor models (23) allows us to co-register treatment response with phenotypic parameters to examine differential response in ECM invading and non-invading populations. Surprisingly, this approach reveals that ECM infiltrating populations, while displaying decreased response to chemotherapy, are markedly more sensitive to PDT, with the most motile leading cells exhibiting the most sensitivity. We corroborate this finding in similar investigation of phenotype-dependent response to PDT and chemotherapy but in matched parent and drug-resistant cells with characterized contrasting invasive potentials in identical ECM environments. In addition to the development of a more broadly applicable platform for quantitatively interrogating microenvironment-dependent therapeutic response, the data also reveals the therapeutically important insight that PDAC populations with increased chemoresistance and invasive/metastatic potential, implicated in the otherwise dismal outcomes for this disease, are also the most responsive to PDT.
Figure 1. Workflow for imaging-based measurements of ECM-dependent growth, motility and therapeutic response, showing.
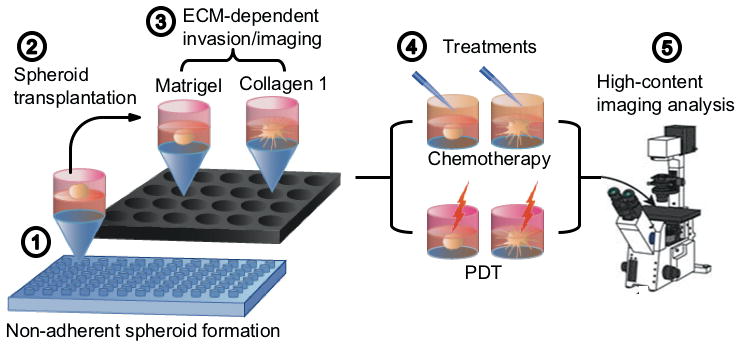
(1) Initial formation of attachment-free spheroids on agarose beds for 12 days; (2) transplantation and embedding of spheroids in rheologically characterized Matrigel or COL1 ECMs; (3) Longitudinal and terminal (immunofluorescence) imaging of growth and ECM invasion; (4) Treatment with chemotherapy (oxaliplatin) or PDT; and (5) Imaging-based assesment of therapeutic response, co-registered with phenotype.
Methods
Cell culture and reagents
PANC1, BxPC3, and MRC5 cell lines were obtained from the American Type Culture Collection (Manassas, VA), and grown in T75 cell culture flasks according to ATCC guidelines. RPMI, DMEM, and MEM (HyClone; Logan, UT) were supplemented with 10% FBS (HyClone; Logan, UT), 100 IU/mL penicillin and 1% streptomycin (HyClone; Logan, UT), and 0.5 μg/mL Amphotericin B (Corning; Corning, NY). Cell lines were passaged a maximum of 25 times before discarding and thawing cryogenically stored stocks.
Growth of adherent 3D cell culture on basement membrane overlays
240 μL of GFR (growth factor reduced) Matrigel (Corning; Corning, NY) was added to each well of a chilled 24-well black-walled plate (ibidi USA Inc.; Madison, WI) and incubated at 37°C for 30 minutes to allow for gelation. After polymerization, the matrigel beds were overlaid with single cell suspensions of specified cell lines at a concentration of 7500 cells/mL in the appropriate media supplemented with 2% Matrigel. Cultures were incubated at 37°C and maintained with regular media changes and visual inspection by microscopy.
Preparation 3D spheroid transplants into contrasting ECM environments
For initial preparation of attachment-free multicellular spheroids, single cell suspensions of 1000 cells/mL were added to the surface of agarose menisci (1% w/v protein electrophoresis grade agarose, Fisher BioReagents, Waltham, MA) formed previously in 96 well plates by dispensing heated agarose (50 μL/well) and allowing to set at room temperature for 30 minutes. After 24 hours, multicellular aggregates were supplemented with complete medium containing 2% Matrigel media. After 12 days (with regular media additions), spheroids were transplanted into chilled 24 well plates containing either Matrigel or 1 mg/mL bovine type I collagen (COL1, Corning; Corning, NY) maintained in solution phase until spheroid was incorporated. Matrigel layers were initially formed as above and COL1 was prepared in 10x MEM (Sigma-Aldrich; St. Louis, MO) and sterile water, adjusted to a neutral pH with NaOH (Fisher Chemical; Pittsburgh, PA). COL1 or Matrigel gels were then set by incubation overnight at 37°C, effectively embedding spheroids. Transplanted spheroids were allowed to grow and invade into respective ECM microenvironments (with 500 μl DMEM/well) for 3 days prior to PDT or chemotherapy interventions.
PDT and chemotherapy treatments
In PDT treated wells, media was replaced with complete medium containing 250 nM verteporfin (benzoporphyrin derivative monoacid ring A, BPD, (Sigma-Aldrich; St. Louis, MO)), replaced with regular media after one hour (or 2.5 hours for embedded spheroids to offset delayed transport/uptake through ECM), prior to irradiation using a 690 nm turn-key laser source (Intense; North Brunswick, NJ). Total light dose ranged from 0.5 to 25 J/cm2 at an irradiance of 100 mW/cm2 at bottom surface of cell culture. For culture groups/spheroids receiving oxaliplatin chemotherapy treatments, oxaliplatin (Selleck Chemical; Houston, TX) was added to the media for each cell type at doses ranging from 0.1 to 500 μM for 48 hours. In all therapeutic studies, treatment conditions were prepared in at least triplicate within each batch including internal controls with sham manipulations. Therapeutic response was assessed following interventions by imaging, MTS colorimetric assay, or by replating for clonogenic survival as discussed below.
Generation of drug-resistant sublines
Increasing concentrations of oxaliplatin and/or gemcitabine (Tocris; Bristol, UK) were added to each cell type in regular media over the course of approximately 25 passages until a stable proliferative phenotype without chemotherapy was observed and maintained following cryopreservation and thawing. Drug resistance was confirmed by comparative dose response and measurement of a statistically significant increase in IC50.
Induction of epithelial-mesenchymal transition
To induce EMT under controlled conditions in monolayer cell cultures, 10 ng/mL human recombinant TGFβ, (Gibco, Thermo-Fisher Scientific; Frederick, MD) in 1% FBS DMEM was added to designated cultures for 48 hours. To induce EMT with fibroblast-conditioned media (FCM), supernatant collected from MRC5 cells grown to confluence in T75 flasks with 8 mL media filtered to 0.2 μm, then added to specified cell cultures for 48 hours.
Therapeutic assessment
For monolayer treatments, viability was assessed via MTS, using the CellTiter 96® AQueous One Solution Cell Proliferation Assay (Promega; Madison, WI) at 490 nm absorbance in a BioTek® Epoch Microplate Spectrophotometer. For treatments of 3D cell cultures, adaptation of an imaging-based methodology previously described was used (23,24). Briefly, this approach consists of image segmentation and quantitative analysis of fluorescence signal from vital dyes calcein AM (ThermoFisher Scientific Molecular Probes; Waltham, MA) and ethidium bromide (Fisher BioReagents; Pittsburgh, PA). As in previous reports, cultures were terminally stained with vital dyes according prior to imaging. Multichannel fluorescence images were then obtained in across all growth and treatment conditions in multiwell plates using an automated Zeiss AxioObserver Z1 microscope (Carl Zeiss Microscopy GmbH; Jena, Germany). In 3D spheroid ECM transplant experiments, the batch image analysis code was adapted to tabulate invading cell positions for each field with respect to position of the primary spheroid (largest segmented object in the same field) and relative live (cleaved calcein) and dead (intercalated ethidium bromide) fluorescence signals to quantify number of live and dead invading cells with respect to invasion distance. In specified experiments, treatment response was corroborated by clonogenic survival, as per established protocol (25).
Immunofluorescence
Formaldehyde-fixed cells in optical-bottom multiwell plates were incubated overnight at 4°C with primary antibodies against E-cadherin and vimentin (Cell Signaling EMT Duplex; Danvers, MA) or with phalloidin (ThermoFisher Scientific Molecular Probes; Waltham, MA) to stain for F-actin. After washing with PBS, cells were incubated for 1 hour with mouse or rabbit Alexa Fluor secondary antibodies (Cell Signaling; Danvers, MA). Cells were mounted with ProLong Gold Antifade reagent containing DAPI (ThermoFisher Scientific Molecular Probes; Waltham, MA) and imaged after 24 hours using the same exposure and fluorescence intensity settings for all treatment groups on an automated Zeiss AxioObserver Z1 or LSM 880 confocal laser scanning microscope. Images were optimized for display in figures using the ImageJ Hi-Lo lookup table or ZEN software for 3D reconstructions. Unedited images were analyzed using custom MATLAB scripts, where fluorescent signal for each protein was normalized to the number of cells based on DAPI-stained nuclei.
Western blotting
Cells were lysed with cold RIPA (Thermo Scientific; Waltham, MA) containing 1x Halt™ protease and phosphatase inhibitors (Thermo Scientific; Waltham, MA). Protein concentration was quantified using the Pierce BCA protein assay (Thermo-Fisher Scientific; Waltham, MA). After SDS-PAGE separation, transfer to nitrocellulose membranes, and blocking, membranes were incubated at 4°C overnight with antibodies against E-cadherin (BD Biosciences; San Jose, CA), vimentin (Sigma-Aldrich; St. Louis, MO), and GAPDH (Cell Signaling; Danvers, MA). After washing, membranes were incubated with HRP-linked rabbit or mouse secondary antibodies (Cell Signaling; Danvers, MA) for one hour. Immobilon® Western HRP Substrate (EMD Millipore; Billerica, MA) was added prior to imaging with the C-DiGit® Blot Scanner (LI-COR; Lincoln, NE). Band density for each protein was normalized to the GAPDH loading control.
Bulk oscillatory shear rheology
For mechanical characterization, ECM preparations identical to those used in cell cultures (volumes of 300 – 400 μL) were pipetted, while ice cold, onto the lower peltier plate (held to 4°C prior to contact with ECM) of a TA Instruments Discovery Hybrid series rheometer. While still in solution phase, a 40 mm parallel plate geometry was brought into contact while examining the sample spreading to achieve optimal filling of the gap. Peltier plate temperature was then regulated to 37°C. After 45 minutes for gelation and equilibration, rheology measurements were performed. An initial oscillatory strain was conducted at low strain values to ensure linear response (both components of G*(ω) independent of applied strain). An appropriate strain value in the linear regime was selected for subsequent dynamic oscillatory shear measurements over a range of 1 < ω < 100 rad/s.
Particle-tracking microrheology (PTMR)
Time-dependent changes in ECM compliance were obtained in normal and drug resistant 3D PDAC cell cultures using a methodology described previously (26). In this approach, the mobility of fluorescent tracer probes embedded in ECM surrounding 3D tumor nodules is analyzed using the Generalized Stokes Einstein Relation (GSER) to estimate local viscoelastic response, G*(ω), of the material. Briefly, for these measurements, 3D cultures were prepared as described above, but incorporating yellow-green fluorescent tracer probes (ThermoFisher Scientific Molecular Probes FluoSpheres; Waltham, MA). Video sequences of 800 frames were obtained using a Zeiss AxioCam HRM camera mounted on a Zeiss AxioObserver Z1 microscope (Carl Zeiss Microscopy GmbH, Jena, Germany). The thermally-driven motion of the probes in each video was analyzed using custom MATLAB routines adapted from open source code of Maria Kilfoil to spatially co-register local rheological properties within 3D cell cultures. Changes in ECM stiffness are reported here as difference in the shear modulus (using the real component, G′(ω) of the complex modulus, at ω =10 rad/s) obtained from ensemble averages of all probe trajectories in all replicates between the noted comparative culture conditions after monitoring for 3 days.
Invasion assay
Invasive potential of cells was also quantified by extent of migration through basement membrane in transwell inserts using established methods (27). Briefly, 50 μL of diluted Matrigel was added to the upper wells of a Corning 24-well transwell plate with an 8 μm pore size membrane. Serum starved cells were added to the transwell over Matrigel beds, and FBS was used as a chemoattractant. After 24 hours, the Matrigel and non-invaded cells were cleaned off the membrane, and invaded cells were formalin-fixed then stained with crystal violet (ThermoFisher Scientific; Waltham, MA) and counted.
Statistical analysis
Two-tailed Student’s t test was used to analyze normally distributed data. Results were considered significant if p <0.05 (*), <0.01 (**), <0.005 (***) or <0.001 (****), and ns is not significant. Error bars indicate SEM in all figures. Figures show representative data of at least 3 independent experiments, unless stated otherwise in figure legends.
Results and Discussion
ECM composition and rigidity regulate PDAC growth, invasion and motility
Prior to treatment studies, we first characterized growth and invasive behavior of PDAC 3D cultures with respect to ECM conditions with contrasting biological and biophysical properties (Figures 1 and 2). We selected reconstituted ECM materials modeling PDAC stroma rich in type I collagen (COL1), shown in previous reports to promote invasive behavior (28,29), contrasted with laminin-rich basement membrane (GFR Matrigel). PANC1 spheroids were initially grown in attachment-free conditions (agarose beds) for 12 days prior to transplantation into either ECM condition. After transplanting, growth behavior in each condition was monitored non-destructively via darkfield microscopy prior to terminal immunofluorescence analysis. For spheroids transplanted into COL1, within 24 hours the outer cells of the spheroid become more invasive and migrate into the ECM, while spheroids embedded in laminin-rich Matrigel do not exhibit significant invasive behavior (Figure 2A) though a budding pattern is consistently observed on spheroid surfaces. Darkfield image data was batch processed based using methods previously described (30) to obtain relative size and position of invading populations and quantify overall extent of invasion by ECM microenvironment. After 3 days, both the total number of invading cells and invasion distance is significantly higher in COL1 (Figure 2B). Spheroids fixed and stained after 3 days of growth in ECM show extensive F-actin staining (Figure 2C), increased vimentin and loss of E-cadherin in invading cells (Figure 2D) in COL1, consistent with a more mesenchymal phenotype in highly motile ECM infiltrating cells. Conversely, cells in centers (Figure 2D, top right) exhibit markedly stronger honeycomb pattern E-cadherin staining characteristic of adherens junctions and epithelial phenotype. The invasive phenotype of PDAC cells observed here in COL1 ECM is consistent with previous reports showing increased EMT and invasion of both PDAC and breast cancer cells in collagen-rich microenvironments (7,22,28).
Figure 2. ECM composition and rigidity regulate PDAC tumor growth and invasive behavior.

(A) Representantive darkfield snapshots of PANC1 spheroids, 1 day following transplatation into COL1 or Matrigel ECM, showing extensive invasion into ECM in the former. (B) Analysis of ECM invasion with respect to radial distance from spheroid edge, after 3 days in each ECM (COL1: n=5; Matrigel: n=10). (C) Terminally fixed/stained COL1 and Matrigel PANC1 spheroids showing DAPI-stained nuclei and phalloidin-labeled F-actin. (D) For COL1 ECM, a representative IF image showing increased mesenchymal markers in ECM infiltrating cells (lower right inset, increased vimentin and decreased E-cadherin) relative to inner spheroid populations with clear adherens junctions (upper right inset). (E) Bulk oscillatory shear rheology shows G′ (storage) and G″ (loss) moduli for both ECM materials used. Matrigel is a significantly stronger gel than the soft reconstituted COL1 used here, also likely contributing to increased motility in the latter.
We further considered that the marked difference in PDAC cell motility in Matrigel and COL1 may be partly attributable to the contrasting mechanical properties of these materials. Identical preparations of both hydrogels as used for 3D cultures were characterized using bulk oscillatory shear rheology (Figure 2E). Both form viscoelastic gels with G′ (storage modulus) dominant over G″ (loss modulus). Though both are soft gels, Matrigel is significantly stiffer with G′ ~ 90 Pa, within the range of previous reports (4,31,32) and roughly 20 times higher than that of the soft (1 mg/mL) COL1 hydrogel used here, which likely creates a more permissive environment for motility of invading cells. The observed differences in phenotype reported above are almost certainly driven by both the biochemical and biophysical properties of the two ECM materials, though future experiments should be designed to isolate these influences using bio-engineered hydrogels with independently tunable rigidity and biochemical properties (33–35). In the following experiments, we use the ECM conditions characterized above as a tool to interrogate how ECM-dependent regulation of phenotype regulates response to PDT and chemotherapy.
ECM infiltrating populations exhibit chemoresistance yet enhanced sensitivity to PDT
In the conditions established above, we examined differential response to PDT and chemotherapy in invading populations and the primary spheroid (Figure 3). We used oxaliplatin, a component of the multi-drug cocktail FOLFIRINOX, which has shown increased effectiveness over the standard gemcitabine treatment for PDAC (36), for chemotherapy treatment. After spheroid transplantation into COL1 or Matrigel, cultures were treated with oxaliplatin chemotherapy or verteporfin PDT using the equivalent monolayer LD90 dose for each modality as a basis for comparison across therapies and growth conditions (Figure 3B, arrow). As shown in Figure 3 (A and C), oxaliplatin chemotherapy inhibits the growth of the primary spheroid to a greater extent than the equivalent PDT dose. However, populations of invading cells (zoomed regions in A and graph in C) exhibit the reverse trend, with no significant decrease in viability in response to oxaliplatin even at 500 μM but significantly higher sensitivity to PDT. The zoomed in regions of invading populations after oxaliplatin and PDT (Figure 3A, right panels) show large numbers of dead cells (red dots) following PDT, but little evidence of cell death following the chemotherapy treatment. These images were processed to quantitatively report the fraction of surviving ECM-infiltrating cells, outside the segmented primary nodule volume, for each treatment condition (Figure 3D). While oxaliplatin treatment appears to decrease proliferation to some extent even in invasive populations, these cells are significantly less chemosensitive than the cells of the primary spheroid. As expected, both therapies are far less effective in 3D culture conditions than in monolayer. Interestingly, when viability of ECM-invaders in is plotted against invasion distance (Figure 3E), PDT is found to be most effective on the leading cells with highest invasive velocity that have progressed more than 200 μm from the spheroid edge (Figure 3F). This is an intriguing result, showing that not only does PDT have enhanced efficacy in ECM-invading cells, but that the most invasive cells are the most sensitive to PDT.
Figure 3. ECM invading populations exhibit chemoresistance but enhanced sensitivity to PDT.

(A) Representative PANC1 spheroids treated with either chemotherapy or PDT doses notes and stained with calcein (green) and ethidium bromide (red), showing viability of core spheroid cells and ECM infiltrating cells. (B) Dose response, evaluated via MTS, of PANC1 to oxaliplatin or PDT in monolayer, used to inform dose selection for each therapy. The LD90 dose (arrow) of each is selected for subsequent comparison of therapies across contrasting ECM conditions. (C) Dose response (normalized residual volume from image segmentation) for primary spheroids shows modest growth inhibition of primary nodule by oxaliplatin, but n.s. for PDT. (D) Dose response for invading cells (analysis applicable for COL1 only) shows no response to oxaliplatin, approximately 50% killing from PDT at 25 J/cm2 (P <0.01). (E) Further analysis of individual invading cell viability with respect to radial distance from COL1 spheroid edge showing clear separation of PDT and chemotherapy response. (F) Breakdown of response in leading (d > 200 μm) and lagging invaders for chemotherapy and PDT shows further enhancement in PDT response for leading cells.
Chemoresistant PDAC displays increased invasiveness in 3D culture
Having found phenotype-dependent treatment response related to ECM conditions, we further probed this in the inverse scenario, using genetically-matched PDAC cells with contrasting invasive potential, but placed in identical ECM microenvironments. Motivated by previous reports showing acquisition of increased invasion and EMT in chemoresistant cells (37), we generated and characterized drug-resistant PDAC sublines for further study. PANC1 and BxPC3 cells were exposed to oxaliplatin in increasing concentration over consecutive passages to establish stable, resistant sublines, PANC1OR and BxPC3OR, respectively (Figure 4). In both lines increased IC50 and increased mesenchymal characteristics relative to their parent lines were confirmed (Figure 4, B and C). Additionally, generation of oxaliplatin resistance in PANC1 led to decreased doubling time (2.1 days versus 1.7 days in parent cells Supplemental Figure S1), also likely protective from classic chemotherapy agents that cell replication. As shown in Figure 4 (C and D), PANC1OR cells express significantly more vimentin and significantly less E-cadherin based on quantitative immunofluorescence verified by western blot, as well as the low cell-cell contact and spindle-shaped morphology characteristic of a mesenchymal phenotype. In additional experiments, a PANC1 subline resistant to both oxaliplatin and gemcitabine (PANC1ORGR) has similar EMT marker expression (S2A, S2B). The oxaliplatin-resistant BxPC3 also line shows a partial increase in mesenchymal characteristics (Figure 4C), where vimentin is increased but E-cadherin expression does not change significantly.
Figure 4. Generation chemoresistant sublines with increased mesenchymal characteristics.

(A) Workflow for experiments with chemoresistant sublines (Figures 4 through 6), (B) Confirmation of resistance to oxaliplatin from comparative dose response in PANC1 and oxaliplatin resistant subline, PANC1OR (top), and for BxPC3 and its oxaliplatin resistant subline, BxPC3OR (bottom). (C) Immunofluorescence and quantification show increased vimentin, decreased E-cadherin in resistant versus non-resistant cells, in a similar trend to invading versus non-invading in above experiments. (D) Measurement of above markers via Western blot quantified at right and normalized to GAPDH.
The 3D growth behavior of parent and resistant sublines were evaluated using an established Matrigel overlay culture. While both lines initially formed compact 3D nodules on the ECM bed, at approximately day 12, PANC1OR cultures began exhibiting morphological changes and invasion deep into ECM (Figure 5). Confocal imaging of DAPI/phalloidin stained PANC1 nodules displays a compact 3D structure and minimal invasion into Matrigel (dotted yellow line) (Figure 5A, upper panels). In contrast, PANC1OR cultures form large invasive protrusions, spreading over the surface and invading into the ECM bed (Figure 5A, lower panels) with a similar pattern of extensive invasion for the multidrug resistant 3D cultures (S2C). An established transwell-insert invasion assay quantitatively shows enhanced invasion of PANC1OR through Matrigel ECM relative to PANC1 (Figure 5B).
Figure 5. 3D cultures of chemoresistant PDAC exhibit increased invasion.

(A) DAPI/phalloidin-stained PANC1 and PANC1OR overlay cultures on Matrigel. Both lines initially form compact multicellular aggregates consistent with previous characterization, but resistant lines in 3D cultures spontaneously develop highly invasive phenotypes after 12 days in 3D culture (shown). The dotted yellow line indicates approximate Matrigel surface, showing invasion through the ECM bed by PANC1OR cultures. (B) Results of a transwell invasion characterizing increased invasive potential of PANC1OR through a Matrigel layer. (C) PTMR measurements show spatial variation in ECM compliance with lower stiffness in measurements obtained from upper focal planes (UFP) close to the 3D nodules on the surface, and stiffer ECM in lower focal planes (LFP). (D) Longitudinal analysis of PTMR measurements also shows increased rate of ECM degradation (decrease in rigidity) in the drug-resistant cultures, concomitant with remodeling to enable motility (P<0.01).
In parallel cultures with 1 μm tracer probes embedded to enable PTMR measurements, a decrease in ECM rigidity is also observed concomitant with invasion. PTMR measurements show spatial variation in ECM compliance with lower stiffness measurements obtained from upper focal planes (UFP) close to 3D nodules on the surface, and stiffer ECM in lower focal planes (LFP) (Figure 5C). As expected, ECM degradation is more dramatic in drug resistant 3D cultures. Analysis of tracer probe trajectories close to the interface of downward-progressing invaders shows an increase in thermally-driven movement, reporting a drop in stiffness (G′(ω)) over a 24-hour period after 12 days of 3D growth in PANC1OR cultures compared to PANC1 (Figure 5D). While the laminin-rich basement membrane constrains invasion in the parent cell line, both in overlays and in the transplanted spheroids (Figure 1–3) the chemoresistant subline with increased EMT is able to remodel ECM and enable 3D spreading and invasive motility, similar to what is observed in spheroids placed in soft COL1 (Figures 1–3). We then sought to determine whether differential response to PDT and chemotherapy in resistant and non-resistant lines in identical ECM would parallel results with the parent line in contrasting ECM environments.
Chemoresistant PDAC displays enhanced PDT sensitivity in 3D culture
PANC1 and PANC1OR cultures were grown for 12 days (as above) prior to intervention with oxaliplatin or PDT and terminal assessment via vital dye staining and quantitative treatment assessment (qVISTA) previously described (23). As expected, PANC1OR retain their resistance to oxaliplatin when grown in 3D cultures (Figure 6A). However, PANC1OR cells exhibit significantly enhanced PDT response relative to PANC1 cells (Figure 6B and Figure 6C). Similarly, multidrug resistant PANC1ORGR cells exhibit enhanced PDT response relative to PANC1 cells grown on Matrigel beds (S2D). It is not unexpected that chemoresistant cancer cells are responsive to PDT, particularly using verteporfin, which is known to be a potent mitochondrial inducer of apoptosis that bypasses mechanisms of drug resistance (38). This is however, to the best of our knowledge, the first time that conditions have been identified in which drug resistant cells acquire enhanced sensitivity to PDT relative to their parent cells. Yet this result is also consistent with the spheroid transplantation experiments (Figures 1–3), in which ECM conditions that drive enhanced invasion, also are correlated with chemoresistance but enhanced response to PDT.
Figure 6. Chemoresistant PDAC displays enhanced PDT sensitivity in 3D culture.

(A) Comparison of response to oxaliplatin in PANC1 and PANC1OR 3D cultures shows that resistance to low doses of oxaliplatin is preserved in 3D growth conditions, as expected. (B) PDT response of PANC1 and PANC1OR, shows dramatic increase in sensitivity in the latter. (C) Representative images of PDT response in PANC1 and PANC1OR 3D cultures stained with vital dyes. Scalebars = 100 μm.
Collectively, both experimental designs, manipulating the ECM environment of a given cell type and manipulating the biology of a parent cell type in a given ECM, show that highly motile ECM invading cells are markedly more susceptible to PDT. Noting that in the conditions where enhanced response to PDT is observed there is also acquisition of a mesenchymal phenotype, we further examined whether direct biochemical induction of this phenotypic transition would have a similar effect on differential sensitivity to chemotherapy and PDT.
EMT induction on plastic is not sufficient to enhance sensitivity to PDT
As shown in Figure 7A and 7B, activation of TGFβ in serum-starved PANC1 results in increased vimentin and decreased E-cadherin consistent with EMT and previous reports (39,40). As expected, after oxaliplatin treatment, MTS evaluation of response shows that TGFβ-treated PANC1 cells remain significantly more viable at multiple oxaliplatin doses (Figure 7C, top graph). However, PDT response for PANC1 induced with TGFβ respond similarly to non EMT-induced PANC1 (Figure 7C, bottom graph). The same trend is evident in clonogenic survival assays (S3), which also show a significant enhancement in viability for PANC1 cells treated with TGFβ, but no difference in PDT response.
Figure 7. PDT efficacy is not enhanced if EMT is induced in the absence of ECM.

(A) Immunofluorescence images of PANC1, PANC1 + TGFβ, BxPC3, and BxPC3 + fibroblast conditioned media (FCM) show characteristic increased scattering and loss of adherens junctions in EMT-inducing conditions. (B) Quantification of immunofluorescence at left. (C) Dose response comparison in PANC1 +/− TGFβ for oxaliplatin (top) and PDT (bottom) showing expected chemoresistance but not an enhancement in PDT response as seen in 3D ECM-invading cells. (D) Dose response comparison in BxPC3 and BxPC3 + FCM for oxaliplatin (top) and PDT (bottom). (E) PDT dose response for oxaliplatin-resistant cell lines.
Similar experiments were carried out using BxPC3 cells, which are SMAD4 deficient and do not have an activating KRAS mutation, both required for induction of EMT via TGFβ signaling (39,41). However, BxPC3 cells exposed to fibroblast conditioned media (FCM) reveal similar increases in mesenchymal characteristics, though without measurable loss of E-cadherin (Figures 7A and 7B). Similarly to PANC1 + TGFβ, BxPC3 + FCM show oxaliplatin resistance but no difference in PDT response (Figure 7D). In both chemoresistant cell lines (BxPC3OR and PANC1OR), PDT treatment is not more effective than in parent cell lines (Figure 7E). Additionally, PANC1+ FCM increases EMT marker expression and causes similar effects on oxaliplatin and PDT treatment response (S4).
Treatment experiments using direct generation of chemoresistant cell lines or EMT induction (using TGFβ or FCM) are consistent with the expectation that EMT populations are resistant to chemotherapy, but phenotype in monolayer apparently does not significantly affect PDT response (Figure 7E compared to 6B). These results suggest that the observed increase in PDT efficacy in invasive populations requires interaction with ECM in a 3D environment. This finding motivates further mechanistic exploration to identify biological changes in these cells (e.g. altered integrin signaling) that could be connected with susceptibility to PDT (e.g. oxidative stress response). Future directions for this research will also include developing culture methods to disentangle the observed biophysical and biological effects of ECM composition on PDAC motility and treatment response.
Collectively, our results show that PDT targets invasive and chemoresistant PDAC populations associated with the aggressive metastatic spread and the notoriously poor outcomes for this disease. Combined with recent clinical studies establishing safety and feasibility of therapeutic light delivery to the pancreas (21), these results suggest the promise of PDT for targeting invasive and drug resistant PDAC. Within the context of optimizing clinical PDT for PDAC, these insights could help to inform treatment design, specifically targeting invading fields containing early metastatic cells that would otherwise escape chemotherapy. This suggests that PDT could be particularly useful for relatively localized PDAC (if diagnosed in time), though if treatment fields are selected appropriately, the enhanced killing of invading and chemoresistant cells could have benefit for disease at all stages. Building on the groundwork laid in the present study, this approach will benefit from further investigation following the path of other PDT-based strategies, such as targeting of tumor vasculature (42,43) and stromal components (44). Furthermore, the insight that the primary proliferating spheroid mass in 3D cultures is more susceptible to chemotherapy indicates that a combination would achieve more complete response, a theme that echoes numerous earlier studies on PDT-based combinations (45–49). To evaluate this specific insight into PDT for PDAC, this study entailed development of a new tumor modeling and imaging framework for biophysically-informed therapeutic evaluation. This approach enables not only direct co-registration of cell motility and treatment response as described above, but also lends itself to broader applicability to other cancer therapeutics going forward.
Supplementary Material
Acknowledgments
We gratefully acknowledge funding from the National Cancer Institute (R00CA155045, PI: JPC), productive discussions with Dr. Imran Rizvi of Massachusetts General Hospital and assistance with cell culture and western blotting experiments provided by Rojin Jafari, Saipriya Sagiraju, and Sathish Kasina. GMC also acknoweldges support from a Sanofi Genzyme Doctoral Research Fellowship.
Footnotes
The authors disclose no potential conflicts of interest.
References
- 1.Vonderheide RH. Tumor-promoting inflammatory networks in pancreatic neoplasia: another reason to loathe Kras. Cancer Cell. 2014;25(5):553–4. doi: 10.1016/j.ccr.2014.04.020. [DOI] [PMC free article] [PubMed] [Google Scholar]
- 2.Cirri P, Chiarugi P. Cancer associated fibroblasts: the dark side of the coin. Am J Cancer Res. 2011;1(4):482–97. [PMC free article] [PubMed] [Google Scholar]
- 3.Pickup MW, Mouw JK, Weaver VM. The extracellular matrix modulates the hallmarks of cancer. EMBO Rep. 2014;15(12):1243–53. doi: 10.15252/embr.201439246. [DOI] [PMC free article] [PubMed] [Google Scholar]
- 4.Paszek MJ, Zahir N, Johnson KR, Lakins JN, Rozenberg GI, Gefen A, et al. Tensional homeostasis and the malignant phenotype. Cancer Cell. 2005;8(3):241–54. doi: 10.1016/j.ccr.2005.08.010. [DOI] [PubMed] [Google Scholar]
- 5.Lu P, Weaver VM, Werb Z. The extracellular matrix: a dynamic niche in cancer progression. J Cell Biol. 2012;196(4):395–406. doi: 10.1083/jcb.201102147. [DOI] [PMC free article] [PubMed] [Google Scholar]
- 6.Levental KR, Yu H, Kass L, Lakins JN, Egeblad M, Erler JT, et al. Matrix crosslinking forces tumor progression by enhancing integrin signaling. Cell. 2009;139(5):891–906. doi: 10.1016/j.cell.2009.10.027. [DOI] [PMC free article] [PubMed] [Google Scholar]
- 7.Shintani Y, Hollingsworth MA, Wheelock MJ, Johnson KR. Collagen I promotes metastasis in pancreatic cancer by activating c-Jun NH(2)-terminal kinase 1 and up-regulating N-cadherin expression. Cancer Res. 2006;66(24):11745–53. doi: 10.1158/0008-5472.CAN-06-2322. [DOI] [PubMed] [Google Scholar]
- 8.Shintani Y, Wheelock MJ, Johnson KR. Phosphoinositide-3 kinase-Rac1-c-Jun NH2-terminal kinase signaling mediates collagen I-induced cell scattering and up-regulation of N-cadherin expression in mouse mammary epithelial cells. Mol Biol Cell. 2006;17(7):2963–75. doi: 10.1091/mbc.E05-12-1123. [DOI] [PMC free article] [PubMed] [Google Scholar]
- 9.Gong Z, Holly EA, Bracci PM. Survival in population-based pancreatic cancer patients: San Francisco Bay area, 1995–1999. Am J Epidemiol. 2011;174(12):1373–81. doi: 10.1093/aje/kwr267. [DOI] [PMC free article] [PubMed] [Google Scholar]
- 10.Goldstein D, El-Maraghi RH, Hammel P, Heinemann V, Kunzmann V, Sastre J, et al. nab-Paclitaxel plus gemcitabine for metastatic pancreatic cancer: long-term survival from a phase III trial. J Natl Cancer Inst. 2015;107(2) doi: 10.1093/jnci/dju413. [DOI] [PubMed] [Google Scholar]
- 11.Mollenhauer J, Roether I, Kern HF. Distribution of extracellular matrix proteins in pancreatic ductal adenocarcinoma and its influence on tumor cell proliferation in vitro. Pancreas. 1987;2(1):14–24. doi: 10.1097/00006676-198701000-00003. [DOI] [PubMed] [Google Scholar]
- 12.Mahadevan D, Von Hoff DD. Tumor-stroma interactions in pancreatic ductal adenocarcinoma. Mol Cancer Ther. 2007;6(4):1186–97. doi: 10.1158/1535-7163.MCT-06-0686. [DOI] [PubMed] [Google Scholar]
- 13.Vonlaufen A, Phillips PA, Xu Z, Goldstein D, Pirola RC, Wilson JS, et al. Pancreatic stellate cells and pancreatic cancer cells: an unholy alliance. Cancer Res. 2008;68(19):7707–10. doi: 10.1158/0008-5472.CAN-08-1132. [DOI] [PubMed] [Google Scholar]
- 14.Erkan M, Hausmann S, Michalski CW, Fingerle AA, Dobritz M, Kleeff J, et al. The role of stroma in pancreatic cancer: diagnostic and therapeutic implications. Nat Rev Gastroenterol Hepatol. 2012;9(8):454–67. doi: 10.1038/nrgastro.2012.115. [DOI] [PubMed] [Google Scholar]
- 15.Gore J, Korc M. Pancreatic cancer stroma: friend or foe? Cancer Cell. 2014;25(6):711–2. doi: 10.1016/j.ccr.2014.05.026. [DOI] [PMC free article] [PubMed] [Google Scholar]
- 16.Ozdemir BC, Pentcheva-Hoang T, Carstens JL, Zheng X, Wu CC, Simpson TR, et al. Depletion of carcinoma-associated fibroblasts and fibrosis induces immunosuppression and accelerates pancreas cancer with reduced survival. Cancer Cell. 2014;25(6):719–34. doi: 10.1016/j.ccr.2014.04.005. [DOI] [PMC free article] [PubMed] [Google Scholar]
- 17.Rhim AD, Oberstein PE, Thomas DH, Mirek ET, Palermo CF, Sastra SA, et al. Stromal elements act to restrain, rather than support, pancreatic ductal adenocarcinoma. Cancer Cell. 2014;25(6):735–47. doi: 10.1016/j.ccr.2014.04.021. [DOI] [PMC free article] [PubMed] [Google Scholar]
- 18.Siegel RL, Miller KD, Jemal A. Cancer statistics, 2016. CA Cancer J Clin. 2016;66(1):7–30. doi: 10.3322/caac.21332. [DOI] [PubMed] [Google Scholar]
- 19.Dougherty TJ, Gomer CJ, Henderson BW, Jori G, Kessel D, Korbelik M, et al. Photodynamic therapy. J Natl Cancer Inst. 1998;90(12Review):889–905. doi: 10.1093/jnci/90.12.889. [DOI] [PMC free article] [PubMed] [Google Scholar]
- 20.Celli JP, Solban N, Liang A, Pereira SP, Hasan T. Verteporfin-based photodynamic therapy overcomes gemcitabine insensitivity in a panel of pancreatic cancer cell lines. Lasers Surg Med. 2011;43(7):565–74. doi: 10.1002/lsm.21093. [DOI] [PMC free article] [PubMed] [Google Scholar]
- 21.Huggett MT, Jermyn M, Gillams A, Illing R, Mosse S, Novelli M, et al. Phase I/II study of verteporfin photodynamic therapy in locally advanced pancreatic cancer. Br J Cancer. 2014;110(7):1698–704. doi: 10.1038/bjc.2014.95. [DOI] [PMC free article] [PubMed] [Google Scholar]
- 22.Nguyen-Ngoc KV, Cheung KJ, Brenot A, Shamir ER, Gray RS, Hines WC, et al. ECM microenvironment regulates collective migration and local dissemination in normal and malignant mammary epithelium. Proc Natl Acad Sci U S A. 2012;109(39):E2595–604. doi: 10.1073/pnas.1212834109. [DOI] [PMC free article] [PubMed] [Google Scholar]
- 23.Celli JP, Rizvi I, Blanden AR, Massodi I, Glidden MD, Pogue BW, et al. An imaging-based platform for high-content, quantitative evaluation of therapeutic response in 3D tumour models. Scientific reports. 2014;4:3751. doi: 10.1038/srep03751. [DOI] [PMC free article] [PubMed] [Google Scholar]
- 24.Anbil S, Rizvi I, Celli JP, Alagic N, Pogue BW, Hasan T. Impact of treatment response metrics on photodynamic therapy planning and outcomes in a three-dimensional model of ovarian cancer. J Biomed Opt. 2013;18(9):098004. doi: 10.1117/1.JBO.18.9.098004. [DOI] [PMC free article] [PubMed] [Google Scholar]
- 25.Franken NA, Rodermond HM, Stap J, Haveman J, van Bree C. Clonogenic assay of cells in vitro. Nat Protoc. 2006;1(5):2315–9. doi: 10.1038/nprot.2006.339. [DOI] [PubMed] [Google Scholar]
- 26.Jones DP, Hanna W, El-Hamidi H, Celli JP. Longitudinal measurement of extracellular matrix rigidity in 3D tumor models using particle-tracking microrheology. J Vis Exp. 2014;(88) doi: 10.3791/51302. [DOI] [PMC free article] [PubMed] [Google Scholar]
- 27.Hall DM, Brooks SA. In vitro invasion assay using matrigel: a reconstituted basement membrane preparation. Methods Mol Biol. 2014;1070:1–11. doi: 10.1007/978-1-4614-8244-4_1. [DOI] [PubMed] [Google Scholar]
- 28.Shields MA, Dangi-Garimella S, Krantz SB, Bentrem DJ, Munshi HG. Pancreatic cancer cells respond to type I collagen by inducing snail expression to promote membrane type 1 matrix metalloproteinase-dependent collagen invasion. J Biol Chem. 2011;286(12):10495–504. doi: 10.1074/jbc.M110.195628. [DOI] [PMC free article] [PubMed] [Google Scholar]
- 29.Armstrong T, Packham G, Murphy LB, Bateman AC, Conti JA, Fine DR, et al. Type I collagen promotes the malignant phenotype of pancreatic ductal adenocarcinoma. Clin Cancer Res. 2004;10(21):7427–37. doi: 10.1158/1078-0432.CCR-03-0825. [DOI] [PubMed] [Google Scholar]
- 30.Celli JP, Rizvi I, Evans CL, Abu-Yousif AO, Hasan T. Quantitative imaging reveals heterogeneous growth dynamics and treatment-dependent residual tumor distributions in a three-dimensional ovarian cancer model. J Biomed Opt. 2010;15(5):051603. doi: 10.1117/1.3483903. [DOI] [PMC free article] [PubMed] [Google Scholar]
- 31.Semler EJ, Ranucci CS, Moghe PV. Mechanochemical manipulation of hepatocyte aggregation can selectively induce or repress liver-specific function. Biotechnol Bioeng. 2000;69(4):359–69. doi: 10.1002/1097-0290(20000820)69:4<359::aid-bit2>3.0.co;2-q. [DOI] [PubMed] [Google Scholar]
- 32.Zaman MH, Trapani LM, Sieminski AL, Mackellar D, Gong H, Kamm RD, et al. Migration of tumor cells in 3D matrices is governed by matrix stiffness along with cell-matrix adhesion and proteolysis. Proc Natl Acad Sci U S A. 2006;103(29):10889–94. doi: 10.1073/pnas.0604460103. [DOI] [PMC free article] [PubMed] [Google Scholar]
- 33.Wang L-S, Du C, Toh WS, Wan AC, Gao SJ, Kurisawa M. Modulation of chondrocyte functions and stiffness-dependent cartilage repair using an injectable enzymatically crosslinked hydrogel with tunable mechanical properties. Biomaterials. 2014;35(7):2207–17. doi: 10.1016/j.biomaterials.2013.11.070. [DOI] [PubMed] [Google Scholar]
- 34.Ulrich TA, Jain A, Tanner K, MacKay JL, Kumar S. Probing cellular mechanobiology in three-dimensional culture with collagen–agarose matrices. Biomaterials. 2010;31(7):1875–84. doi: 10.1016/j.biomaterials.2009.10.047. [DOI] [PubMed] [Google Scholar]
- 35.Branco da Cunha C, Klumpers DD, Li WA, Koshy ST, Weaver JC, Chaudhuri O, et al. Influence of the stiffness of three-dimensional alginate/collagen-I interpenetrating networks on fibroblast biology. Biomaterials. 2014;35(32):8927–36. doi: 10.1016/j.biomaterials.2014.06.047. [DOI] [PubMed] [Google Scholar]
- 36.Conroy T, Desseigne F, Ychou M, Bouche O, Guimbaud R, Becouarn Y, et al. FOLFIRINOX versus gemcitabine for metastatic pancreatic cancer. N Engl J Med. 2011;364(19):1817–25. doi: 10.1056/NEJMoa1011923. [DOI] [PubMed] [Google Scholar]
- 37.Shah AN, Summy JM, Zhang J, Park SI, Parikh NU, Gallick GE. Development and characterization of gemcitabine-resistant pancreatic tumor cells. Ann Surg Oncol. 2007;14(12):3629–37. doi: 10.1245/s10434-007-9583-5. [DOI] [PubMed] [Google Scholar]
- 38.Kessel D, Luo Y. Photodynamic therapy: a mitochondrial inducer of apoptosis. Cell Death Differ. 1999;6(1):28–35. doi: 10.1038/sj.cdd.4400446. [DOI] [PubMed] [Google Scholar]
- 39.Ellenrieder V, Hendler SF, Boeck W, Seufferlein T, Menke A, Ruhland C, et al. Transforming growth factor beta1 treatment leads to an epithelial-mesenchymal transdifferentiation of pancreatic cancer cells requiring extracellular signal-regulated kinase 2 activation. Cancer Res. 2001;61(10):4222–8. [PubMed] [Google Scholar]
- 40.Fuxe J, Vincent T, Garcia de Herreros A. Transcriptional crosstalk between TGF-beta and stem cell pathways in tumor cell invasion: role of EMT promoting Smad complexes. Cell Cycle. 2010;9(12):2363–74. doi: 10.4161/cc.9.12.12050. [DOI] [PubMed] [Google Scholar]
- 41.Subramanian G, Schwarz RE, Higgins L, McEnroe G, Chakravarty S, Dugar S, et al. Targeting endogenous transforming growth factor beta receptor signaling in SMAD4-deficient human pancreatic carcinoma cells inhibits their invasive phenotype1. Cancer Res. 2004;64(15):5200–11. doi: 10.1158/0008-5472.CAN-04-0018. [DOI] [PubMed] [Google Scholar]
- 42.Chen B, Pogue BW, Luna JM, Hardman RL, Hoopes PJ, Hasan T. Tumor vascular permeabilization by vascular-targeting photosensitization: effects, mechanism, and therapeutic implications. Clinical Cancer Research. 2006;12(3):917–23. doi: 10.1158/1078-0432.CCR-05-1673. [DOI] [PubMed] [Google Scholar]
- 43.Scherz A, Salomon Y, Lindner U, Coleman J. Vascular-Targeted Photodynamic Therapy in Prostate Cancer: From Bench to Clinic. Photodynamic Medicine. 2016:461–80. [Google Scholar]
- 44.Celli JP. Stromal interactions as regulators of tumor growth and therapeutic response: A potential target for photodynamic therapy? Israel journal of chemistry. 2012;52(8–9):757–66. doi: 10.1002/ijch.201200013. [DOI] [PMC free article] [PubMed] [Google Scholar]
- 45.del Carmen MG, Rizvi I, Chang Y, Moor ACE, Oliva E, Sherwood M, et al. Synergism of Epidermal Growth Factor Receptor-Targeted Immunotherapy With Photodynamic Treatment of Ovarian Cancer In Vivo. Journal of the National Cancer Institute. 2005;97(20):1516–24. doi: 10.1093/jnci/dji314. [DOI] [PubMed] [Google Scholar]
- 46.Kosharskyy B, Solban N, Chang SK, Rizvi I, Chang Y, Hasan T. A Mechanism-Based Combination Therapy Reduces Local Tumor Growth and Metastasis in an Orthotopic Model of Prostate Cancer. Cancer Research. 2006;66(22):10953–58. doi: 10.1158/0008-5472.CAN-06-1793. [DOI] [PubMed] [Google Scholar]
- 47.Rizvi I, Celli JP, Evans CL, Abu-Yousif AO, Muzikansky A, Pogue BW, et al. Synergistic Enhancement of Carboplatin Efficacy with Photodynamic Therapy in a Three-Dimensional Model for Micrometastatic Ovarian Cancer. Cancer Res. 2010;70(22):9319–28. doi: 10.1158/0008-5472.CAN-10-1783. [DOI] [PMC free article] [PubMed] [Google Scholar]
- 48.Ferrario A, von Tiehl K, Wong S, Luna M, Gomer C. Cyclooxygenase-2 Inhibitor Treatment Enhances Photodynamic Therapy-mediated Tumor Response. Cancer Research. 2002;62(14):3956–61. [PubMed] [Google Scholar]
- 49.Gomer CJ, Ferrario A, Luna M, Rucker N, Wong S. Photodynamic therapy: Combined modality approaches targeting the tumor microenvironment. Lasers in surgery and medicine. 2006 doi: 10.1002/lsm.20339. [DOI] [PubMed] [Google Scholar]
Associated Data
This section collects any data citations, data availability statements, or supplementary materials included in this article.