

Abstract
Background:
Hexabromocyclododecane (HBCD) is a high production volume brominated flame retardant added to building insulation foams, electronics, and textiles. HBCD is a commercial mixture (CM-HBCD) composed of three main stereoisomers: α-HBCD (10%), β-HBCD (10%), and γ-HBCD (80%). A shift from the dominant stereoisomer γ-HBCD to α-HBCD is detected in humans and wildlife.
Objectives:
Considering CM-HBCD has been implicated in neurodevelopment and endocrine disruption, with expected metabolism perturbations, we performed metabolomics on mice serum obtained during a window-of-developmental neurotoxicity to draw correlations between early-life exposures and developmental outcomes and to predict health risks.
Methods:
Six female C57BL/6 mice at postnatal day (PND) 10 were administered a single gavage dose of α-, γ-, or CM-HBCD at 3, 10, and 30 mg/kg. Nuclear magnetic resonance metabolomics was used to analyze 60 μL serum aliquots of blood collected 4 days post-oral exposure.
Results:
Infantile mice exposed to α-, γ-, or CM-HBCD demonstrated differences in endogenous metabolites by treatment and dose groups, including metabolites involved in glycolysis, gluconeogenesis, lipid metabolism, citric acid cycle, and neurodevelopment. Ketone bodies, 3-hydroxybutyrate, and acetoacetate, were nonstatistically elevated, when compared with mean control levels, in all treatment and dose groups, while glucose, pyruvate, and alanine varied. Acetoacetate was significantly increased in the 10 mg/kg α-HBCD and was nonsignificantly decreased with CM-HBCD. A third ketone body, acetone, was significantly lower in the 30 mg/kg α-HBCD group with significant increases in pyruvate at the same treatment and dose group. Metabolites significant in differentiating treatment and dose groups were also identified, including decreases in amino acids glutamate (excitatory neurotransmitter in learning and memory) and phenylalanine (neurotransmitter precursor) after α-HBCD and γ-HBCD exposure, respectively.
Conclusions:
We demonstrated that 4 days following a single neonatal oral exposure to α-, γ-, and CM-HBCD resulted in different serum metabolomic profiles, indicating stereoisomer- and mixture-specific effects and possible mechanisms of action.
Citation:
Szabo DT, Pathmasiri W, Sumner S, Birnbaum LS. 2017. Serum metabolomic profiles in neonatal mice following oral brominated flame retardant exposures to hexabromocyclododecane (HBCD) alpha, gamma, and commercial mixture. Environ Health Perspect 125:651–659; http://dx.doi.org/10.1289/EHP242
Introduction
1,2,5,6,9,10-hexabromocyclododecane (HBCD) is a brominated flame retardant (BFR) produced globally as a commercial-mixture (CM-HBCD). CM-HBCD, which is added to consumer products, enters the environment during production and leaches from goods in use or disposal (EC 2008). Food and dust ingestion and inhalation are considered relevant human exposure routes in the United States, Canada, European Union (EU), China, New Zealand, and Africa (Ali et al. 2012; Kalachova et al. 2012; Shoeib et al. 2012; Asante et al. 2013; Ni and Zeng 2013; Eljarrat et al. 2014; Fromme et al. 2014). CM-HBCD is lipophilic (log Kow 5.6), resistant to environmental degradation, has half-lives of 51, 1,440, and 5,760 hr in air, water, and sediment, respectively, transports over long distances, and bioaccumulates in human and animal tissue (EC 2008).
CM-HBCD was added to the 2013 Stockholm Convention list for global elimination following PBT (persistence, bioaccumulation, and toxicity) evaluation with a 5-year exemption for building insulation (see http://chm.pops.int/default.aspx). In 2014, the U.S. Environmental Protection Agency (EPA) nominated CM-HBCD to be added to the Toxic Release Inventory (U.S. EPA 2014b), and to the U.S. EPA’s Design for the Environment Alternatives Assessments (U.S. EPA 2014a). In the EU, CM-HBCD is listed as a substance of very high concern under Annex XIV of REACH (Regulation for Registration, Evaluation, Authorisation and Restriction of Chemicals); after 21 August 2015, only approved applications may use the chemical (ECHA 2009). Currently, under the Commission for Environmental Cooperation (CEC), Canada, Mexico, and the United States are evaluating the presence and migration of CM-HBCD from consumer products (CEC 2015). CM-HBCD is currently on the U.S. EPA Integrated Risk Information System (IRIS) program agenda, but an anticipated date for completion has not yet been determined (U.S. EPA 2015).
CM-HBCD public health concerns focus on adverse effects to infants and young children, as it has been detected in human fetal livers (Rawn et al. 2014), and experimental evidence suggests that it can impact thyroid hormone (TH), energy and lipid metabolism, and neurodevelopment. Young mice (6–20 weeks) that were exposed weekly to 700 μg/kg or 35 μg/kg CM-HBCD in a high-fat diet experience weight gain and metabolic dysfunction (disrupting lipid and glucose homeostasis), possibly accelerating obesity progression (Yanagisawa et al. 2014). A two-generation Crl:CD(SD) rat (Ema et al. 2008) and pregnant Sprague-Dawley rat study (Saegusa et al. 2009) found no observed adverse effect level (NOAEL)at 150 ppm and 100 ppm CM-HBCD doses, respectively, while higher levels of CM-HBCD led to disruption of TH levels. Learning and memory and other developmental neurotoxicity (DNT) end points were observed in 3-month-old mice after a single oral exposure of either 0.9 mg HBCD/kg or 13.5 mg HBCD/kg to neonatal NMRI mice (Eriksson et al. 2006). Pregnant Long-Evans rats, gavaged gestation day 1 to parturition with 3, 10, or 30 mg/kg HBCD, produced offspring with long-term behavioral impairments (Miller-Rhodes et al. 2014). PND22 Balb/c mice exposed 28 days to fish-based diets spiked with CM-HBCD had changes in neural transcriptomic profiles (calcium signaling) and proteomic profiles (excitotoxicity) (Rasinger et al. 2014), possibly inhibiting sarcoplasmic-endoplasmic reticulum Ca2+ ATPase (Al-Mousa and Michelangeli 2014). Sixty-two children from randomly selected women who were part of the prospective Groningen infant COMPARE study noted to have detectable serum HBCD concentrations were found to have changes in coordination, verbal skills, and total intelligence (Roze et al. 2009). In a cross-sectional study of 515 Belgian adolescents 14–17 years old, serum HBCD concentrations were not significantly correlated with neurobehavioral test scores or TH levels (Kiciński et al. 2012).
CM-HBCD stereoisomers are gamma (γ-HBCD; 75–89%), alpha (α-HBCD; 10–13%), and beta (β-HBCD; 1–12%) (Heeb et al. 2005). γ-HBCD is highest in environmental matrices, while α-HBCD dominates humans and wildlife, demonstrating the importance of stereoisomer-specific biomonitoring and toxicity studies (Covaci et al. 2006). HBCD stereoisomer studies demonstrate differences in water solubility, lipophilicity, structure, toxicokinetics, and metabolic pathways (Szabo et al. 2010, 2011a). γ-HBCD is rapidly metabolized and eliminated (terminal half-life ~ 1–4 days) with limited bioaccumulation, and undergoes in vivo stereoisomerization to β- and α-HBCD (Szabo et al. 2010). In contrast, α-HBCD’s terminal half-life is ~ 17 days, and it bioaccumulates, with lipophilic-driven tissue distribution, and no in vivo stereoisomerization (Szabo et al. 2011a). The toxicokinetic differences account for stereoisomer shifts between γ-HBCD and α-HBCD. Szabo et al. (2011b) demonstrated that infantile mice exposed at PND10 (α-HBCD or γ-HBCD) had 10–25% increased body-burden over adults (PND60). Hakk et al. (2012) identified unique metabolites via radiochemical detection in the urine and feces of α-HBCD and γ-HBCD-treated mice, further suggesting stereoisomers differ biologically and chemically. However, in vivo mammalian stereoisomer-specific toxicity studies are limited.
This study uses a non-targeted metabolomics approach to predict potential DNT hazards from exposure to a commercial chemical mixture and individual stereoisomers. Metabolomics enables the assessment of changes in levels of low-molecular weight endogenous compounds after chemical exposure. The goals of this study include a) develop a neonatal serum screening method to identify endogenous responses following CM-HBCD exposure; b) compare profiles between CM-HBCD, α-HBCD, and γ-HBCD; and c) determine metabolites associated with treatment groups and that have been associated with DNT in other studies.
Methods and Materials
Chemicals
1,2,5,6,9,10-hexabromocyclododecane (CAS#3194-55-6) is CM-HBCD purchased from Sigma-Aldrich (St. Louis, MO). Stereoisomer separation and thermal conversion were previously described (Szabo et al. 2010, 2011a). Other chemicals utilized were purchased from Sigma-Aldrich (St. Louis, MO) at the highest purity level available.
Dosing Solutions
Doses were selected based on published DNT (Eriksson et al. 2006) and toxicokinetics (Szabo et al. 2010, 2011a, 2011b), and stereoisomer percentage in CM-HBCD, α-HBCD, γ-HBCD, and CM-HBCD were individually mixed with corn oil and toluene and evaporated under vacuum; control solutions were generated using the same procedure. Mice were gavaged with 3, 10, or 30 mg/kg α-HBCD, 3 and 30 mg/kg γ-HBCD, and 30 mg/kg CM-HBCD. The doses selected were designed to determine individual stereoisomer contribution when compared to the commercial mixture [e.g., ~ 10% alpha (3 mg/kg) and 90% gamma (30 mg/kg) metabolic profiles to the 30 mg/kg CM-HBCD].
Animals and Treatment
PND10 mice given a single oral exposure of 0.9 mg/kg or 13.5 mg/kg HBCD displayed significant differences in spontaneous behavior at 3 months of age, and mice given the higher dose also had signs of impaired memory and learning (Eriksson et al. 2006) during a window of developmental neurotoxicity; therefore, this time point was selected for this metabolomic study. Mouse dams (n = 7) and female C57BL/6 pups (PND9, ~ 7 g) were purchased from Charles River Breeding Laboratories (Raleigh, NC), housed in an Association for Assessment and Accreditation of Laboratory Animal Care (AAALAC)-accredited facility, under the U.S. EPA’s National Health and Environmental Effects Research Laboratory (NHEERL) and Institutional Animal Care and Use Committee (IACUC) approval. Dams and six female pups per litter were acclimated (24 hr) in shoebox cages. PND10 female pups were gavaged with a single dose of vehicle control, α-HBCD, γ-HBCD, or CM-HBCD, at 10 mL/kg. Rodents were maintained on a 12-hr light/dark cycle, ambient temperature (22°C), and relative humidity (56 ± 5%). Rodents were provided Purina 5001 Rodent Chow (Ralston Purina, St. Louis, MO) and tap water ad libitum. Three to six pups per treatment (one pup per litter) were sacrificed (decapitation) 4 days following exposure, individually weighed, and blood harvested. Protocols involving animal use have been approved by an appropriate institutional committee, and animals have been treated humanely and with regard for alleviation of suffering.
Sample Preparation
We chose to measure blood metabolites on PND14 based on tissue concentrations measured at same time point (Szabo et al. 2010, 2011a, 2011b), and allowance of ample time to capture metabolite formation. Serum was prepared and stored at –80°C until analyzed. Aliquot of 60 μL of serum was mixed with 80 μL of solution containing 5 mM formate, 0.2% NaN3 in D2O, and 260 μL of saline (0.9% NaCl in D2O); 400 μL of solution was transferred into 5 mm NMR tube.
Instrument and Data Acquisition
1H NMR spectra were acquired on Bruker Advance III 950 MHz instrument (located at DHMRI, Kannapolis, NC) using a CPMG pulse sequence (Beckonert et al. 2007) with water suppression (cpmgpr1d) during relaxation, a 2-sec relaxation delay, and 256 scans. Spectra were acquired at 25°C, with 32 k data points, and zero-filled and Fourier Transformed. Spectra were phase- and baseline-corrected manually, and referenced to formate (8.44 ppm). The quality of NMR spectra was assessed for NMR line shape and width, signal to noise levels, alignment of identified markers. These are standard measures that ensure the quality of NMR data for further analysis. NMR peaks in the spectra had symmetric lorentzian line shapes with good signal to noise ratio and appropriate line width ~ 1–1.5 Hz, demonstrated by the line width of the internal standard peak, formate. The chemical shift (position of the NMR peaks in the spectrum) is sensitive to factors such as pH and ionic strength in the sample. Characteristic peaks in serum samples such as glucose and lactate were used for alignment across the samples. All raw and processed data, metadata, and experimental procedures are available at the NIH common fund metabolomics workbench (http://www.metabolomicsworkbench.com/).
Data Preprocessing
NMR data were preprocessed using traditional binning and quantitative approaches (Sumner et al. 2010; Pathmasiri et al. 2012). Binning was performed by automated integration with a 0.04 ppm bin width over the spectral window (excluding water suppression regions and formate signal), and bins were normalized to total integral of each of the spectrum. Serum metabolites and concentrations were library matched with Chenomx NMR Suite 5.1 Professional software (Edmonton, Alberta) using the formate internal standard for relative integration. This software contains internal library adjustments for increments in chemical shift based on pH, and relaxation time of signal (Weljie et al. 2006). The following advantages of this method include: a) small increments in pH result in portions of metabolite signals aligning with different bins, while deconvolution circumvents issue, and b) multiple signals within separate bins.
NMR spectroscopy is a quantitative method and the area under the peak is directly proportional to the number of atoms (1H described in the current analysis) underlying the peak. The relative concentration of the metabolite(s) can be determined by using an internal standard with a known concentration and the integrals of the metabolite and internal standard peaks using the formula CM = CIS × (IM/IIS)(NIS/NM), where CM = concentration of metabolite, CIS = concentration of internal standard, IM = integral of metabolite peak, IIS = integral of the internal standard, NM = number of 1H atoms of the metabolite peak, and NIS = number of 1H atoms of the internal standard peak. The NMR solutions used in these samples contained 1 mM formate, hence, enabling the relative quantitation of metabolites in the sample with respect to the formate internal standard. The Chenomx NMR library used for relative concentration determination contains a quantitative metabolite library where this formula is pre-built into software such that the concentration of metabolites can be directly obtained when the information about the internal standard and its concentration is given (Weljie et al. 2006). For subsequent data reduction from library matching, metabolite concentration was normalized to formate.
Data Reduction and Visualization
NMR data capture (metabolite ID and concentration or bin region and integral value) were transferred to SIMCA-P+ 12.0 software (Umetrics; Umeå, Sweden) for reduction and visualization. Normalized binned NMR data were Pareto scaled by dividing the integral of each bin by the reciprocal of the square root of the standard deviation for the bin and centered prior to multivariate analysis. Principal component analysis (PCA) and partial least squares projection to latent structures discriminate analysis (PLS-DA) were conducted using SIMCA-P+ 12.0 for binned and concentration data. These pattern recognition methods are commonly used to analyze high dimensional multicollinear data such as metabolomics data (Trygg et al. 2007; Eriksson et al. 2013). Loadings, variable influence on projections (VIP), and contribution plots were examined to determine bins or metabolites that best define group separation, which are commonly used multivariate statistical analysis approaches (Eriksson et al. 2013). The VIP statistic summarizes the importance of the bin in differentiating the phenotypic groups. The subset of bins or metabolites that had a VIP ≥ 1.0 with a jack-knife confidence interval that did not include 0 were determined to be important for differentiating the study groups. All models used a 7-fold cross-validation to assess the predictive variation of the model (Q2) (Eriksson et al. 2013). In addition, metabolite concentrations were compared between treatment and dose groups to controls using Mann–Whitney U test.
Results
This study used 60 μL serum aliquots and enabled the library matching of 40 endogenous metabolites for the treatment and dose groups for samples collected on the fourth day following a single oral exposure at PND10 (see Table S1). No changes in body weight were observed between treated and control mice (data not shown). NMR signals assigned via Chenomx library matching identified essential and nonessential amino acids, alcohols, ketones, fatty-acid by-products, and sugars (Figure 1). Classes of compounds detected by the NMR method included amino acids (alanine, asparagine, arginine, cysteine, glycine, glutamate, glutamine, homoserine, isoleucine, leucine, lysine, methionine, phenylalanine, sarcosine, serine, threonine, tyrosine, taurine, valine); alcohols (methanol and glycerol); ketones and fatty acid by-products (acetoacetate, acetate, 3-hydroxybutyrate, acetone, pyruvate, isobutyrate); sugar (glucose); other small molecule intermediates (o-phosphocholine, choline, n,n-dimethylglycine, citrate, creatine, lactate, methylhistidine, succinate, myo-inositol, dimethylamine, methylsuccinate, and 2-hydroxyisobutyrate).
Figure 1.
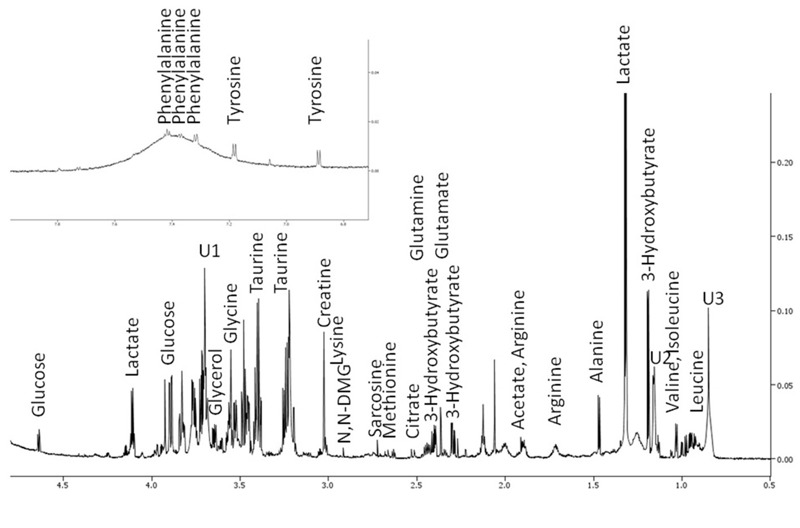
950 MHz 1H NMR spectrum of metabolites in a representative 60-μL mouse serum preparation. Signals for metabolites at higher concentration are labeled.
Significant differences in the metabolite-response levels and direction of change across treatment and dose groups are summarized in Table 1, and mean values of all metabolites are listed according to treatment group in Table S1. Phenylalanine exhibited decreases, 36% and 42% (p = 0.02 and 0.03, respectively) from controls after exposure to γ-HBCD at 3 mg/kg and 30 mg/kg, respectively. Glutamate exhibited dose-dependent decreases of 14%, 17%, and 28% (p = 0.37, 0.05, and 0.05, respectively) in 3 mg/kg, 10 mg/kg, and 30 mg/kg α-HBCD groups. Arginine was significantly decreased 30% and 48% (p = 0.05 and 0.02, respectively) in 3 mg/kg from γ- and α-HBCD, respectively. O-phosphocholine and choline increased 29% (p = 0.05) and decreased 43% (p = 0.007) in 10 mg/kg and 30 mg/kg groups, respectively, after α-HBCD exposure. Ketone bodies, acetoacetate and acetone, increased 40% (p = 0.02) at 10 mg/kg and decreased 28% (p = 0.03) at 30 mg/kg with α-HBCD exposure. Glycerol and taurine increased after CM-HBCD exposure by 18% (p = 0.02) and 11% (p = 0.01), respectively. Compared with controls, serum metabolites display mean values either consistently elevated (> 0) across all treatment and dose groups (3-hydroxybutyrate, creatine, valine, leucine) or lowered (< 0) across all treatment and dose groups (hemoserine, alanine, arginine), while all others display treatment- and dose-specific responses (see Table S1).
Table 1.
Metabolites that were significantly higher or lower than controls in 60 μL serum aliquots from at least one group of HBCD-exposed mice.
| Metabolite | α-HBCD | γ-HBCD | Commercial HBCD | |||
|---|---|---|---|---|---|---|
| 3 mg/kg n = 3 | 10 mg/kg n = 3 | 30 mg/kg n = 6 | 3 mg/kg n = 3 | 30 mg/kg n = 6 | 30 mg/kg n = 6 | |
| Increased | ||||||
| Acetoacetate | 1.05 ± 0.07 | 1.40 ± 0.14* | 1.19 ± 0.35 | 1.05 ± 0.43 | 1.06 ± 0.05 | –1.08 ± 0.02 |
| Glycerol | –1.11 ± 0.24 | 1.07 ± 0.41 | –1.03 ± 0.09 | 1.2 ± 0.23 | 1.10 ± 0.23 | 1.18 ± 0.09* |
| O_phosphocholine | –1.02 ± 0.10 | 1.29 ± 0.18* | –1.01 ± 0.28 | –1.01 ± 0.28 | –1.09 ± 0.07 | 1.22 ± 0.14 |
| Taurine | 1.04 ± 0.40 | 1.08 ± 0.12 | –1.00 ± 0.001 | 1.3 ± 0.83 | 1.07 ± 0.25 | 1.11 ± 0.64* |
| Pyruvate | 1.10 ± 0.22 | 1.13 ± 0.36 | 1.39 ± 0.12* | 1.08 ± 0.50 | 1.12 ± 0.27 | 1.00 ± 0.35 |
| Decreased | ||||||
| Acetone | –1.02 ± 0.33 | 1.16 ± 0.5 | –1.28 ± 0.5* | 1.04 ± 0.01 | 1.00 ± 0.01 | 1.02 ± 0.33 |
| Arginine | –1.30 ± 0.018* | –1.05 ± 0.20 | –1.02 ± 0.36 | –1.48 ± 0.95* | –1.02 ± 0.29 | –1.09 ± 0.44 |
| Choline | –1.06 ± 0.14 | 1.04 ± 0.13 | –1.43 ± 0.01* | 1.04 ± 0.17 | –1.12 ± 0.29 | 1.14 ± 0.47 |
| Glutamate | –1.14 ± 0.21 | –1.17 ± 0.06* | –1.28 ± 0.06* | 1.07 ± 0.18 | –1.18 ± 0.14 | 1.05 ± 0.19 |
| Phenylalanine | 1.00 ± 0.30 | –1.03 ± 0.04 | –1.15 ± 0.13 | –1.36 ± 0.55* | –1.42 ± 0.16* | –1.21 ± 0.04 |
| Note: Values represent difference ± standard deviation. Mean values for all metabolites are presented in Table S1. *Significantly different from control, p < 0.05. | ||||||
The PLS-DA of binned data for vehicle control (green), α-HBCD (blue), γ-HBCD (orange), and CM-HBCD (red) at 30-mg/kg group is displayed in Figure 2. The samples derived from mice exposed to either α-HBCD or γ-HBCD cluster and traject on one side of the vehicle control group, while samples from CM-HBCD cluster and traject on the other side of the vehicle control group. There is more variation between treatment and dose groups than within treatment groups. This qualitative metric is supported by observing the patterns of differentiation for treatment and dose groups indicate increased similarity in metabolic profiles between mice exposed to same treatment and dose groups, compared with other groups.
Figure 2.
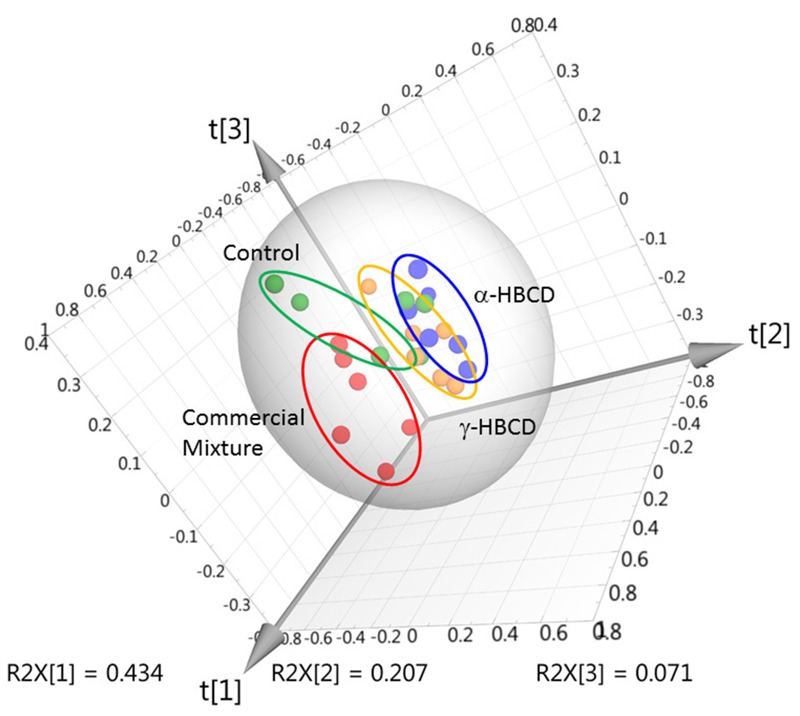
Multivariate analysis (PLS-DA score plot) of bin data obtained for serum from individual (n = 6/treatment group) mice exposed to vehicle controls (green), or 30 mg/kg α-HBCD (blue), γ-HBCD (orange), or CM-HBCD (red) [R2X = 0.713; R2Y = 0.379; Q2 = 0.0307].
PLS-DA analysis of the concentration data differentiates treatment- and dose-groups. Using α-HBCD profiles as an example, the 3 mg/kg, 10 mg/kg, and 30 mg/kg groups, and vehicle controls are presented in a 2-dimensional PLS-DA scores plot (Figure 3A). PLS-DA was conducted using data for controls and 30 mg/kg (Figure 3B), and examination of loadings plots, variable importance plots, and contribution plots (not shown) enabled selection of a metabolite subset (see “Methods and Materials”) that most contributed to group separation. Using only this metabolite subset, separation of α-HBCD from controls in PLS-DA (Figure 3C) improved, compared with the PLS-DA plot in Figure 3B, confirming that metabolite profiles are indeed distinct between groups. The process was repeated using γ-HBCD and CM-HBCD (control vs. each dose) to derive a list of distinct metabolites best distinguishing each group from other groups (Table 2). Although differentiation was achieved between all treatment and dose groups, PLS-DA analysis of the high-dose group concentration data (30 mg/kg) versus controls provided best separation (data not shown).
Figure 3.
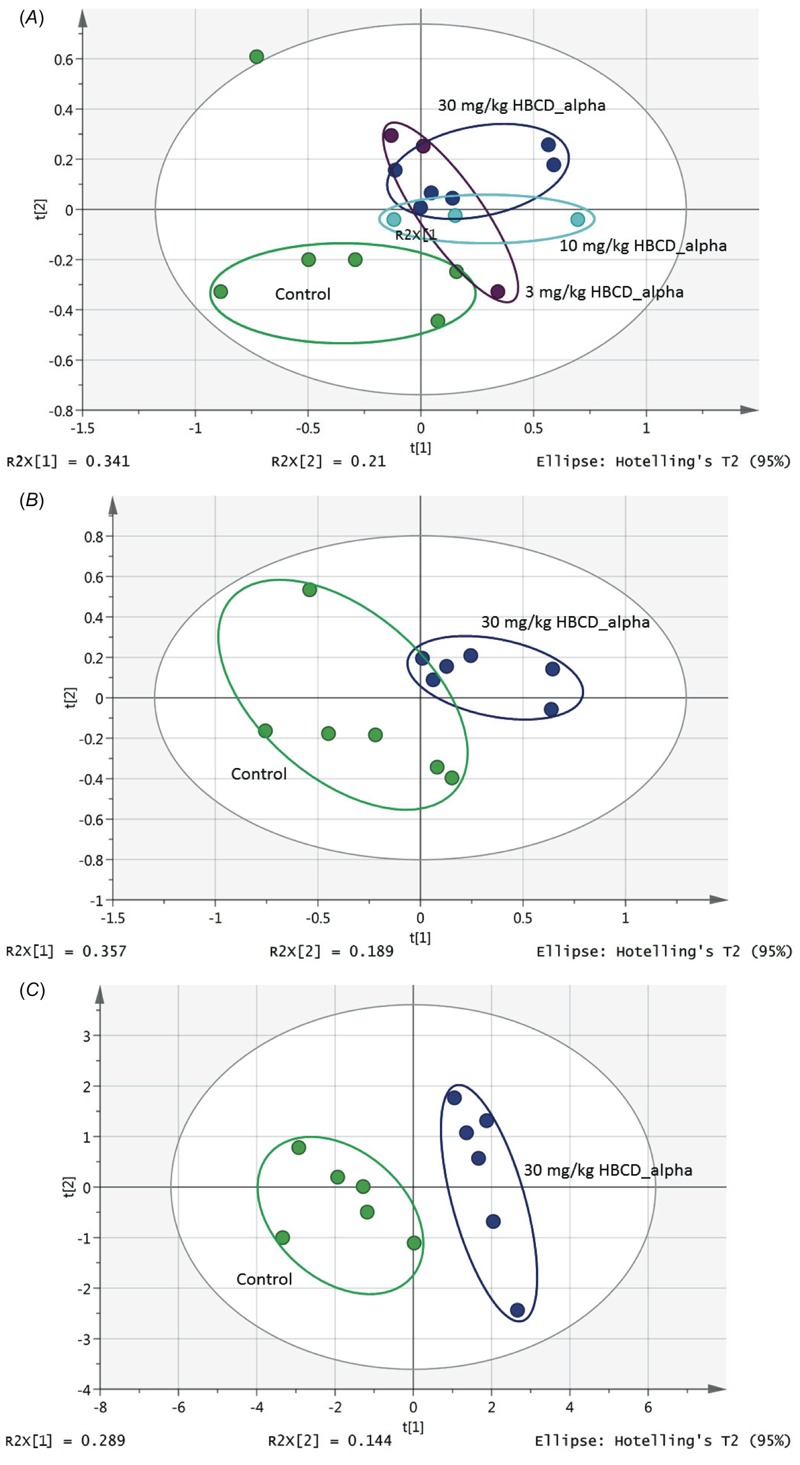
Score plot of PLS-DA analysis of metabolite concentration data for serum samples from mice administered (A) 0, 3, 10, and 30 mg/kg doses of α-HBCD, indicating separation between control (green) and dose groups [R2X = 0.664; R2Y = 0.693; Q2 = –0.11]; (B) vehicle control or 30 mg/kg α-HBCD showing clear separation of study groups (green, left, control; blue, right, α-HBCD) [R2X = 0.76; R2Y = 0.814; Q2 = 0.13]; (C) vehicle controls or 30 mg/kg α-HBCD showing improvement of separation of dose group from control group (green, left, control; blue, right, α-HBCD) [R2X = 0.504; R2Y = 0.915; Q2 = 0.538] was achieved using subset of metabolites that best defined groups (VIP ≥ 1.0 with 95% confidence interval that did not include 0). See Table 1 for numbers of mice per group.
Table 2.
Metabolites important to the differentiation of treatment and control groups, using PLD-DA analysis (VIP ≥ 1.0 with a jack-knife confidence interval that did not include 0).
| Exposure | Increased relative to control | Decreased relative to control |
|---|---|---|
| α-HBCD 3 mg/kg | 3-hydroxybutyrate Acetoacetate Creatine Leucine Methionine O-Phosphocholine Taurine Tyrosine Valine | Alanine Arginine Glutamate Lactate Pyruvate Serine |
| α-HBCD 10 mg/kg | 3-hydroxybutyrate Acetoacetate Glutamine Methionine O-Phosphocholine Taurine | Lactate Methanol N,N-Dimethylglycine Phenylalanine Pyruvate Glutamate |
| α-HBCD 30 mg/kg | 2-hydroxyisobutyrate 3-hydroxybutyrate Acetoacetate Glutamine Leucine Taurine Valine | Acetate Alanine Choline Citrate Glutamate Lactate Methanol Phenylalanine Pyruvate |
| γ-HBCD 3 mg/kg | 3-hydroxybutyrate Citrate Creatine Glycerol Glycine Serine Taurine | Alanine Asparagine Cysteine Lactate Methanol Phenylalanine Pyruvate |
| γ-HBCD 30 mg/kg | 2-hydroxyisobutyrate 3-hydroxybutyrate Asparagine Citrate Creatine Glucose Glycerol Glycine Taurine | Choline Glutamate Lactate Methanol Phenylalanine Pyruvate Serine Threonine Tyrosine |
| CM-HBCD 30 mg/kg | 3-hydroxybutyrate Asparagine Citrate Creatine Glycerol Lactate Methionine O-Phosphocholine Taurine Valine | Alanine Arginine Glucose Methanol Phenylalanine |
| Note: VIP, variable influence on projections. | ||
In both PLS-DA and NMR analyses, the CM-HBCD, α-HBCD, and γ-HBCD groups differentiated, representing exposure-specific responses. The CM-HBCD metabolomics pattern is more similar to γ-HBCD, than to α-HBCD (Figure 4). The differences between and among study groups was improved using concentration data, compared with using the binning results.
Figure 4.
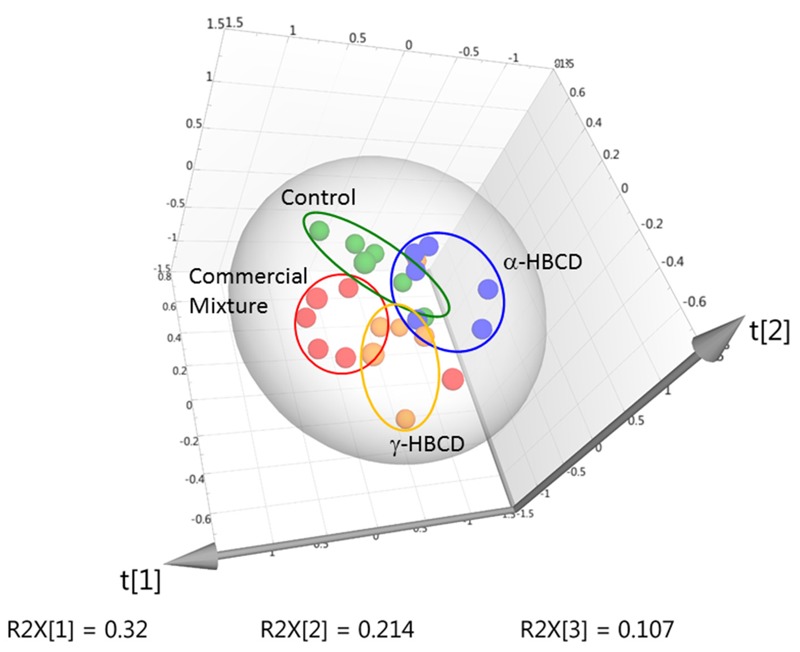
PLS-DA plot of metabolite concentrations derived from serum samples from mice administered vehicle control (green), or high dose (30 mg/kg) CM-HBCD (red), α-HBCD (blue), or γ-HBCD (orange) [R2X = 0.642; R2Y = 0.345; Q2 = –0.186] (n = 6 for all groups).
Discussion
This study aids the promise of metabolomics in predicting developmental outcomes related to early-life exposures to mixtures and individual constituents of CM-HBCD. The impact of α-HBCD, γ-HBCD, and CM-HBCD on serum biochemical profiles 4 days following acute exposure at PND10 was investigated. Metabolite profiles for the HBCD treatment groups were distinct with a few metabolites in common. Based on prior knowledge, selected metabolites differentiated the treatment and dose groups mapped to different biochemical pathways involving energy and amino acid metabolism that were identified, specifically, those metabolites involved with lipid metabolism and tricarboxylic acid (TCA) cycle.
After CM-HBCD exposure, serum glycerol levels increased, an indication of accelerated lipolysis (lipid metabolism and breakdown) (Herrera and Amusquivar 2000). Acetone, a ketone body, was significantly lower in mice treated with 30 mg/kg α-HBCD compared with controls and may be a result of reduced conversion of acetoacetate to acetone further resulting in reduced conversion of acetone to pyruvate (statistically significant at same treatment and dose group), lactate, and acetate (non-statistically significant trend) (Table 1). Other indicators of accelerated lipolysis were seen with non-statistical increased trends in two other ketone bodies, 3-hydroxybutyrate (all treatments; α-HBCD, γ-HBCD, or CM-HBCD) and acetoacetate (α-HBCD treatment only) (see Table S1), further supporting the possible connection between HBCD exposures and accelerated lipolysis. CM-HBCD effects on hepatic glucose and energy metabolism have been previously described in the literature (Cantón et al. 2008; van der Ven et al. 2006). Rat hepatocytes treated 28 days with CM-HBCD altered gene expression that is involved in glucose metabolism (Cantón et al. 2008). Liver glucose and lipid metabolism disturbances are classic hallmarks of obesity (Muoio and Newgard 2006) and chemical exposures during vulnerable windows of development may cause and contribute to this obesity (La Merrill and Birnbaum 2011). In a rat study, CM-HBCD exposure has been shown to suppresses serum TH levels (van der Ven et al. 2006). TH has been suspected to be involved in energy metabolism (Yanagisawa et al. 2014) leading to decreased energy metabolism and weight gain.
Elevated non-statistically significant trends in serum 3-hydroxybutyrate, creatine, and taurine response were a similar biomarker fingerprint profile in α-HBCD, γ-HBCD, and CM-HBCD (Figure 5). The specific biomarker profiles (3-hydroxybutyrate, creatine, and taurine), if observed and validated in subsequent longer duration and alternate species studies, could find use in prediction of HBCD exposure and DNT. 3-Hydroxybutyrate, a ketone body used as energy by the brain when blood glucose is low, is essential during brain development, and increased levels are needed to nourish the brain during times of fasting or energy dysregulation (McKenna et al. 2015; Hawdon 1999). Creatine is important in the CNS, facilitating neurotransmitter release, membrane potential maintenance, Ca2+ homeostasis, and ion gradient restoration (Stockler et al. 2007). Creatine deficiency syndromes have common clinical manifestations, including cognitive dysfunction with mental retardation, poor language skills, and autism spectrum disorders (Mercimek-Mahmutoglu and Salomons 2015; Tarnopolsky and Beal 2001). The observed increase in creatine and increase in o-phosphocholine may be related to effects on the SAM pathway (Brosnan et al. 2011). Taurine crosses the blood–brain barrier and is implicated in inhibitory neurotransmission, long-term potentiation (LTP) in striatum and hippocampus, membrane stabilization, adipose tissue regulation, possible obesity prevention, calcium homeostasis, protection against glutamate excitotoxicity, and epileptic seizure prevention in humans (Wu and Prentice 2010). The presence of 3-hydroxybutyrate, creatine, and taurine metabolites in all HBCD treatment groups may be driven by α-HBCD, considering γ-HBCD’s biological stereoisomerization to α-HBCD (Szabo et al. 2010) and α-HBCD biological stability (Szabo et al. 2011a).
Figure 5.
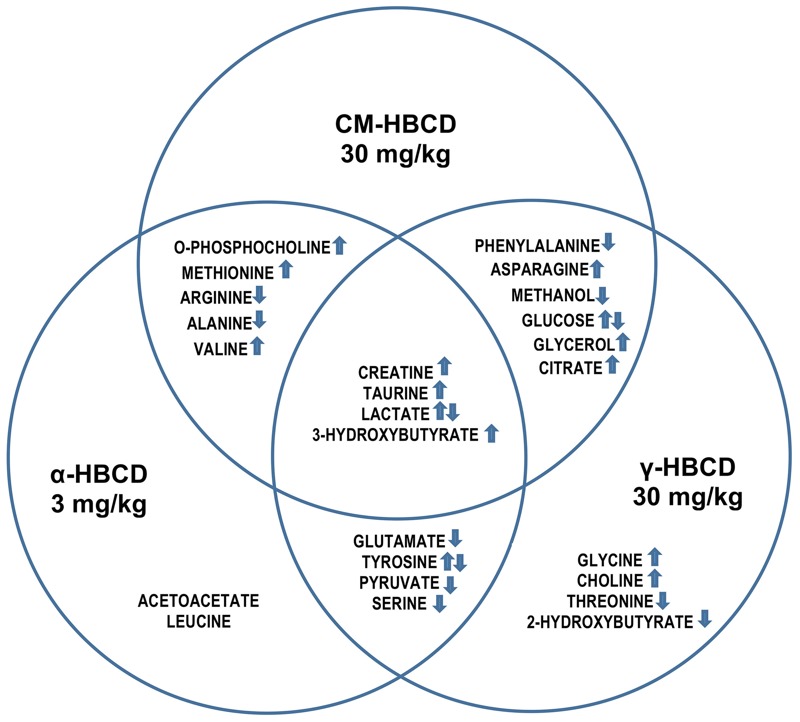
Endogenous serum metabolite increase and decrease after administration of CM-HBCD, α-HBCD, or γ-HBCD at 30 mg/kg, 3 mg/kg and 30 mg/kg, respectively, measured 4 days after an acute dose in infant mice. Contributions of each stereoisomer to the mixture at CM-HBCD relevant ratio ~ 10%:90%::3 mg/kg:30 mg/kg::α-HBCD:γ-HBCD. Arrows indicate metabolites that were consistently increased (↑) or decreased (↓), or that had mixed responses (↑↓).
This metabolomics study also revealed stereoisomer-specific responses, with differences between isomers and their mixture. For α-HBCD, glutamate significantly decreased following mid- and high-dose exposures. The contribution of glutamate to synaptic transmission, plasticity, and development is well established (Morello and Partanen 2015). For γ-HBCD, phenylalanine decreased significantly in both γ-HBCD dose groups. Phenylalanine is an essential amino acid highly concentrated in brain and blood, and the brain uses phenylalanine to produce norepinephrine, a neurotransmitter involved in synaptic transduction (Fernstrom and Fernstrom 2007). Depletion of norepinephrine reduces LTP in dentate gyrus of rat hippocampus (Stanton and Sarvey 1985). Further research is merited to unravel the relationships between phenylalanine, norepinephrine, effects on hippocampus, and LTP.
To determine individual stereoisomer contribution to the commercial mixture effects observed in the literature, ~ 10% alpha (3 mg/kg) and 90% gamma (30 mg/kg) metabolic profiles were compared to the 30 mg/kg CM-HBCD. Of the 15 metabolites differentiating CM-HBCD from the two other treatment-groups, all 15 metabolites are seen to be contributed by either α-HBCD or γ-HBCD, with unique profiles between stereoisomers (Figure 5). This supports the hypothesis that α-HBCD and γ-HBCD individually represent a fraction of CM-HBCD’s response, and both individual stereoisomers elicit specific and unique metabolite effects that differ from one another and with respect to CM-HBCD.
The α-HBCD metabolomics profile raises additional concerns, as α-HBCD is formed by stereoisomerization, bioaccumulates, and is the main stereoisomer in human serum and breast milk (Covaci et al. 2006). The metabolites specific to α-HBCD differentiation by treatment and dose groups from the controls (not observed after exposure to CM-HBCD) included increases in the endogenous metabolites acetoacetate, leucine, and tyrosine and decreases in glutamate, lactate, pyruvate, and serine (Figure 5). Current national risk assessments conducted by the EU, Canada, and Australia used CM-HBCD research investigations to derive regulatory risk values (Aylward and Hays 2011). Based on differences between stereoisomer toxicokinetics, molecular pathway identification, and serum metabolomics responses reported here, we recommend further HBCD stereoisomer-specific studies and generation of α-HBCD-specific human health risk assessment for public health protection.
Since metabolites represent end products of the genome and proteome, metabolomics holds promise of providing an integrated physiological phenotype (Merrick et al. 2011). Combining metabolomics with other omic techniques may contribute to an understanding of biological responses to xenobiotics. However, due to its relative infancy compared with conventional toxicity assays and other omics, metabolomics conducted on environmental chemicals is sparse. With appropriate study design, metabolomics represents an opportunity to better understand the toxicity of environmental chemicals and their impact on human health.
In summary, we investigated the toxicity of CM-HBCD, α-HBCD, and γ-HBCD in neonatal mice using a metabolomics profiling approach. All treatment groups exhibited changes in metabolites involved in aerobic energy metabolism, lipolysis, neurodevelopment, and amino acid metabolism. However, each treatment group clustered and separated from the others, signifying different biological responses to each stereoisomer and the mixture. We demonstrate that metabolomics is a promising approach to uncover differences between individual stereoisomers and their mixture, identify potential biomarkers of effects, and discover potential mechanistic links between HBCD exposures and disease and dysfunction.
Supplemental Material
Footnotes
This work was funded by cooperative agreements by the University of North Carolina and the U.S. Environmental Protection Agency (EPA) (CR833237 predoctoral training grants), and by the intramural research program of the National Cancer Institute (NIH). W.P. and S.S. are both employed by Discovery Sciences, Research Triangle Institute International, Research Triangle Park, North Carolina.
The views expressed in this manuscript are those of the individual authors and do not necessarily reflect the views and policies of the U.S. EPA. Mention of trade names or commercial products does not constitute endorsement or recommendation for use.
The authors declare they have no actual or potential competing financial interests.
References
- Ali N, Dirtu AC, Van den Eede N, Goosey E, Harrad S, Neels H, et al. Occurrence of alternative flame retardants in indoor dust from New Zealand: indoor sources and human exposure assessment. Chemosphere. 2012;88(11):1276–1282. doi: 10.1016/j.chemosphere.2012.03.100. [DOI] [PubMed] [Google Scholar]
- Al-Mousa F, Michelangeli F. The sarcoplasmic-endoplasmic reticulum Ca2+-ATPase (SERCA) is the likely molecular target for the acute toxicity of the brominated flame retardant hexabromocyclododecane (HBCD). Chem Biol Interact. 2014;207:1–6. doi: 10.1016/j.cbi.2013.10.021. [DOI] [PubMed] [Google Scholar]
- Asante KA, Takahashi S, Itai T, Isobe T, Devanathan G, Muto M. Occurrence of halogenated contaminants in inland and coastal fish from Ghana: levels, dietary exposure assessment and human health implications. Ecotoxicol Environ Saf. 2013;94:123–130. doi: 10.1016/j.ecoenv.2013.05.008. [DOI] [PubMed] [Google Scholar]
- Aylward LL, Hays SM. Biomonitoring-based risk assessment for hexabromocyclododecane (HBCD). Int J Hyg Environ Health. 2011;214(3):179–187. doi: 10.1016/j.ijheh.2011.02.002. [DOI] [PubMed] [Google Scholar]
- Beckonert O, Keun HC, Ebbels TM, Bundy J, Holmes E, Lindon JC, et al. Metabolic profiling, metabolomic and metabonomic procedures for NMR spectroscopy of urine, plasma, serum and tissue extracts. Nat Protoc. 2007;2:2692–2703. doi: 10.1038/nprot.2007.376. [DOI] [PubMed] [Google Scholar]
- Brosnan JT, da Silva RP, Brosnan ME. The metabolic burden of creatine synthesis. Amino Acids. 2011;40:1325–1331. doi: 10.1007/s00726-011-0853-y. [DOI] [PubMed] [Google Scholar]
- Cantón RF, Peijnenburg AA, Hoogenboom RL, Piersma AH, van der Ven LT, van den Berg M, et al. Subacute effects of hexabromocyclododecane (HBCD) on hepatic gene expression profiles in rats. Toxicol Appl Pharmacol. 2008;231:267–272. doi: 10.1016/j.taap.2008.04.013. [DOI] [PubMed] [Google Scholar]
- CEC (Commision for Environmental Cooperation) Montreal, Canada: CEC; 2015. Enhancing Trilateral Understanding of Chemicals in Products in North America. http://www.cec.org/our-work/projects/enhancing-trilateral-understanding-chemicals-products-north-america [accessed 29 January 2017] [Google Scholar]
- Covaci A, Gerecke AC, Law RJ, Voorspoels S, Kohler M, Heeb NV, et al. Hexabromocyclododecanes (HBCDs) in the environment and humans: a review. Environ Sci Technol. 2006;40(12):3679–3688. doi: 10.1021/es0602492. [DOI] [PubMed] [Google Scholar]
- EC (European Commission, Scientific Committee on Health and Environmental Risks) Luxembourg: Office for Official Publications of the European Communities; 2008. Scientific Committe on Health and Environmental Risks (SCHER). Risk Assessment Report on Hexabomocyclododecane, Environmental Part. CAS No. 25637-99-4, EINECS No. 247-148-4. http://ec.europa.eu/health/ph_risk/committees/04_scher/docs/scher_o_093.pdf [accessed 24 September 2015] [Google Scholar]
- ECHA (European Chemicals Agency) Helsinki, Finland: ECHA; 2009. Data on Manufacture, Import, Export, Uses and Releases of HBCDD as Well as Information on Potential Alternatives to Its Use. ECHA/2008/2. http://echa.europa.eu/documents/10162/13640/tech_rep_hbcdd_en.pdf [accessed 24 September 2015] [Google Scholar]
- Eljarrat E, Gorga M, Gasser M, Díaz-Ferrero J, Barceló D. Dietary exposure assessment of Spanish citizens to hexabromocyclododecane through the diet. J Agric Food Chem. 2014;62:2462–2468. doi: 10.1021/jf405007x. [DOI] [PubMed] [Google Scholar]
- Ema M, Fujii S, Hirata-Koizumi M, Matsumoto K. Two-generation reproductive toxicity study of the flame retardant hexabromocyclododecane in rats. Reprod Toxicol. 2008;25:335–351. doi: 10.1016/j.reprotox.2007.12.004. [DOI] [PubMed] [Google Scholar]
- Eriksson L, Byrne T, Johansson E, Trygg J, Vikström C. Malmö, Sweden: Umetrics Academy; 2013. Multi- and Megavariate Data Analysis Basic Principles and Applications. [Google Scholar]
- Eriksson P, Fischer C, Wallin M, Jakobsson E, Fredriksson A. Impaired behaviour, learning and memory, in adult mice neonatally exposed to hexabromocyclododecane (HBCDD). Environ Toxicol Pharmacol. 2006;21:317–322. doi: 10.1016/j.etap.2005.10.001. [DOI] [PubMed] [Google Scholar]
- Fernstrom JD, Fernstrom MH. Tyrosine, phenylalanine, and catecholamine synthesis and function in the brain. J Nutr. 2007;137(6) suppl 1:1539S–1547S. doi: 10.1093/jn/137.6.1539S. [DOI] [PubMed] [Google Scholar]
- Fromme H, Hilger B, Kopp E, Miserok M, Völkel W. Polybrominated diphenyl ethers (PBDEs), hexabromocyclododecane (HBCD) and “novel” brominated flame retardants in house dust in Germany. Environ Int. 2014;64:61–68. doi: 10.1016/j.envint.2013.11.017. [DOI] [PubMed] [Google Scholar]
- Hakk H, Szabo DT, Huwe J, Diliberto J, Birnbaum LS. Novel and distinct metabolites identified following a single oral dose of α- or γ-hexabromocyclododecane in mice. Environ Sci Technol. 2012;46:13494–13503. doi: 10.1021/es303209g. [DOI] [PMC free article] [PubMed] [Google Scholar]
- Hawdon JM. Hypoglycaemia and the neonatal brain. Eur J Pediatr. 1999;158:S9–S12. doi: 10.1007/pl00014319. [DOI] [PubMed] [Google Scholar]
- Heeb NV, Schweizer WB, Kohler M, Gerecke AC. Structure elucidation of hexabromocyclododecanes—a class of compounds with a complex stereochemistry. Chemosphere. 2005;61:65–73. doi: 10.1016/j.chemosphere.2005.03.015. [DOI] [PubMed] [Google Scholar]
- Herrera E, Amusquivar E. Lipid metabolism in the fetus and the newborn. Diabetes Metab Res Rev. 2000;16:202–210. doi: 10.1002/1520-7560(200005/06)16:3<202::aid-dmrr116>3.0.co;2-#. [DOI] [PubMed] [Google Scholar]
- Kalachova K, Hradkova P, Lankova D, Hajslova J, Pulkrabova J. Occurrence of brominated flame retardants in household and car dust from the Czech Republic. Sci Total Environ. 2012;441:182–193. doi: 10.1016/j.scitotenv.2012.09.061. [DOI] [PubMed] [Google Scholar]
- Kiciński M, Viaene MK, Den Hond E, Schoeters G, Covaci A, Dirtu AC, et al. 2012. Neurobehavioral function and low-level exposure to brominated flame retardants in adolescents: a cross-sectional study. Environ Health 11 86, doi: 10.1186/1476-069X-11-86 [DOI] [PMC free article] [PubMed] [Google Scholar]
- La Merrill M, Birnbaum LS. Childhood obesity and environmental chemicals. Mt Sinai J Med. 2011;78:22–48. doi: 10.1002/msj.20229. [DOI] [PMC free article] [PubMed] [Google Scholar]
- McKenna MC, Scafidi S, Robertson CL. Metabolic alterations in developing brain after injury: knowns and unknowns. Neurochem Res. 2015;40:2527–2543. doi: 10.1007/s11064-015-1600-7. [DOI] [PMC free article] [PubMed] [Google Scholar]
- Mercimek-Mahmutoglu S, Salomons GS. Seattle, WA: University of Washington, Seattle, 2009; 2015. Creatine deficiency syndromes. In: Gene Reviews. Pagon RA, Adam MP, Ardinger HH, Wallace SE, Amemiya A, Bean LJH, et al., eds. [Google Scholar]
- Merrick BA, London RE, Bushel PR, Grissom SF, Paules RS. Platforms for biomarker analysis using high-throughput approaches in genomics, transcriptomics, proteomics, metabolomics, and bioinformatics. IARC Sci Publ. 2011;163:121–142. [PubMed] [Google Scholar]
- Miller-Rhodes P, Popescu M, Goeke C, Tirabassi T, Johnson L, Markowski VP. Prenatal exposure to the brominated flame retardant hexabromocyclododecane (HBCD) impairs measures of sustained attention and increases age-related morbidity in the Long-Evans rat. Neurotoxicol Teratol. 2014;45:34–43. doi: 10.1016/j.ntt.2014.06.009. [DOI] [PubMed] [Google Scholar]
- Morello F, Partanen J. 2015. Diversity and development of local inhibitory and excitatory neurons associated with dopaminergic nuclei. FEBS Letters 589 24 Pt A 3693 3701, doi: 10.1016/j.febslet.2015.10.001 [DOI] [PubMed] [Google Scholar]
- Muoio DM, Newgard CB. Obesity-related derangements in metabolic regulation. Annu Rev Biochem. 2006;75:367–401. doi: 10.1146/annurev.biochem.75.103004.142512. [DOI] [PubMed] [Google Scholar]
- Ni HG, Zeng H. HBCD and TBBPA in particulate phase of indoor air in Shenzhen, China. Sci Total Environ. 2013;1:458–460. doi: 10.1016/j.scitotenv.2013.04.003. [DOI] [PubMed] [Google Scholar]
- Pathmasiri W, Pratt KJ, Collier ND, Lutes LD, McRitchie S, Sumner SCJ. Integrating metabolomic signatures and psychosocial parameters in responsivity to an immersion treatment model for adolescent obesity. Metabolomics. 2012;8:1037–1051. [Google Scholar]
- Rasinger JD, Carroll TS, Lundebye AK, Hogstrand C. Cross-omics gene and protein expression profiling in juvenile female mice highlights disruption of calcium and zinc signalling in the brain following dietary exposure to CB-153, BDE-47, HBCD or TCDD. Toxicology. 2014;321:1–12. doi: 10.1016/j.tox.2014.03.006. [DOI] [PubMed] [Google Scholar]
- Rawn DF, Gaertner DW, Weber D, Curran IH, Cooke GM, Goodyer CG. Hexabromocyclododecane concentrations in Canadian human fetal liver and placental tissues. Sci Total Environ. 2014;469:622–629. doi: 10.1016/j.scitotenv.2013.08.014. [DOI] [PubMed] [Google Scholar]
- Roze E, Meijer L, Bakker A, Van Braeckel KN, Sauer PJ, Bos AF. 2009. Prenatal exposure to organohalogens, including brominated flame retardants, influences motor, cognitive, and behavioral performance at school age. Environ Health Perspect 117 1953 1958, doi: 10.1289/ehp.0901015 [DOI] [PMC free article] [PubMed] [Google Scholar]
- Saegusa Y, Fujimoto H, Woo GH, Inoue K, Takahashi M, Mitsumori K, et al. Developmental toxicity of brominated flame retardants, tetrabromobisphenol A and 1,2,5,6,9,10-hexabromocyclododecane, in rat offspring after maternal exposure from mid-gestation through lactation. Reprod Toxicol. 2009;28:456–467. doi: 10.1016/j.reprotox.2009.06.011. [DOI] [PubMed] [Google Scholar]
- Shoeib M, Harner T, Webster GM, Sverko E, Cheng Y. Legacy and current-use flame retardants in house dust from Vancouver, Canada. Environ Pollut. 2012;169:175–182. doi: 10.1016/j.envpol.2012.01.043. [DOI] [PubMed] [Google Scholar]
- Stanton PK, Sarvey JM. Depletion of norepinephrine, but not serotonin, reduces long-term potentiation in the dentate gyrus of rat hippocampal slices. J Neurosci. 1985;5:2169–2176. doi: 10.1523/JNEUROSCI.05-08-02169.1985. [DOI] [PMC free article] [PubMed] [Google Scholar]
- Stockler S, Schutz PW, Salomons GS. Cerebral creatine deficiency syndromes: clinical aspects, treatment and pathophysiology. Subcell Biochem. 2007;46:149–166. doi: 10.1007/978-1-4020-6486-9_8. [DOI] [PubMed] [Google Scholar]
- Sumner SC, Fennell TR, Snyder RW, Taylor GF, Lewin AH. Distribution of carbon-14 labeled C60 ([14C]C60) in the pregnant and in the lactating dam and the effect of C60 exposure on the biochemical profile of urine. J Appl Toxicol. 2010;30:354–360. doi: 10.1002/jat.1503. [DOI] [PubMed] [Google Scholar]
- Szabo DT, Diliberto JJ, Hakk H, Huwe JK, Birnbaum LS. Toxicokinetics of the flame retardant hexabromocyclododecane gamma: effect of dose, timing, repeated exposure and metabolism. Toxicol Sci. 2010;117:282–293. doi: 10.1093/toxsci/kfq183. [DOI] [PubMed] [Google Scholar]
- Szabo DT, Diliberto JJ, Hakk H, Huwe JK, Birnbaum LS. Toxicokinetics of the flame retardant hexabromocyclododecane alpha: effect of dose, timing, repeated exposure and metabolism. Toxicol Sci. 2011a;121:234–244. doi: 10.1093/toxsci/kfr059. [DOI] [PubMed] [Google Scholar]
- Szabo DT, Diliberto JJ, Huwe JK, Birnbaum LS. Differences in tissue distribution of HBCD alpha and gamma between adult and developing mice. Toxicol Sci. 2011b;123:256–263. doi: 10.1093/toxsci/kfr161. [DOI] [PubMed] [Google Scholar]
- Tarnopolsky MA, Beal MF. Potential for creatine and other therapies targeting cellular energy dysfunction in neurological disorders. Ann Neurol. 2001;49:561–574. [PubMed] [Google Scholar]
- Trygg J, Holmes E, Lundstedt T. Chemometrics in metabonomics. J Proteome Res. 2007;6:469–479. doi: 10.1021/pr060594q. [DOI] [PubMed] [Google Scholar]
- U.S. EPA (U.S. Environmental Protection Agency) Washington, DC: U.S. EPA; 2014a. Flame Retardant Alternatives to Hexabromocyclododecane (HBCD). Final Report. EPA 740R14001. https://www.epa.gov/sites/production/files/2014-06/documents/hbcd_report.pdf [accessed 29 January 2017] [Google Scholar]
- U.S. EPA. Toxic Release Inventory (TRI) Program. TRI-Listed Chemicals. 2014b http://www2.epa.gov/toxics-release-inventory-tri-program/tri-listed-chemicals [accessed 29 January 2017]
- U.S. EPA. Washington, DC: U.S. EPA; 2015. IRISTrack Detailed Report. http://cfpub.epa.gov/ncea/iristrac/index.cfm?fuseaction=viewChemical.showChemical&sw_id=1102 [accessed on 24 September 2015] [Google Scholar]
- van der Ven LT, Verhoef A, van der Kuil T, Slob W, Leonards PE, Visser TJ, et al. A 28-day oral dose toxicity study enhanced to detect the endocrine effects of hexabromocyclododecane in Wister rats. Toxicol Sci. 2006;94:281–292. doi: 10.1093/toxsci/kfl113. [DOI] [PubMed] [Google Scholar]
- Weljie AM, Newton J, Mercier P, Carlson E, Slupsky CM. Targeted profiling: quantitative analysis of 1H NMR metabolomics data. Anal Chem. 2006;78:4430–4442. doi: 10.1021/ac060209g. [DOI] [PubMed] [Google Scholar]
- Wu JY, Prentice H 2010. Role of taurine in the central nervous system. J Biomed Sci 24 17(suppl 1) S1, doi: 10.1186/1423-0127-17-S1-S1 [DOI] [PMC free article] [PubMed] [Google Scholar]
- Yanagisawa R, Koike E, Win-Shwe TT, Yamamoto M, Takano H. 2014. Impaired lipid and glucose homeostasis in hexabromocyclododecane-exposed mice fed a high-fat diet. Environ Health Perspect 122 277 283, doi: 10.1289/ehp.1307421 [DOI] [PMC free article] [PubMed] [Google Scholar]
Associated Data
This section collects any data citations, data availability statements, or supplementary materials included in this article.