Abstract
Drug-induced QT prolongation leads to life-threatening cardiotoxicity, mostly through blockage of the human ether-a-go-go-related gene (hERG) encoded potassium ion (K+) channels. The hERG channel is one of the most important antitargets to be addressed in the early stage of drug discovery process, in order to avoid more costly failures in the development phase. Using a thallium flux assay, 4,323 molecules were screened for hERG channel inhibition in a quantitative high throughput screening (qHTS) format. Here, we present support vector classification (SVC) models of hERG channel inhibition with the averaged area under the receiver operator characteristics curve (AUC-ROC) of 0.93 for the tested compounds. Both Jackknifing and bootstrapping have been employed to rebalance the heavily biased training datasets, and the impact of these two under-sampling rebalance methods on the performance of the predictive models is discussed. Our results indicated that the rebalancing techniques did not enhance the predictive power of the resulting models; instead, adoption of optimal cutoffs could restore the desirable balance of sensitivity and specificity of the binary classifiers. In an external validation set of 66 drug molecules, the SVC model exhibited an AUC-ROC of 0.86, further demonstrating the utility of this modeling approach to predict hERG liabilities.
Keywords: hERG, support vector classification, ROC, jackknife, bootstrap, rebalance
Introduction
The human ether-à-go-go-related gene (hERG), a member of voltage-gated potassium ion (K+) channel (Kv), was first identified and cloned in 1994.[1] The name of hERG is frequently used to refer to the channel protein, whereas the official gene name of the hERG channel is KCNH2, and Kv11.1 refers to the fully assembled channels.[2] The hERG channels are mainly expressed in the heart and play a critical role in the electrical activity of the heart that coordinates the heart’s beating. Four hERG proteins can assemble to form a pore structure, facilitating diffusion of K+ across cell membrane to repolarize cardiomyocytes. The tetrameric hERG channels are responsible for the rapid delayed rectifier current (IKr). Undesirable blockade of hERG K+ channels by drug molecules may cause acquired long QT syndrome (aLQTS), potentially leading to a particular type of arrhythmia, Torsades de pointe (Tdp), a severe life-threatening cardiac side effect. Since 1999, several popular non-cardiovascular blockbuster drugs, including antihistamine drugs terfenadine and astemizole, serotonin agonist cisapride, and psychotropic agents Haloperidol and droperidol, have been withdrawn from the market due to cardiotoxicity associated with hERG channel inhibition.[3] The situation led to the publication of a guideline by the FDA on International Conference on Harmonization (ICH), recommending that drug candidates destine for human use be evaluated for potential hERG activity.[4] Consequently, early evaluation of the hERG activities of the drug molecules in the pipeline has been widely adopted by pharmaceutical companies, in order to weed out those compounds potentially interacting with the hERG channel as early as possible.
Experimental determination of blockage of hERG channel includes in vivo telemetry experiments on non-rodent animals and in vitro whole-cell patch-clamp electrophysiology.[5] Both in vivo and in vitro methods are expensive and time consuming, not suitable for evaluation of large quantity of compounds in the early stage of discovery phase. The situation calls for more efficient ways, such as in silico predictive models, to estimate hERG-related cardiotoxicity.
An X-ray crystallography structure of hERG has not been determined, so structural analysis for hERG is largely based on homology models and mutagenesis studies.[6] A comparison of structures of different potassium channels revealed a considerable conformational variation despite similar secondary structures and pore architecture,[7] which casted a shadow on homology modeling approaches. In addition, the hERG ion channel is predicted to be very flexible, since the transmembrane pore domain, with which the drugs presumably interact, is formed by non-covalent tetramerization of four units of hERG proteins. The flexibility and adaptability of the hERG ligand binding site is reflected by its capability of accommodating a wide spectrum of structurally diverse compounds.[8] Presumably, the future availability of the crystal structure of the hERG channel might create more questions than answers, resembling the case of CYP450 3A4.[9] Therefore, ligand-based hERG predictive models are expected to be more practical and reliable than structure-based approaches.
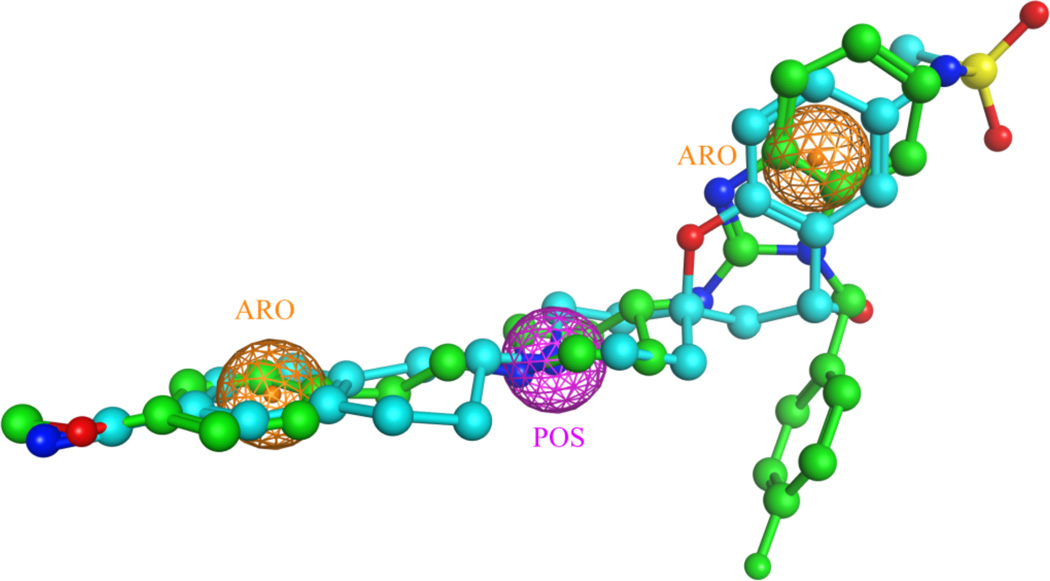
Pharmacophore models have been successful in capturing the chemical features shared by highly potent hERG inhibitors, such as MK-499 and astemizole (Figure 1), but it remains a challenge to characterize a few pharmacopheric features to identify weak hERG inhibitors.[10] Compounds with weak hERG activity at µM range should be flagged for their potential to trigger cardiotoxicity, especially when accidentally over-dosed.
Figure 1.
A three-feature pharmacophore model for the hERG blockers, MK499 (colored in cyan) and astemizole (colored in green). The crystal structure of astemizole was retrieved from the Cambridge Structural Database (CSD), to which the structure of MK499 was superposed by using Flexible Alignment in the MOE. The three consensus pharmacopheric features are one positive charge center (POS, colored in purple), and two aromatic centers (ARO, colored in orange).
Since the hERG K+ channel, unlike other ion channels, can interact with a broad spectrum of structurally diverse compounds,[11] quantitative structure-activity relationships (QSAR), which enable the decipher of detailed structural features shared by the hERG blockers, represent a suitable tool for prediction of hERG liability. Most of QSAR models published so far are either based on small training sets containing tens to hundreds of compounds,[12] or trained on larger data sets compiled from multiple sources, such as those from the CHEMBL.[13] Since data quality and data integrity determine the performance of QSAR models, it is not recommended to compile datasets from different laboratories, especially for in vivo and in vitro data, such as the hERG activity data.[14] For example, large variations in hERG potencies have been reported for the same compound measured by using different cell lines.[15] In this study, we constructed QSAR models on the basis of a large set of compounds with their hERG activities measured in the same laboratory by following the same protocol.
Dataset
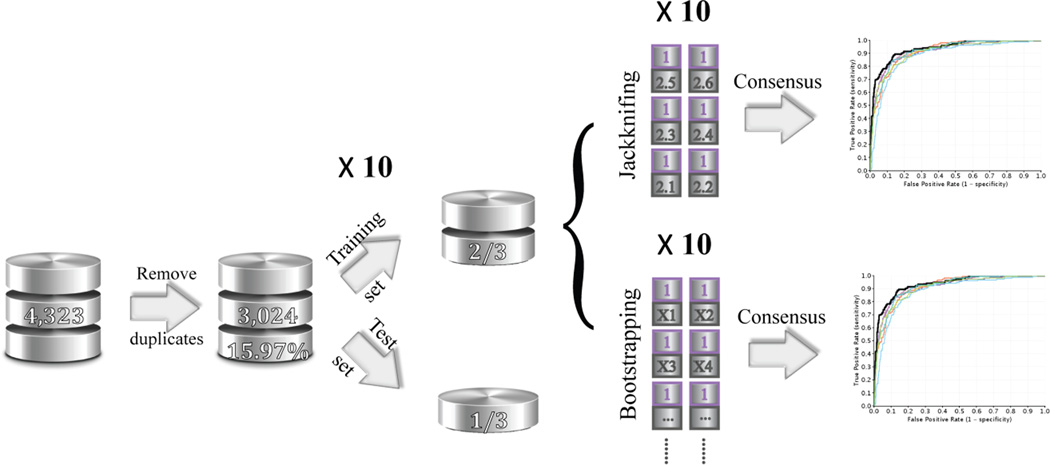
Patch clamp is the primary technique for in vitro measurement of hERG activity, however, it is resource demanding. One high-throughput alternative is to detect inhibition of the hERG channels by measuring flow of a surrogate ion, thallium, in a homogenous assay format.[16] The thallium flux assay was comprehensively validated for its capability of identifying small molecules with potential to block hERG and induce LQTS.[17] Using U2OS cells, 4,323 small molecules were screened for hERG channel inhibition at concentrations ranging from 10nM to 46uM in a quantitative high throughput screening (qHTS) format.[18] Curve fitting is based on a grid method, and curve classes are in turn assigned according to the type of concentration–response curves observed.[19] The collection is of great pharmaceutical interest, consisting of the marketed drugs, drugs that have reached clinical trials, and other bioactive molecules.[20] Compounds with curve class −1.1, −1.2, −2.1 or −2.2, and with > 50% efficacy in an inhibition assay were defined as active, whereas compounds with class 4 curves were defined as inactive.[19b] Compounds with other curve classes were considered inconclusive and excluded from the final dataset. The remaining compounds were processed through a Pipeline Pilot[21] protocol to remove salts, duplicates, and organometallic compounds. Sixty six compounds were plated as inter-plate replicate controls and measured 3 times, and only 4 inconsistent categorizations were observed. Preprocess of the dataset resulted in a 3,024–compound non-redundant dataset, with 15.95% identified as hERG blockers (Figure 2).
Figure 2.
The flowchart to elucidate the data preparation, training and test sets selection, and model construction using two different under-sampling consensus approaches. The cleansed hERG dataset contains 3,024 non-redundant drug-like molecules with 15.97% hERG positive compounds. The dataset was randomly split into a training set, consisting of two thirds of the total compounds, and a test set, with the remaining one third compounds. All the experiments are repeated ten times.
The preprocessed data sets were randomly split into training (2/3) and test (1/3) sets by using two different methods: 1. the whole dataset was randomly split in a 2-to-1 ratio for ten times, resulting in the percentage of the hERG active compounds being 16.23 ± 0.53% for the ten training sets and 15.43 ± 1.06% for the test sets (CV_1 sets). 2. 2/3 of the compounds were randomly selected from both the hERG active and the hERG inactive collections separately to be combined into the new training sets, and the remaining compounds comprised the test sets. (CV_2 sets).
Molecular Descriptors
An optimized atom-type-based molecular descriptor system consisting of 221 atom types and 41 correction factors was employed to construct the QSAR models for hERG liabilities. The details of the molecular descriptors have been elaborated elsewhere.[14, 22] The same descriptors have been successfully applied in modeling various physicochemical and ADMET properties.[8, 22–23]
Support vector classification (SVC)
SVC is an elegant machine learning algorithm that was originally developed to solve two-class classification problems.[24] SVC has been proven to outperform other machine learning methods because of its outstanding generalization capability.[25]
The parameterization of the penalty for misclassification, C, and the non-linearity parameter in the kernel function of a Gaussian Radial Basis Function (RBF), γ, was accomplished on a grid-based search to minimize the mean standard error (MSE) of 5-fold cross-validation (CV) on the training data. LIB-SVM, a software implementation of SVM developed by Chang and Lin,[26] was recruited in this the study.
Results and Discussion
Predictive toxicology in drug discovery
As the most important anti-target in drug discovery, the hERG channels have received extraordinary attention, and many efforts have been made to understand and determine potential hERG-drug interactions.
For the last two decades, the gold standard for toxicity evaluation has been in vivo toxicology, where the compound is formulated and dosed against rodents or other animals.[27] The limitations of in vivo testing, including ethical issues in animal use, low throughput, high demands on time, cost, and other resources, large variation among individual animals, and poor extrapolability to humans, have created a strong demand for alternative strategies of toxicity assessment.[28] To advance the state of toxicity testing, the US Tox21 program has initiated a paradigm shift in toxicity testing of chemical compounds from traditional in vivo tests to less expensive and higher-throughput cell-based assays, in order to identify key pathways and proteins linked with toxicity end points.[29] The goal of the US Tox21 program is to accelerate the development of mechanism-based in vitro screens to better understand the mechanisms of toxicity and to reduce the use of low-throughput, high-cost traditional toxicity testing relied on animal models.[30] In recent years, the qHTS technique has achieved a favorable balance between the quality of the assay results and the quantity of the compounds being screened, which lays a solid foundation for computational toxicology.[29b]
Early and accurate in silico toxicity predictions are highly desirable to identify and reject potentially toxic drug candidates. So far, predictive toxicology is mostly based on either human knowledge, or target protein structures, or small molecule ligand structures. DEREK Nexus (formerly DEREK, Deductive Estimation of Risk from Existing Knowledge, http://www.lhasalimited.org/products/derek-nexus.htm) is a widely used knowledge-based expert system for toxicity predictions.[31] Development of rules in DEREK is peer-reviewed, covering a broad spectrum of toxicological endpoints ranging from mutagenicity and carcinogenicity to skin sensitization. DEREK issues structural alerts on the basis of substructures. Even though structural alerts are routinely applied by medicinal chemists to flag functional groups in drug molecules that are frequently linked with toxicity, many of them have not been thoroughly validated with relevant data.[32] A retrospective analysis of structural alerts in the 68 drugs which were recalled or associated with a black-box-warning and those in the 200 top-selling drugs of 2009 indicated that firing red flags using structural alerts might be over exaggerated.[33] About 80% of the 68 drugs contain at least one structural alert, but half of the 200 top-selling drugs, including Lipitor® and Plavix®, also carry one or more structural alerts.[33] Therefore, the easy-to-implement structural alerts are suitable for providing a pragmatic warning to potential idiosyncratic toxic risks of drug compounds, but should not be employed to eliminate compounds from the drug discovery pipelines.
Since the structure of the hERG has not been experimentally determined, homology models have been employed in structure-based approaches to predict the binding affinities of small molecules.[34] Structural flexibility of the tetrameric hERG channels and limited knowledge on the hERG-drug molecular recognition patterns restrict the usage of structure-based predictions of hERG liability. Therefore, QSAR and machine learning have become the mainstream in estimation of hERG activity.
Most of the QSAR models published so far are classification models.[10, 35] The training sets vary from tens to a few thousands of compounds, where large datasets are either compilation of literature data, such as ChEMBL,[13b, 36] or corporate datasets off the public domain.[8, 37] In this study, we presented a 3,024 non-redundant hERG dataset, consisting of the marketed drugs, drug candidates reaching the clinical trials, and other bioactive compounds. This dataset is not only the largest hERG data measured in the same laboratory by following the same protocols, but also of the greatest pharmaceutical interests due to its broad coverage of the drug molecules in clinical trials. Except for the limited coverage of phosphorus-containing molecules (only one atom type of phosphorus was represented in the dataset), the compounds in this dataset assume a full coverage of 57 types of nitrogen and 7 type of hydrogen, 87 out of 88 types of carbon, 29 out of 31 types of oxygen, and 22 out of 24 types of Sulphur. Decomposing molecules to functional groups or atom types greatly expand the coverage of chemical space represented by limited number of organic compounds.
Impact of physicochemical properties on hERG activity
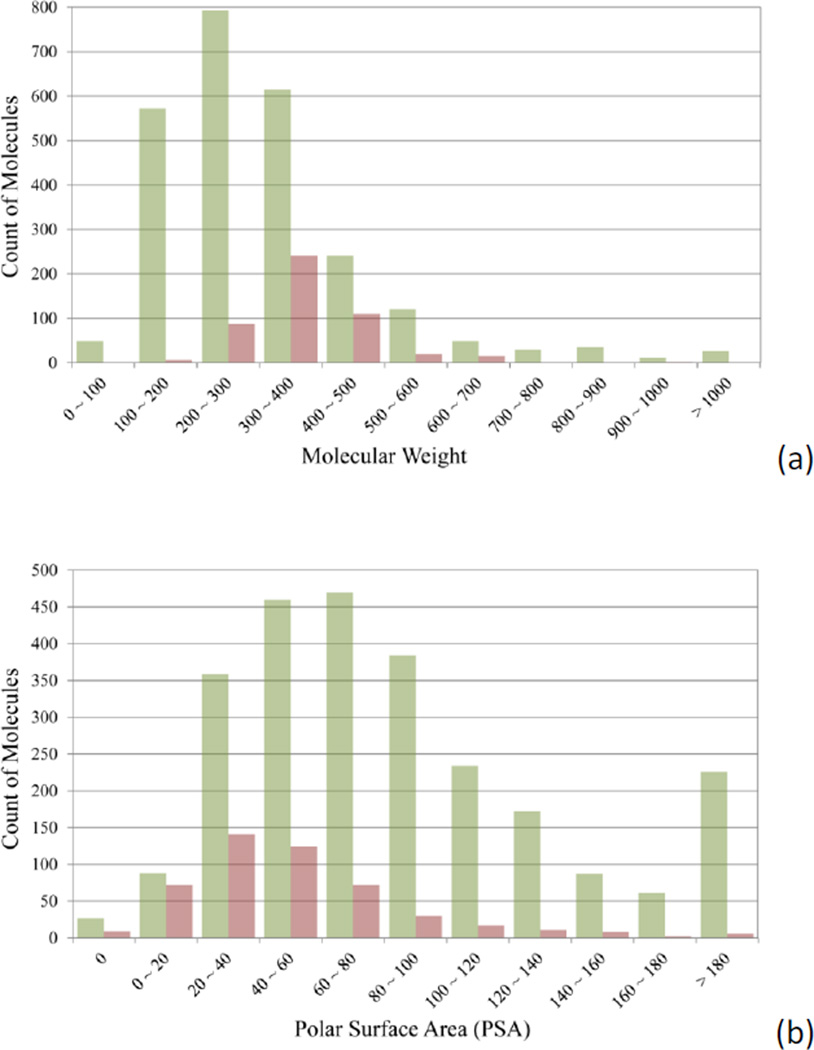
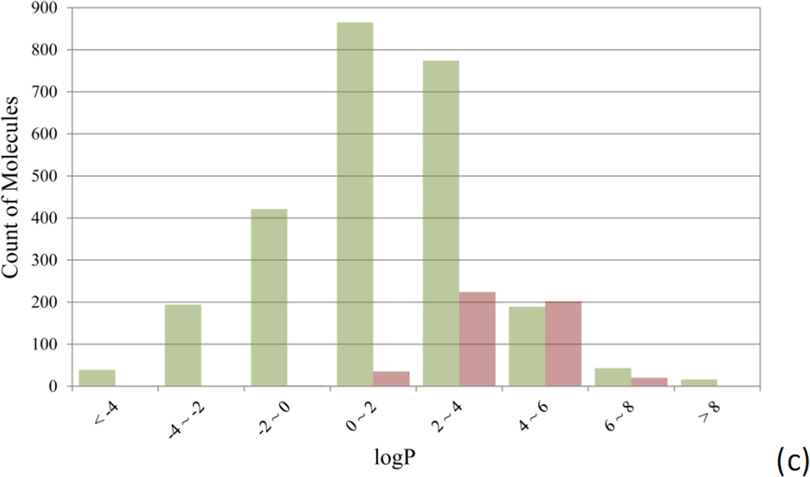
Figure 3 compares the distributions of hERG non-blockers and hERG blockers over three physicochemical properties, molecular weight (MW), polar surface area (PSA), and logP. PSA was calculated with Pipeline Pilot, and logP was computed by using a non-linear regression model developed in-house.[14]
Figure 3.
Comparison of the distributions of hERG non-blockers (green bars) and blockers (red bars) against (a) molecular weight, (b) polar surface area, and (c) logP.
Low MW molecules have a lower tendency to inhibit hERG channels than heavy ones (Figure 3a). Only 6 out of 627 compounds (0.97%) with MW less than 200 are found hERG active, whereas the hERG active rate increases to 6.18% and 14.14% for the compounds with a MW up to 300 and 400. The hERG active rate reaches its peak of 28.15% when the MW falls between 300 and 400. About half of the hERG blockers have a polar surface area (PSA) of 44.0 Å2 or less, while 78.91% of hERG non-blockers have a PSA larger than 44.0 Å2. Most of (88.20%) the hERG active compounds are concentrated on a narrow range of logP values between 2.0 and 6.0 (Figure 3c). Only 37 out of 1556 compounds with the calculated logP value lower than 2.0 are hERG blockers. Interestingly, the distributions of MW, PSA, and logP for the hERG blockers heavily overlap with those of the well-absorbed drugs, from which the “rule of 5” was derived.[38] The observation implies that the ligand-binding sites of the hERG ion channels favor the drug-like molecules, and in turn explains why so many drug molecules encountered hERG-related cardiotoxicity.[3a]
Selection of training and test sets
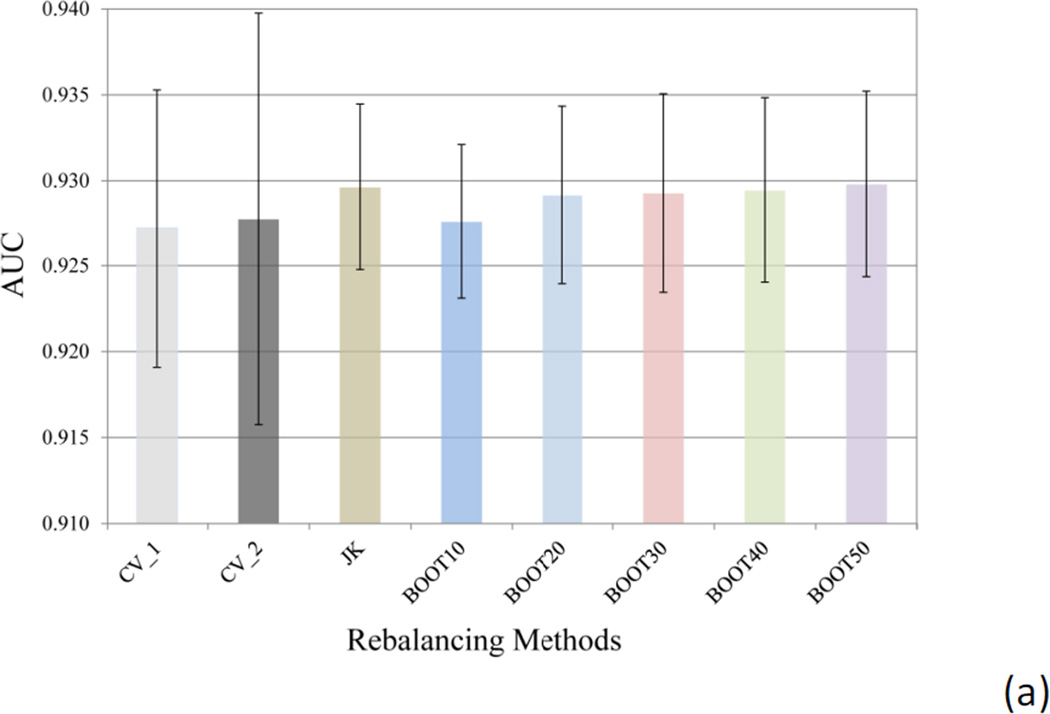
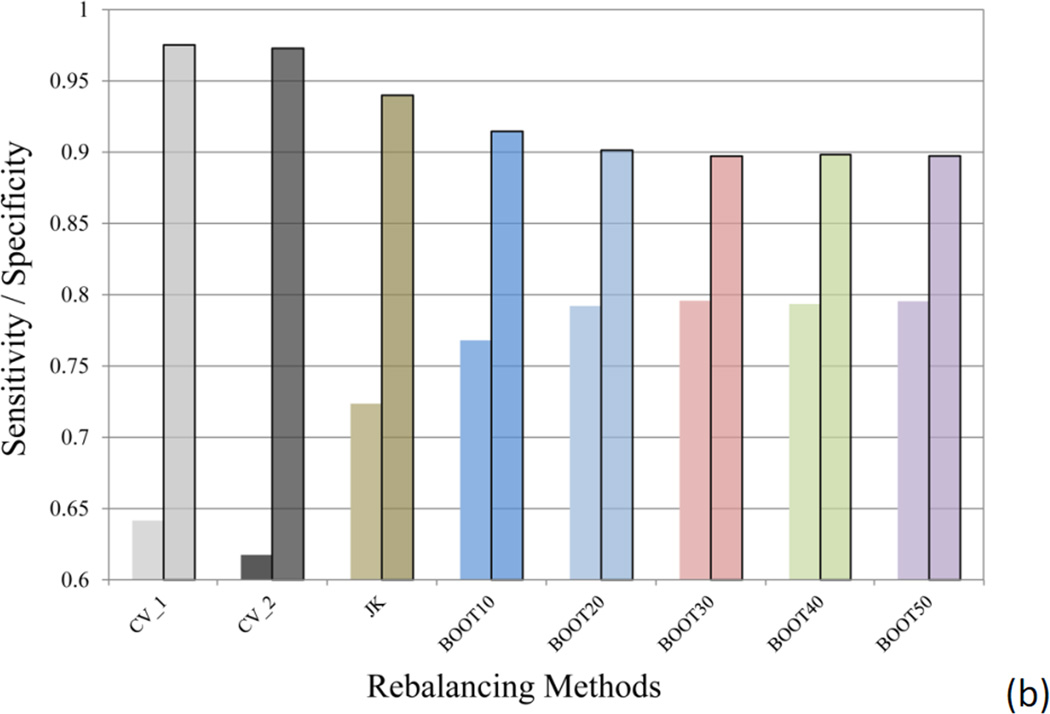
Two methods have been applied to split the dataset into the training and test sets: CV_1 method, where the whole dataset was randomly divided in 2:1 ratio, with the major portion training the model to predict the test set in the minor portion; and CV_2 method, where the hERG active and inactive data were separately split in 2:1 ratio in a random manner, followed by combining the majorities of hERG actives and inactives into the training set and the minorities to test set. Both CV_1 and CV_2 methods were repeated 10 times. The ratio of the hERG active compounds in the CV_1 experiment was averaged to 16.23 ± 0.53% for the ten training sets and 15.43 ± 1.06% for the test sets, only slightly deviating from the 15.97% hERG active ratio in the original dataset. For large datasets, such as the hERG data in this study, random division provided reasonable separation reflecting the active ratio in the original dataset, even though the dataset is severely imbalanced. The averaged predictive performance of the CV_1 models is comparable to that of the CV_2 models, as measured by the area under the curve (AUC) of the receiver operating characteristic (ROC) curve (Figure 4a). The AUC of ROC for the ten CV_1 models averaged 0.927 ± 0.008, which was very close to that of CV_2 models (0.928 ± 0.012). Similar conclusion can be drawn by comparing the averaged sensitivity and specificity values of CV_1 and CV_2 models (Figure 4b). Therefore, random division of training and test sets of a large dataset is a simplified yet reasonable choice, as judged by predictive power of the resulting models.
Figure 4.
(a) The averaged area under the curve (AUC) of the 10 receiver operating characteristic (ROC) curves, and (b) the averaged sensitivity and specificity (semi-transparent boxed bars) values for the models using different methods to select training and test sets (CV_1 and CV_2) and the models built with different rebalancing techniques (Jackknifing and bootstrapping). The error bars in (a) indicate the standard deviation (SD) of the AUC values of the ten SVC models.
Rebalancing the heavily skewed training data
The hERG dataset was severely imbalanced with majority of compounds being hERG inactive. Two commonly used rebalancing techniques are over-sampling and under-sampling. Over-sampling, where the incidents in the minority class are randomly duplicated to reach a full balance against the majority class, has proved to produce little or no improvement on the predictive power of the model in many cases,[39] thence this study will focus on under-sampling technique.
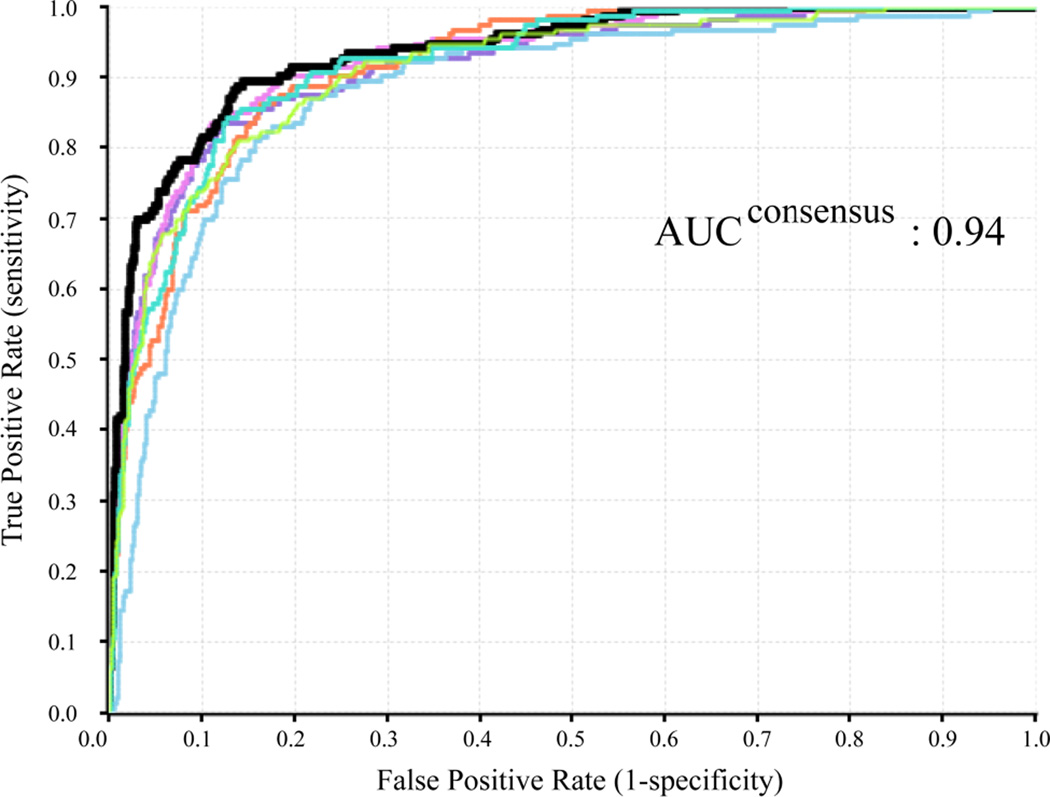
Jackknifing and bootstrapping methods were employed in under-sampling strategy to rebalance the heavily skewed hERG training data, and the ensemble models, instead of individual models, were reported in both cases. In Jackknifing under-sampling, the majority class, hERG inactives, was randomly divided into six equal-sized subgroups, and each subgroup was combined with the entire minority class to generate six training sets. Averaging the predicted probabilities of the compounds in the test set being hERG active produced the final prediction. The ensemble Jackknifing under-sampling was repeated for 10 times in this study. Figure 5 displays the ROC curves for the hERG predictions of the test set compounds using the six under-sampling classifiers in a single Jackknifing experiment, in comparison with the consensus ROC curve, shown in black thick curve. The consensus model outperformed the individual under-sampling models.
Figure 5.
The ROC curves of the six under-sampling hERG classifiers (colored curves) and the ROC curve of the consensus model (black thick curve) from a single Jackknifing experiment.
Judging from the AUC values, the Jackknifing under-sampling only slightly improved predictive power (Figure 4a). However, the specificity of the Jackknifing consensus models increased from 64.2 ± 5.0% (CV_1) to 72.4 ± 4.3%, whereas the sensitivity decreased from 97.5 ± 0.6% to 94.0 ± 1.1% (Figure 4b). Conventional binary classifiers based on balanced training sets assume a default cutoff of 0.5 to separate positives from negatives, such as the SVC module in the LIB-SVM package. However, classifiers trained by imbalanced data tend to strongly favor the majority classes and largely ignore the minority classes, when the default cutoff is applied. If the majority class is negative incidents, such as the hERG data in this study, the classifier will have greater tendency to misclassify true positives (i.e. to sacrifice the sensitivity), thus favor the specificity, which measures the proportion of true negatives being correctly retrieved. The poor sensitivity will definitely devalue such models, since the fundamental goal of the hERG models is to identify those potentially active blockers of the hERG channels, in order either to dial out the hERG activity or remove them from the drug discovery pipeline. In this sense, the Jackknifing under-sampling technique enhanced the applicability of the hERG models by improving the sensitivity.
The second under-sampling technique applied in this study was bootstrapping, where a random subset of majority members was selected to match the size of the minority class. Consensus models, BOOT10, BOOT20, …, BOOT50, were computed by using 10, 20, up to 50 random subsets to construct the consensus models. Each bootstrapping experiment was repeated for 10 times. It became clear that the differences among the BOOT20, BOOT30, BOOT40, and BOOT50, were trivial (Figure 4), indicating that model enhancement will reach saturation along with increment of the number of subsets in bootstrapping.
The averaged AUC of the 10 BOOT10 models was slight lower than those of Jackknifing and other bootstrapping models, but equivalent to those of CV_1 and CV_2 models without rebalancing the training data (Figure 4a). The sensitivity of BOOT10 models was better than those of CV_1, CV_2, and the Jackknifing models (Figure 4b), though.
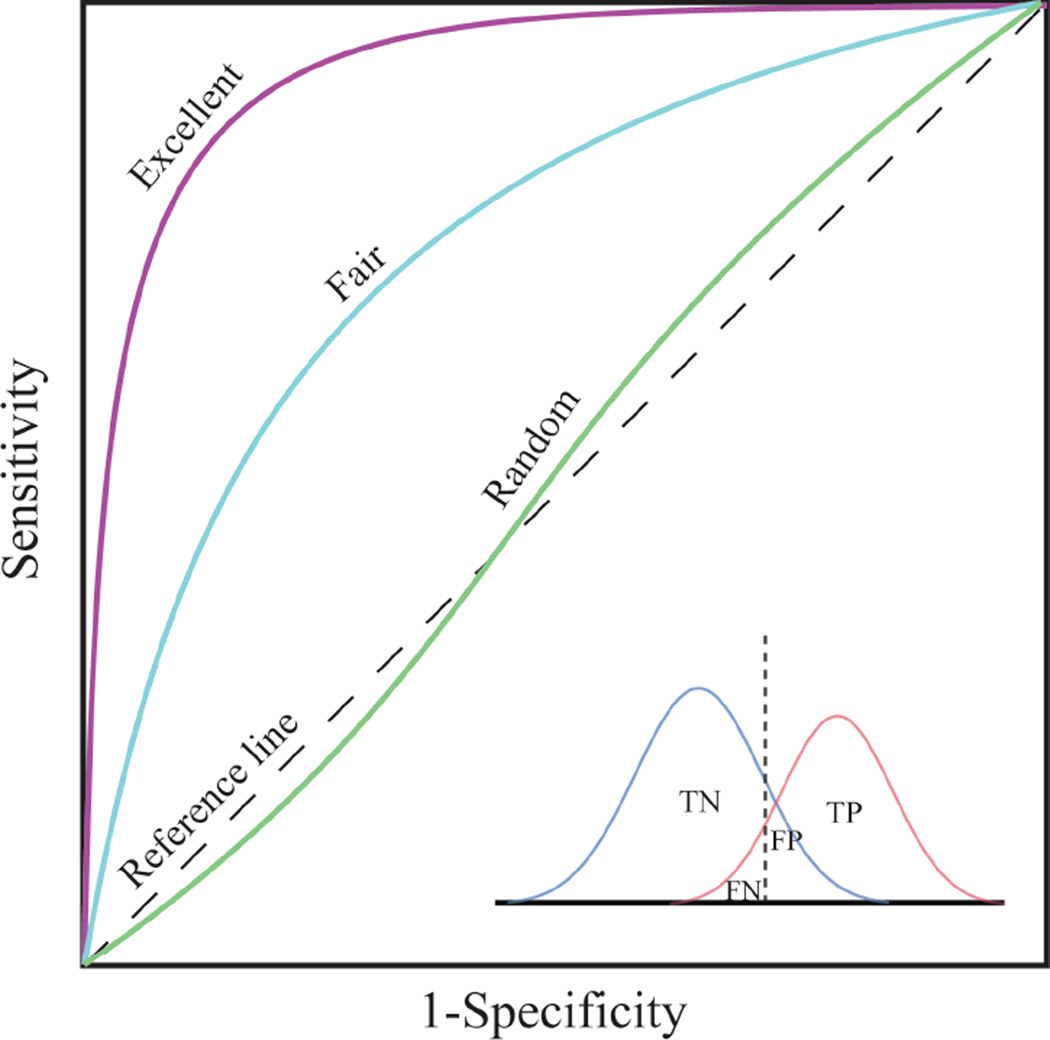
Figure 4b clearly demonstrates the tradeoff between sensitivities (hit rates or benefits) and specificities (false alarms or costs) among the different models. However, the values of (sensitivity + specificity)/2, also known as balanced accuracy, are less variable than the sensitivity or specificity alone, where the highest value is 0.847 for BOOT20 model and the lowest is 0.795 for CV_2 model. This kind of tradeoff between sensitivity and specificity is graphically revealed in a ROC curve (Figure 6), thus the AUC of a ROC curve is considered an appropriate “single number” evaluation of performance for a binary classifier, accounting for both sensitivity and specificity of the model.
Figure 6.
A schematic representation of ROC curves with different separation power. TP, true positive; TN, true negative; FP, false positive; FN, false negative. Sensitivity = TP/(TP + FN); specificity = TN/(TN + FP).
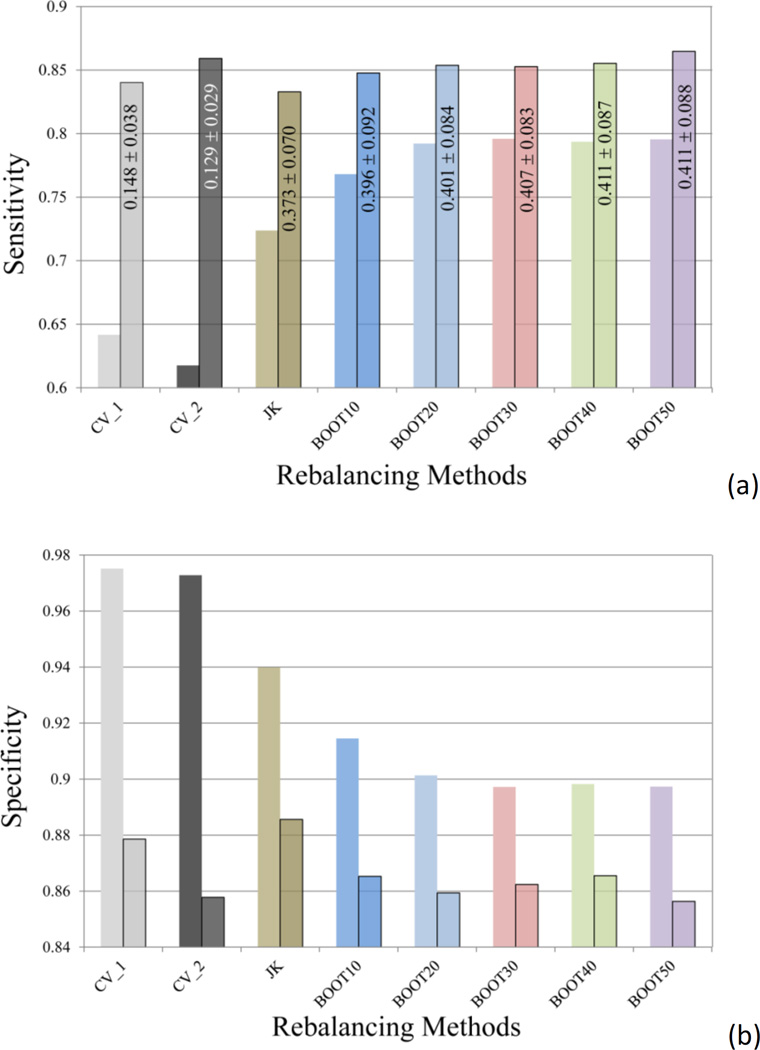
The inserted graph in Figure 6 illustrates the changes of specificity of a binary classifier from 1 to 0 while sensitivity changing from 0 to 1, when the cutoff, the dashed line, moving from the left end to the right end. The optimal cutoff is defined as the one that maximizes the value of the balanced accuracy, or the point on a ROC curve that is the closest to the top-left corner (point of [0, 1]). To redo the predictions by using the optimal cutoffs, instead of the default cutoff of 0.5, the differences among all the models were ironed out – the sensitivities fall between 0.83 and 0.86 (Figure 7a), the specificities between 0.86 and 0.89 (Figure 7b). In other words, the poor sensitivity problem associated with the imbalanced training data can be overcome by simply replacing the default cutoff with the computed optimal cutoff, without applying any rebalancing techniques, for the hERG dataset in this study. The low optimal cutoff values in CV_1 and CV_2 models (Figure 7a) are commonly observed in classifying heavily skewed datasets. It is also pragmatic to manipulate the cutoff value in order to achieve higher sensitivity, at a cost of loss of specificity, or vice versa.
Figure 7.
A comparison of (a) sensitivities and (b) specificities of different models before and after (semi-transparent boxed columns) applying the optimal cutoffs to the predicted probabilities. The averaged optimal cutoff values and their standard deviations are labeled in the corresponding bars in the sensitivity plot.
Actually, the conclusion that rebalancing approaches will not enhance the predictive power for the hERG datasets can be easily reached by comparing the AUC values in Figure 4a. Therefore, AUC of a ROC curve provides a simple yet meaningful assessment to the model performance of a binary classifier, which is insensitive to changes in class distribution and error costs.[40]
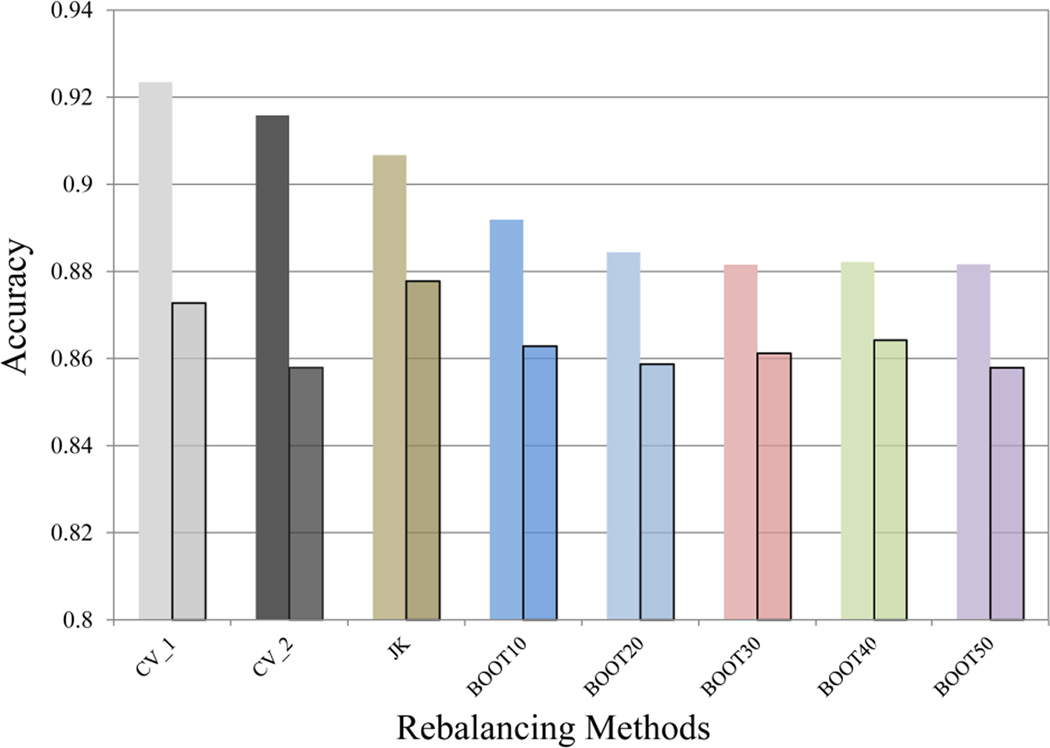
On the contrary, another commonly used metrics in QSAR modeling, accuracy, is usually less favored in evaluating predictive power of classifiers associated with skewed training data. A worthless model which predicts all the compounds as hERG negative will attain a high accuracy of over 84%, since the whole major class, hERG negative, is assigned as TN, which contributes a dominant portion to accuracy.
where P and N represent the total positives and negatives in the dataset. Utilizing accuracy as the metrics to appraise binary classifiers, one would conclude that predictive powers decline consistently by using optimal cutoffs in the place of default ones (Figure 8), which is obviously incorrect in this case.
Figure 8.
A comparison of accuracy of different models before and after (semi-transparent boxed columns) applying the optimal cutoffs to the predicted probabilities.
Interpretability achieved by using atom typing and SVC
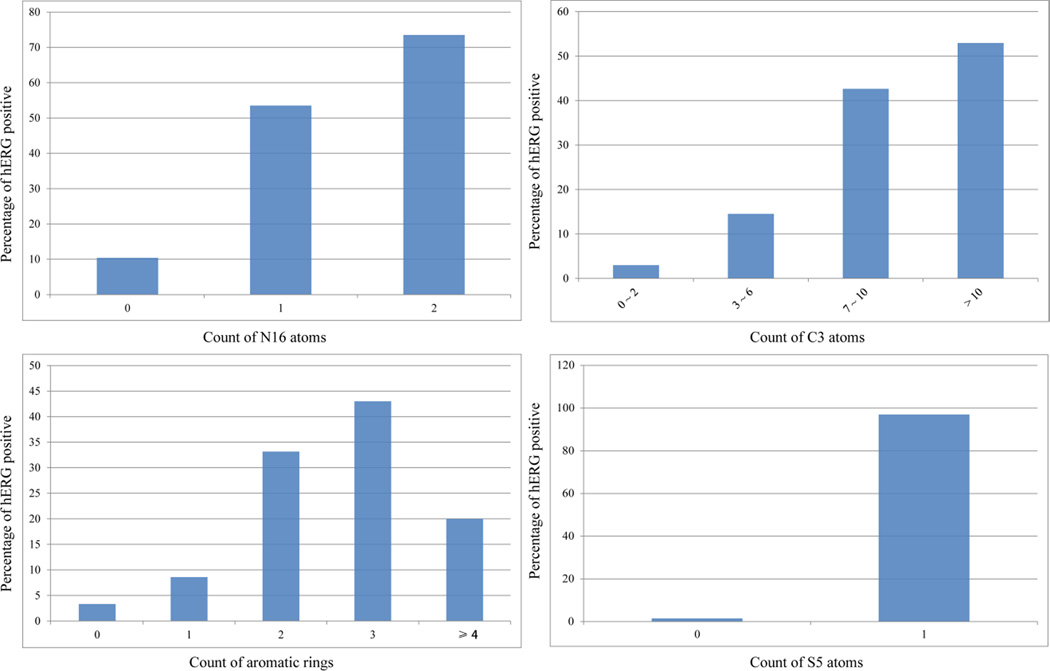
The top five important features extracted from the training set of hERG model included N16 (a positively charged nitrogen atom in a saturated ring, such as piperidine or piperazine), C3 (an aromatic carbon atom with no substitution and adjacent to two aromatic carbon atoms), H2 (a hydrogen bonded to an aromatic carbon), M13 (a number of aromatic rings), and S5 (sulfur in a ring bonded to two aromatic atoms). These features summarize the two key characters of the hERG blockers – an aromatic moiety and a positive charge center, which is in good agreement with commonly recognized pharmacophore models of hERG blockers.[3b] Compounds containing two N16 nitrogen atoms have a greater than 73% chance to block hERG channels, and the probability dropped sharply to 10% for compounds without an N16 atom (Figure 9a). Piperazine and piperidine are two moieties frequently used by medicinal chemists to manipulate molecular flexibility and hydrophobicity. However, both structure features have high potential to trigger undesirable hERG activity, unless the basicity of the ring nitrogen atoms is alleviated by introducing neighboring aromatic rings or carbonyl groups.
Figure 9.
The increasing trends of percentages of hERG positive compounds in accordance with the count of (a) N16 atoms, (b) C3 atoms, (c) aromatic rings, and (d) S5 atoms.
The more aromatic carbon atoms (C3) a molecule carries, the more likely it will inhibit hERG channels (Figure 9b). However, when a molecule has more than three aromatic rings, its chance to inhibit the hERG channels decreases by more than a half from the peak, when the compounds have three aromatic rings (Figure 9c). The phenomena might be explained by the fact that the hERG active site is not large enough to accommodate compounds with four or more aromatic rings, or be associated with the poor permeability of the compounds with multiple aromatic rings.
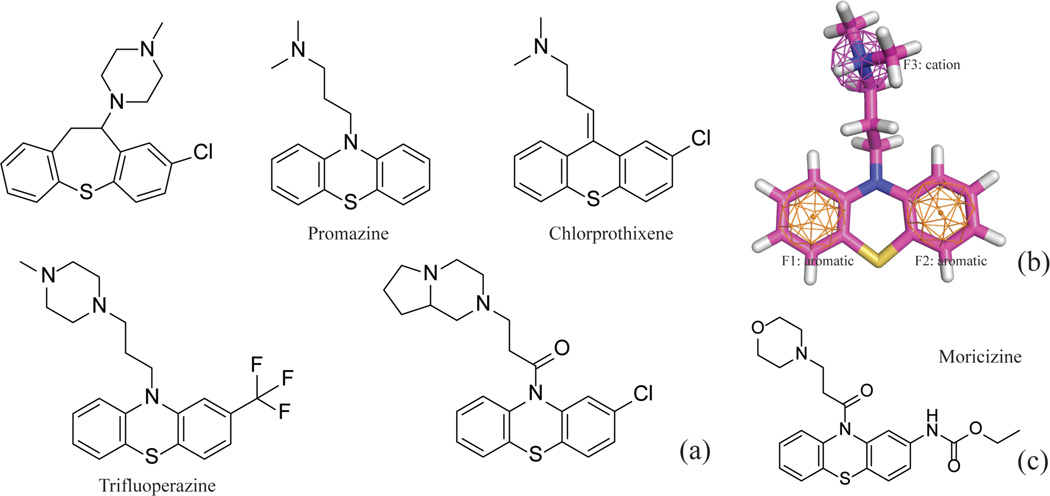
Of the 33 S5-containing compounds in the training set, 32 compounds were found hERG active (Figure 9d). All the S5-containing compounds are close analogues of the antipsychotic drug Promazine (Figure 10a). These phenothiazine compounds share common pharmacophore features, consisting of two aromatic moieties and a positive charge center (Figure 10b). This is a typical pharmacophore for a hERG blocker. However, it is worthwhile to notice that the atom type S5 is correlated with the hERG activity by chance – all but one S5-containing compounds in the training set carry a positively charged amine (Figure 10a). Moricizine is a phenothiazine (Figure 10c), but the morpholine nitrogen is neutral at physiological pH; consequently, Moricizine is the only S5-containing compound that is hERG negative. Although the existence of S5 atoms and positively charged amines in most of the training molecules is a chance correlation, it will not hurt the performance of a model, unless many phenothiazines are found in the test set without positive charge centers in the molecules. The take-home lesson is that chance correlation is everywhere, and modeling algorithms can hardly overcome the problem of chance correlation, but increasing the size and more importantly, diversity of training sets can help to reduce the probability of chance correlation.
Figure 10.
(a) The 2D structures of the representative S5-containing phenothiazines; (b) A three-feature pharmacophore model for Promazine; (c) The structure of neutral phenothiazine, Moricizine.
Validation of the hERG classifier
For validation purposes, the single-model hERG classifier was applied to predict the hERG liability of Keseru’s 66-drug dataset measured by the patch-clamp assay.[8, 41] Thirty-one drugs were tested by both in vitro patch-clamp assay and qHTS thallium flux assay, and 26 drugs (~ 84%) yielded the same classification, when 30 µM, which was the highest IC50 value observed for the hERG compounds in the thallium flux assay, was used as the threshold to separate hERG active from inactive drugs. Four out of five mismatched drugs had a pIC50 value between 4.0 and 5.0, which was about 0.5 log units away from the threshold. The results indicated that the thallium flux assay not only enabled high throughput capability, but also reasonably reproduced the in vitro hERG activities.
The SVC model trained by the 3,024-compound dataset was then employed to predict the hERG activities of the 66-drug validation set. Although the training and test sets were generated by using different assay technologies, the predictive power was superb with the AUC-ROC of 0.86. Eight drugs with pIC50 lower than or equal to 4.0 and twenty-seven drugs with pIC50 greater than 6.0 were all correctly classified (Table 2). Interestingly, the misclassified drugs, disopyramide, nitrendipine, dolasetron, sparfloxacin, MDL-74158, and epinastine, were also incorrectly predicted by a naive Bayes classifier trained with totally different compounds.[8]
Table 2.
The 66-drug validation set with the measured pIC50 values and the predicted probabilities of being hERG active. The threshold to separate hERG active from inactive drugs is set to 30 µM, or pIC50 of 4.52.
| ID | Name | pIC50 | Class | Probability | ID | Name | pIC50 | Class | Probability |
|---|---|---|---|---|---|---|---|---|---|
| 38 | Nicotine | 3.61 | N | 0.015 | 46 | Quinidine | 6.49 | P | 0.470 |
| 32 | Levofloxacin | 3.04 | N | 0.017 | 33 | Loratadine | 6.77 | P | 0.513 |
| 42 | Ofloxacin | 2.85 | N | 0.017 | 36 | Mizolastine | 6.36 | P | 0.523 |
| 68 | Trimethoprim | 3.62 | N | 0.018 | 41 | Norclozapine | 5.35 | P | 0.531 |
| 26 | Grepafloxacin | 4.30 | N | 0.025 | 30 | Imipramine | 5.47 | P | 0.545 |
| 11 | Ciprofloxacin | 3.02 | N | 0.035 | 47 | Risperidone | 6.82 | P | 0.559 |
| 49 | Sildenafil | 5.48 | P | 0.035 | 20 | Disopyramide | 4.04 | N | 0.581 |
| 25 | Gatifloxacin | 3.89 | N | 0.037 | 54 | Verapamil | 6.85 | P | 0.595 |
| 39 | Nifedipine | 4.30 | N | 0.038 | 51 | Terfenadine | 6.70 | P | 0.619 |
| 40 | Nitrendipine | 5.00 | P | 0.046 | 9 | Chlorpheniramine | 4.68 | P | 0.624 |
| 18 | Diltiazem | 4.76 | P | 0.047 | 34 | Mesoridazine | 6.49 | P | 0.626 |
| 13 | Clarithromycin | 4.23 | N | 0.051 | 19 | Diphenhydramine | 4.57 | P | 0.650 |
| 63 | MDL-74156 | 5.23 | P | 0.059 | 16 | Ziprasidone | 6.92 | P | 0.658 |
| 66 | Olanzapine | 6.74 | P | 0.063 | 2 | Amiodarone | 5.00 | P | 0.660 |
| 55 | Vesnarinone | 5.96 | P | 0.066 | 48 | Sertindole | 8.00 | P | 0.676 |
| 50 | Sparfloxacin | 4.74 | P | 0.069 | 23 | E4031 | 7.70 | P | 0.704 |
| 22 | Dolasetron | 4.92 | P | 0.076 | 59 | Droperidol | 7.49 | P | 0.789 |
| 15 | Cocaine | 5.14 | P | 0.077 | 28 | Haloperidol | 7.52 | P | 0.802 |
| 37 | Moxifloxacin | 3.89 | N | 0.088 | 64 | Mefloquine | 5.25 | P | 0.825 |
| 7 | Carvedilol | 4.98 | P | 0.097 | 21 | Dofetilide | 8.00 | P | 0.843 |
| 5 | Azimilide | 5.85 | P | 0.109 | 24 | Epinastine | 4.00 | N | 0.844 |
| 8 | Cetirizine | 4.52 | N | 0.133 | 60 | Flecainide | 5.41 | P | 0.845 |
| 12 | Cisapride | 7.40 | P | 0.283 | 44 | Perhexiline | 5.11 | P | 0.849 |
| 14 | Clozapine | 6.49 | P | 0.298 | 58 | Desmethylastemizole | 9.00 | P | 0.880 |
| 57 | Citalopram | 5.40 | P | 0.308 | 35 | Mibefradil | 5.84 | P | 0.897 |
| 43 | Ondansetron | 6.09 | P | 0.332 | 6 | Bepridil | 6.26 | P | 0.898 |
| 65 | Norastemizole | 7.55 | P | 0.337 | 45 | Pimozide | 7.30 | P | 0.907 |
| 17 | Desipramine | 5.86 | P | 0.341 | 10 | Chlorpromazine | 5.83 | P | 0.914 |
| 3 | Amitriptyline | 5.00 | P | 0.345 | 53 | Thioridazine | 6.44 | P | 0.929 |
| 1 | Alosetron | 5.49 | P | 0.350 | 61 | Fluoxetine | 5.82 | P | 0.937 |
| 67 | RP-58866 | 6.70 | P | 0.357 | 4 | Astemizole | 8.00 | P | 0.939 |
| 52 | Terikalant | 6.60 | P | 0.372 | 27 | Halofantrine | 6.70 | P | 0.944 |
| 31 | Ketoconazole | 5.72 | P | 0.441 | 29 | Ibutilide | 8.00 | P | 0.988 |
The outstanding predictive performance of the hERG classification model provides drug discovery scientists with a powerful tool to identify potential hERG liability associate with the compounds in the pipeline.
Conclusion
Drug induced LQTS has accounted for the withdrawal of several drugs from the market, making the hERG channel a major anti-target in drug discovery. Immediate knowledge of potential hERG liability of molecules in drug discovery pipeline will help scientists to make right decisions, thus the resources can be reallocated accordingly. In this study, highly predictive SVC models were constructed on the basis of 3,024 non-redundant drug molecules, by using customized atom-type-based molecular descriptors. Random division of training and test sets consistently provided reasonably representative separation and similar predictive performance in the 10 repeated experiments, even though the original dataset was severely imbalanced. AUC of a ROC curve offers a meaningful “single number” evaluation of performance for a binary classifier, accounting for both sensitivity and specificity of the model. For a reasonably large and diverse training set with minimal experimental errors, such as the hERG dataset in this study, neither Jackknifing nor bootstrapping rebalancing techniques seem to significantly enhance the predictive power of the classification models. Instead, adopting the optimal cutoffs can restore the decent balance of sensitivity and specificity. The structural features exerting the largest influences on the hERG activity were recognized by the correlation matrix computed from the kernel matrix in SVC, in turn providing valuable guidance for medicinal chemists in their attempts to dial out the hERG liability.
Although created by using different assay technologies, the predictive model based on 3,024-compound training set demonstrated outstanding performance on estimating the hERG liabilities of a 66-drug external validation set, with the AUC-ROC of 0.86.
Last but not the least, it should be pointed out that blockage of the hERG channel is a necessary, instead of a sufficient, condition for acquired QT interval prolongation and drug-induced TdP. In other words, hERG activity and QT interval prolongation might not result in the development of TdP, since the drug molecules, such as verapamil,[42] might interact with other ion channels to resume the depolarization-repolarization interplay.[43] Therefore the QSAR models should not be applied to predict drug-induced TdP or life-threatening cardiotoxicity.
Table 1.
The 31 drugs tested by the patch-clamp assay (“Patch-Clamp”) and the thallium flux assay (“Flux”). The threshold to separate hERG active from inactive drugs is set to 30 µM, or pIC50 of 4.52.
| ID | Name | pIC50 | Patch-Clamp | Flux | Concordance | ID | Name | pIC50 | Patch-Clamp | Flux | Concordance |
|---|---|---|---|---|---|---|---|---|---|---|---|
| 42 | Ofloxacin | 2.85 | N | N | 1 | 60 | Flecainide | 5.41 | P | P | 1 |
| 11 | Ciprofloxacin | 3.02 | N | N | 1 | 30 | Imipramine | 5.47 | P | P | 1 |
| 68 | Trimethoprim | 3.62 | N | N | 1 | 61 | Fluoxetine | 5.82 | P | P | 1 |
| 25 | Gatifloxacin | 3.89 | N | N | 1 | 10 | Chlorpromazine | 5.83 | P | P | 1 |
| 24 | Epinastine | 4.00 | N | P | 0 | 35 | Mibefradil | 5.84 | P | P | 1 |
| 20 | Disopyramide | 4.04 | N | P | 0 | 53 | Thioridazine | 6.44 | P | P | 1 |
| 26 | Grepafloxacin | 4.30 | N | N | 1 | 46 | Quinidine | 6.49 | P | P | 1 |
| 39 | Nifedipine | 4.30 | N | N | 1 | 51 | Terfenadine | 6.70 | P | P | 1 |
| 19 | Diphenhydramine | 4.57 | P | P | 1 | 66 | Olanzapine | 6.74 | P | N | 0 |
| 18 | Diltiazem | 4.76 | P | N | 0 | 47 | Risperidone | 6.82 | P | P | 1 |
| 7 | Carvedilol | 4.98 | P | P | 1 | 54 | Verapamil | 6.85 | P | P | 1 |
| 2 | Amiodarone | 5.00 | P | P | 1 | 45 | Pimozide | 7.30 | P | P | 1 |
| 40 | Nitrendipine | 5.00 | P | N | 0 | 59 | Droperidol | 7.49 | P | P | 1 |
| 44 | Perhexiline | 5.11 | P | P | 1 | 28 | Haloperidol | 7.52 | P | P | 1 |
| 64 | Mefloquine | 5.25 | P | P | 1 | 4 | Astemizole | 8.00 | P | P | 1 |
| 21 | Dofetilide | 8.00 | P | P | 1 |
References
- 1.Warmke JW, Ganetzky B. Proc Natl Acad Sci U S A. 1994;91:3438–3442. doi: 10.1073/pnas.91.8.3438. [DOI] [PMC free article] [PubMed] [Google Scholar]
- 2.a) Vandenberg JI, Perry MD, Perrin MJ, Mann SA, Ke Y, Hill AP. Physiol Rev. 2012;92:1393–1478. doi: 10.1152/physrev.00036.2011. [DOI] [PubMed] [Google Scholar]; b) Gutman GA, Chandy KG, Grissmer S, Lazdunski M, McKinnon D, Pardo LA, Robertson GA, Rudy B, Sanguinetti MC, Stuhmer W, Wang X. Pharmacol Rev. 2005;57:473–508. doi: 10.1124/pr.57.4.10. [DOI] [PubMed] [Google Scholar]
- 3.a) De Ponti F, Poluzzi E, Cavalli A, Recanatini M, Montanaro N. Drug Saf. 2002;25:263–286. doi: 10.2165/00002018-200225040-00004. [DOI] [PubMed] [Google Scholar]; b) Aronov AM. Drug Discov Today. 2005;10:149–155. doi: 10.1016/S1359-6446(04)03278-7. [DOI] [PubMed] [Google Scholar]
- 4.International Conference on Harmonisation. :61133–61134. [Google Scholar]
- 5.Sakmann B, Neher E. Annu Rev Physiol. 1984;46:455–472. doi: 10.1146/annurev.ph.46.030184.002323. [DOI] [PubMed] [Google Scholar]
- 6.Durdagi S, Deshpande S, Duff HJ, Noskov SY. J Chem Inf Model. 2012;52:2760–2774. doi: 10.1021/ci300353u. [DOI] [PubMed] [Google Scholar]
- 7.Gulbis JM, Doyle DA. Curr Opin Struct Biol. 2004;14:440–446. doi: 10.1016/j.sbi.2004.06.008. [DOI] [PubMed] [Google Scholar]
- 8.Sun H. Chemmedchem. 2006;1:315–322. doi: 10.1002/cmdc.200500047. [DOI] [PubMed] [Google Scholar]
- 9.a) Williams PA, Cosme J, Vinkovic DM, Ward A, Angove HC, Day PJ, Vonrhein C, Tickle IJ, Jhoti H. Science. 2004;305:683–686. doi: 10.1126/science.1099736. [DOI] [PubMed] [Google Scholar]; b) Ekroos M, Sjogren T. Proc Natl Acad Sci U S A. 2006;103:13682–13687. doi: 10.1073/pnas.0603236103. [DOI] [PMC free article] [PubMed] [Google Scholar]
- 10.Jing Y, Easter A, Peters D, Kim N, Enyedy IJ. Future Med Chem. 2015;7:571–586. doi: 10.4155/fmc.15.18. [DOI] [PubMed] [Google Scholar]
- 11.Aronov AM. Curr Opin Drug Discov Devel. 2008;11:128–140. [PubMed] [Google Scholar]
- 12.Villoutreix BO, Taboureau O. Adv Drug Deliv Rev. 2015;86:72–82. doi: 10.1016/j.addr.2015.03.003. [DOI] [PubMed] [Google Scholar]
- 13.a) Braga RC, Alves VM, Silva MF, Muratov E, Fourches D, Tropsha A, Andrade CH. Curr Top Med Chem. 2014;14:1399–1415. doi: 10.2174/1568026614666140506124442. [DOI] [PMC free article] [PubMed] [Google Scholar]; b) Braga RC, Alves VM, Silva MFB, Muratov E, Fourches D, Liao LM, Tropsha A, Andrade CH. Mol Inform. 2015;34:698–701. doi: 10.1002/minf.201500040. [DOI] [PMC free article] [PubMed] [Google Scholar]
- 14.Sun H. A Practical Guide to Rational Drug Design. Cambridge: Elsevier; 2015. [Google Scholar]
- 15.a) Crumb WJ., Jr J Pharmacol Exp Ther. 2000;292:261–264. [PubMed] [Google Scholar]; b) Rodriguez-Menchaca AA, Ferrer T, Navarro-Polanco RA, Sanchez-Chapula JA, Moreno-Galindo EG. J Pharmacol Toxicol Methods. 2014;69:237–244. doi: 10.1016/j.vascn.2013.12.007. [DOI] [PubMed] [Google Scholar]
- 16.Weaver CD, Harden D, Dworetzky SI, Robertson B, Knox RJ. J Biomol Screen. 2004;9:671–677. doi: 10.1177/1087057104268749. [DOI] [PubMed] [Google Scholar]
- 17.Du Y, Days E, Romaine IM, Abney KK, Kaufmann KW, Sulikowski GA, Stauffer SR, Lindsley CW, Weaver CD. ACS Chem Neurosci. 2015 doi: 10.1021/acschemneuro.5b00004. [DOI] [PubMed] [Google Scholar]
- 18.Titus SA, Beacham D, Shahane SA, Southall N, Xia M, Huang R, Hooten E, Zhao Y, Shou L, Austin CP, Zheng W. Anal Biochem. 2009;394:30–38. doi: 10.1016/j.ab.2009.07.003. [DOI] [PMC free article] [PubMed] [Google Scholar]
- 19.a) Wang Y, Jadhav A, Southal N, Huang R, Nguyen DT. Curr Chem Genomics. 2010;4:57–66. doi: 10.2174/1875397301004010057. [DOI] [PMC free article] [PubMed] [Google Scholar]; b) Inglese J, Auld DS, Jadhav A, Johnson RL, Simeonov A, Yasgar A, Zheng W, Austin CP. Proc Natl Acad Sci U S A. 2006;103:11473–11478. doi: 10.1073/pnas.0604348103. [DOI] [PMC free article] [PubMed] [Google Scholar]
- 20.Huang R, Southall N, Wang Y, Yasgar A, Shinn P, Jadhav A, Nguyen DT, Austin CP. Sci Transl Med. 2011;3:80ps16. doi: 10.1126/scitranslmed.3001862. [DOI] [PMC free article] [PubMed] [Google Scholar]
- 21. [Accessed 04/24/2011]; [Google Scholar]
- 22.Sun H. J Chem Inf Comput Sci. 2004;44:748–757. doi: 10.1021/ci030304f. [DOI] [PubMed] [Google Scholar]
- 23.a) Sun H, Veith H, Xia M, Austin CP, Huang R. J Chem Inf Model. 2011;51:2474–2481. doi: 10.1021/ci200311w. [DOI] [PMC free article] [PubMed] [Google Scholar]; b) Sun H. J Med Chem. 2005;48:4031–4039. doi: 10.1021/jm050180t. [DOI] [PubMed] [Google Scholar]
- 24.Noble WS. Nat Biotechnol. 2006;24:1565–1567. doi: 10.1038/nbt1206-1565. [DOI] [PubMed] [Google Scholar]
- 25.a) Cristianini N, Shawe-Taylor J. An Introduction to Support Vector Machines. Cambridge: Cambridge University Press; 2005. [Google Scholar]; b) Sansen S, Yano JK, Reynald RL, Schoch GA, Griffin KJ, Stout CD, Johnson EF. J Biol Chem. 2007;282:14348–14355. doi: 10.1074/jbc.M611692200. [DOI] [PubMed] [Google Scholar]; c) Thissen U, Pepers M, Ustun B, Melssen WJ, Buydens LMC. Chemometr Intell Lab. 2004;73:169–179. [Google Scholar]
- 26.Chang C-C, Lin C-J. 2001 [Google Scholar]
- 27.Merlot C. Drug Discov Today. 2010;15:16–22. doi: 10.1016/j.drudis.2009.09.010. [DOI] [PubMed] [Google Scholar]
- 28.Sun H, Xia M, Austin CP, Huang R. Aaps J. 2012;14:473–480. doi: 10.1208/s12248-012-9358-1. [DOI] [PMC free article] [PubMed] [Google Scholar]
- 29.a) Shukla SJ, Huang R, Austin CP, Xia M. Drug Discov Today. 2010;15:997–1007. doi: 10.1016/j.drudis.2010.07.007. [DOI] [PMC free article] [PubMed] [Google Scholar]; b) Huang R, Xia M, Sakamuru S, Zhao J, Shahane SA, Attene-Ramos M, Zhao T, Austin CP, Simeonov A. Nat Commun. 2016;7:10425. doi: 10.1038/ncomms10425. [DOI] [PMC free article] [PubMed] [Google Scholar]
- 30.a) Schmidt CW. Environ Health Perspect. 2009;117:A348–A353. doi: 10.1289/ehp.117-a348. [DOI] [PMC free article] [PubMed] [Google Scholar]; b) Kavlock RJ, Austin CP, Tice RR. Risk Anal. 2009;29:485–487. doi: 10.1111/j.1539-6924.2008.01168.x. discussion 492-487. [DOI] [PMC free article] [PubMed] [Google Scholar]
- 31.Greene N. Adv Drug Deliv Rev. 2002;54:417–431. doi: 10.1016/s0169-409x(02)00012-1. [DOI] [PubMed] [Google Scholar]
- 32.Liu RF, Yu XP, Wallqvist A. J Cheminformatics. 2015;7 doi: 10.1186/s13321-015-0053-y. [DOI] [PMC free article] [PubMed] [Google Scholar]
- 33.Stepan AF, Walker DP, Bauman J, Price DA, Baillie TA, Kalgutkar AS, Aleo MD. Chem Res Toxicol. 2011;24:1345–1410. doi: 10.1021/tx200168d. [DOI] [PubMed] [Google Scholar]
- 34.Du L, Li M, You Q, Xia L. Biochem Biophys Res Commun. 2007;355:889–894. doi: 10.1016/j.bbrc.2007.02.068. [DOI] [PubMed] [Google Scholar]
- 35.Wang S, Li Y, Xu L, Li D, Hou T. Curr Top Med Chem. 2013;13:1317–1326. doi: 10.2174/15680266113139990036. [DOI] [PubMed] [Google Scholar]
- 36.Czodrowski P. J Chem Inf Model. 2013;53:2240–2251. doi: 10.1021/ci400308z. [DOI] [PubMed] [Google Scholar]
- 37.Jia L, Sun H. Bioorg Med Chem. 2008;16:6252–6260. doi: 10.1016/j.bmc.2008.04.028. [DOI] [PubMed] [Google Scholar]
- 38.Lipinski CA, Lombardo F, Dominy BW, Feeney PJ. Adv Drug Deliver Rev. 1997;23:3–25. doi: 10.1016/s0169-409x(00)00129-0. [DOI] [PubMed] [Google Scholar]
- 39.Sun H, Veith H, Xia M, Austin CP, Tice RR, Huang R. Mol Inform. 2012;31:783–792. doi: 10.1002/minf.201200065. [DOI] [PMC free article] [PubMed] [Google Scholar]
- 40.Fawcett T. Pattern Recogn Lett. 2006;27:861–874. [Google Scholar]
- 41.Keseru GM. Bioorg Med Chem Lett. 2003;13:2773–2775. doi: 10.1016/s0960-894x(03)00492-x. [DOI] [PubMed] [Google Scholar]
- 42.Fauchier L, Babuty D, Poret P, Autret ML, Cosnay P, Fauchier JP. Am J Cardiol. 1999;83:807–808. doi: 10.1016/s0002-9149(98)01001-7. A810-801. [DOI] [PubMed] [Google Scholar]
- 43.Yang T, Snyders D, Roden DM. J Cardiovasc Pharmacol. 2001;38:737–744. doi: 10.1097/00005344-200111000-00010. [DOI] [PubMed] [Google Scholar]


