Abstract
Background
Comparison of percent fat mass across different body composition analysis devices is important given variation in technology accuracy and precision, as well as the growing need for cross-validation of devices often applied across longitudinal studies.
Subjects/Methods
We compared EchoMRI-AH and Lunar iDXA quantification of percent body fat (PBF) in 84 adults (43M, 41F) with mean age 39.7±15.9 y and BMI 26.2±5.3 kg/m2.
Results
PBF correlated strongly between devices (r>0.95, p<0.0001). A prediction equation was derived in half of the subjects, and the other half were used to cross-validate the proposed equation (EchoMRI-AH PBF=[0.94*iDXA PBF]+[0.14*Age]+[3.3*Female]−8.83). Mean PBF difference (predicted–measured) in the validation group was not different from 0 (diff=0.27%, 95%CI: −0.42–0.96, p=0.430). Bland-Altman plots showed a bias with higher measured PBF on EchoMRI-AH versus iDXA in all 84 subjects (β=0.13, p<0.0001).
Conclusions
The proposed prediction equation was valid in our cross-validation sample, and has the potential to be applied across multicenter studies.
INTRODUCTION
Different devices measuring body composition exhibit innate variability and require cross-validation between manufacturers or within upgrades. Usage of different body composition technologies in multicenter trials further supports such comparisons.
EchoMRI for adult humans (EchoMRI-AH) is a non-invasive device that uses a low-strength magnetic field to count hydrogen atoms in lipid and water, thereby quantifying fat mass, lean tissue mass, free water, and total body water with good precision (ref. 1). Many advantages of EchoMRI-AH exist (ref. 1–2), including absence of radiation compared to GE Lunar dual-energy X-ray absorptiometry (iDXA). Misidentification of less dense fat mass has also been reported with absorptiometry, especially in obese individuals (ref. 3–4). Some EchoMRI-AH studies observe an underestimation of fat mass compared with a 4C-model (ref. 2, 5), yet no conversion equations were derived. EchoMRI-AH has been compared to Hologic DXA and prediction equations derived (ref. 6). EchoMRI-AH and iDXA have yet to be compared.
MATERIALS AND METHODS
Subjects
Eighty-four healthy adults (age 20–80 years) enrolled in a study cross-calibrating two body composition devices. Inclusion: BMI 17–50 kg/m2 and weight <136 kg. Exclusion: currently enrolled in a clinical trial testing an obesity/diabetic medication; imaging contraindication; and being/attempting to become pregnant. Only white adults were assessed due to limited race diversity. Pennington IRB approved the study protocol. All subjects provided written consent.
Study Design
Participants avoided intense physical activity for 2 days preceding testing. Participants self-report weight changes <2 kg over previous 3 months. Following an overnight fast, two measures of gowned weight and height were taken consecutively after voiding. The weight of the gown was subtracted from gowned weight to obtain metabolic weight. Whole-body composition was measured by Lunar iDXA (GE; Milwaukee, WI) and EchoMRI-AH (Echo Medical Systems; Houston, TX) in random order. Both instruments were located in the same temperature-controlled room (24.6±0.5°C). iDXA and EchoMRI-AH measures were analyzed using enCORE software (version 13.40.038) and with proprietary software, respectively. Eight subjects did not fit entirely within the iDXA scan area; therefore, the left arm was excluded from the scan area and iDXA software estimated left arm data using right arm data. One single measure was obtained by EchoMRI-AH and iDXA.
Statistical Analysis
Analyses were performed using SAS version 9.4 (SAS Institute, Cary, NC). Participant characteristics are expressed as mean±SD. General linear regression was used to cross-validate a PBF prediction equation of EchoMRI-AH from iDXA PBF, age, and sex. Age was included as an independent covariate via stepwise (backward) regression. A random number generator was used to split the sample into two equal (n=42) groups. Partial correlations (adjusting for age and sex) were used in both groups to compare measured PBF between devices. The first group (22M, 20F) was used to generate the prediction equation. A second group (21M, 21F) was used to cross-validate the prediction equations from the first group. The estimated PBF calculated from the prediction equations was compared with measured PBF obtained from the reference method using Pearson correlation and a paired t-test. Bland-Altman analyses of PBF were also performed (ref. 7).
RESULTS
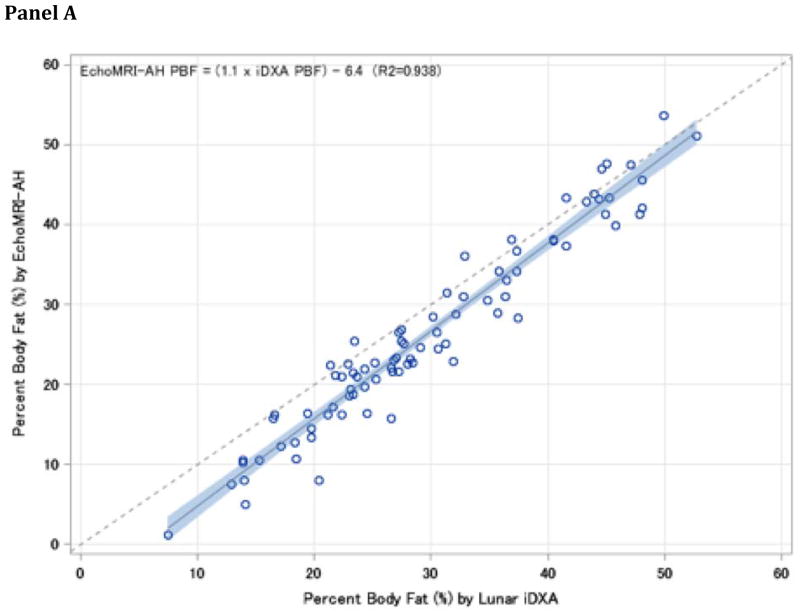
Eighty-four adults (41F) age 39.7±15.9 years and BMI 26.2±5.3 kg/m2 completed the study. A strong relationship was observed in the unadjusted prediction equations with all 84 subjects (Figure 1, Panel A), with EchoMRI-AH determining a lesser PBF compared to iDXA.
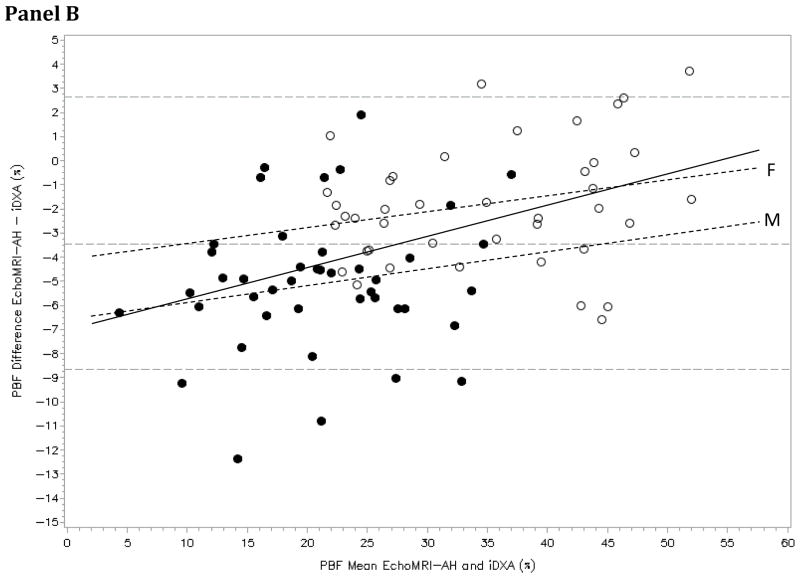
Figure 1. Relationship and Agreement of Device-Specific PBF.
Panel A: Correlation between EchoMRI-AH and iDXA PBF in all subjects (n=84). A fitted regression line (and 95% CI) and goodness of fit equation is displayed with a 1:1 reference line. Panel B: Bland-Altman plots showing the limits of agreement (mean and 95% CI) between paired values for PBF measured with the iDXA and EchoMRI-AH for all subjects (solid line: regression equation of difference = (0.13*mean) −7.02, R2=0.203). Additionally, males (●) (dashed line: difference = (0.06*mean) − 6.23, R2=0.023) and females (○) (dashed line: difference = (0.06*mean) − 4.00, R2=0.054) regression equations were plotted. The slope of the fitted regression line was not significantly different from 0 in both males (p=0.330) and females (p=0.143), showing the absence of bias; however, bias was present in the sex-combined analysis (p<0.0001).
Strong partial correlations (r=0.977, 0.956) between measured PBF on both devices was observed in the first and second groups, respectively (both p<0.0001). An equally strong relationship was observed when the prediction equation from the first group (EchoMRI-AH PBF= [0.94*iDXA PBF]+[0.14*Age]+[3.3*Female]−8.83; R2=0.977) was used to calculate the predicted EchoMRI-AH PBF in the second group and compare them to actual measured values (r=0.956; p<0.0001). Mean PBF difference (predicted–measured) in EchoMRI-AH PBF was not significantly different from 0 (diff=0.27%, 95%CI: −0.42−0.96, p=0.430), supporting the validity of the proposed equation. Separate sex-specific equations were initially derived and yielded identical iDXA PBF and age coefficients as the sex-combined equation; therefore, a single prediction equation adjusting for sex improved model fit and was preferred.
Bland-Altman plots of differences (EchoMRI-AH–iDXA) versus means for all subjects, as well as sex-specific regression lines, are provided (Figure 1, Panel B). Bias was present among the combined group of 84 subjects, yet was absent within sexes.
DISCUSSION
EchoMRI-AH yielded lesser PBF compared to iDXA. While age similarly influenced PBF prediction within both males and females separately, sex appeared to influence the prediction of body composition in a constant manner with female exhibiting 3.3% greater EchoMRI-AH PBF. Bias was present with increasing PBF and was primarily driven by females (or males) exhibiting greater (or lesser) PBF differences with increasing adiposity. Indeed, while bias within the sexes was statistically absent, device differences were larger for females potentially due to greater adiposity. The following is an important observation given the inherent error often arising with increasing adiposity by sex with other devices. Our results extend previous findings (ref. 5) that EchoMRI-AH underestimates fat mass (and PBF) compared to iDXA and a reference 4C-model. Our findings are consistent with the only published human EchoMRI-AH validation study in healthy adults, showing EchoMRI-AH underestimates PBF when compared to DXA (Lunar Prodigy) or a 4C-model (ref. 2). In contrast to these findings (ref. 2, 5), no significant bias in males or females with increased body fatness was observed; however, larger PBF differences existed among females with higher adiposity. Our results also extend cross-device comparison beyond Hologic DXA (ref. 6), and uses a more robust cross-validation method for confirming validity of prediction equations.
Cross-validation with larger sample sizes is necessary. Study limitations include the inability to address individual-level performance and variability given the modeling utilizes body composition averages, and device differences in PBF quantification. Specifically, iDXA accounts for sex-specific differences within a base algorithm that cannot be elucidated within the present analyses. The results indicate that utilization of both EchoMRI-AH and iDXA within a single research site or across multiple sites is possible in longitudinal studies. The derived prediction equations between EchoMRI-AH and iDXA devices are useful in such instances, yet are limited to healthy, white adults.
Acknowledgments
Supporting Grants: This work was partially supported by a NORC Center Grant #P30DK072476 (ER)
Footnotes
Conflict of Interest Statement: The authors declare there are no competing or conflicts of interest associated with the proposed manuscript. The EchoMRI-AH was provided to Pennington Biomedical as a gift to the institution.
CONFLICT OF INTEREST
All authors have no conflicts of interest to disclose. The EchoMRI-AH instrument was provided to PBRC as a gift to the institution.
References
- 1.Taicher GZ, Tinsley FC, Reiderman A, Heiman ML. Quantitative magnetic resonance (QMR) method for bone and whole-body-composition analysis. Anal Bioanal Chem. 2003;377:990–1002. doi: 10.1007/s00216-003-2224-3. [DOI] [PubMed] [Google Scholar]
- 2.Napolitano A, Miller SR, Murgatroyd PR, Coward WA, Wright A, Finer N, et al. Validation of a quantitative magnetic resonance method for measuring human body composition. Obesity (Silver Spring) 2008;16:191–908. doi: 10.1038/oby.2007.29. [DOI] [PubMed] [Google Scholar]
- 3.Ball SD, Swan PD. Accuracy of estimating intra-abdominal fat in obese women. J Exerc Physiol Online. 2003;6:1–7. [Google Scholar]
- 4.Bertin E, Marcus C, Ruiz JC, Eschard JP, Leutenegger M. Measurement of visceral adipose tissue by DXA combined with anthropometry in obese humans. Int J Obes Relat Metab Disord. 2000;24:263–270. doi: 10.1038/sj.ijo.0801121. [DOI] [PubMed] [Google Scholar]
- 5.Gallagher D, Thornton JC, He Q, Wang J, Yu W, Bradstreet TE, et al. Quantitative magnetic resonance fat measurements in humans correlate with established methods but are biased. Obesity (Silver Spring) 2010;18:2047–2054. doi: 10.1038/oby.2010.97. [DOI] [PMC free article] [PubMed] [Google Scholar]
- 6.Galgani JE, Smith SR, Ravussin E. Assessment of EchoMRI-AH versus dual-energy X-ray absorptiometry to measure human body composition. Int J Obes. 2011;35:1241–6. doi: 10.1038/ijo.2010.268. [DOI] [PMC free article] [PubMed] [Google Scholar]
- 7.Bland JM, Altman DG. Statistical methods for assessing agreement between two methods of clinical measurement. Lancet. 1986;1:307–10. [PubMed] [Google Scholar]


