

Abstract
Background
Vascular risk factors contribute to motor decline in the elderly. We investigated the relationship between lipid-lowering drugs (LLDs) use and decline in walking speed (WS) in older adults.
Methods
Data on 4009 community-dwelling men and women, aged ≥65y at baseline, are drawn from the Dijon (France) center of the Three-City study. “Fast” WS was assessed over 6 meters at baseline and at 4, 6, 8 and 10y of follow-up. Mixed linear models were used to determine the relationship between LLDs and change in WS over the follow-up.
Results
At baseline, 1295 (32%) participants used LLDs (statins, n=643; fibrates, n=652); mean fast WS was 152.9 cm/s and not significantly different between LLDs users and non-users. In models adjusted for age, sex, cholesterol level, and other covariates, WS decline was 27% slower in LLDs users (difference with non-users: 0.58 cm/s/year, 95% CI: 0.30, 0.86; P<0.001). Both fibrates and statins were associated with slower decline, but only the effect of statins was robust in analyses that took missing values into account. The beneficial effect was more pronounced in those on LLDs continuously over the follow-up.
Conclusion
WS declined less in those on lipid lowering drugs, suggesting that the effect of LLDs, statins in particular, extend beyond that on cardiovascular disease in the elderly.
Keywords: Aged; Aged, 80 and over; Female; Fibric Acids; France; Gait; Humans; Hydroxymethylglutaryl-CoA Reductase Inhibitors; Male; Motor Activity; Time Factors; Cardiovascular Diseases; Cohort Studies
Poor motor function in the elderly is associated with adverse health outcomes, including disability and death (1–3). Walking speed (WS), assessed over 3 to 6 metres in studies, is a reliable measure of overall motor function (4). Identifying risk factors associated with slower WS represents an important first step towards preventing poor motor function and disability at older ages.
Previous research has shown vascular risk factors (e.g., hypertension (5), diabetes mellitus(6)) to be associated with slower WS, there is emerging evidence that chronic inflammation may be associated with functional decline (7). Lipid metabolism abnormalities may also play a role: lower HDL-cholesterol has been associated with slower WS in the elderly (8), with cholesterol known to modify the association between chronic inflammation and motor performance (9). Besides lowering lipid levels lipid-lowering drugs (LLDs), statins in particular have anti-inflammatory properties (10). For these reasons, statins could potentially have a protective effect on age-related functional decline (11). However, the results in this domain are inconsistent. Some studies, mostly cross-sectional, show LLD use to be associated with better motor performance (12–14), other studies report no association between use of LLDs and functional status in the elderly (15, 16). Cross-sectional studies are subject to biases such as reverse causation and residual confounding. Thus, it remains unknown whether use of LLDs is associated with motor decline. The objective of our study was to examine the association between use of LLDs and decline in motor function, using data from a large prospective cohort of community-dwelling elderly with up to four measures of WS over 10 years. We hypothesized that use of LLDs would be associated with slower decline of walking speed over the follow-up.
METHODS
Study Population
The Three-City (3C) study is a cohort study of community-dwelling persons, aged ≥65y at baseline, from three French cities (Bordeaux, Dijon, Montpellier) (17). We used data from Dijon (N=4931), where a motor function substudy was conducted. After the baseline assessment, participants were seen approximately every two years; in total, six waves of data have been collected so far. Initially, only participants ≤85y were invited to follow-up screenings that included a measure of WS. From wave 2 onwards, all participants, irrespective of age, were offered the opportunity of being seen at home. Participants with conditions that cause gait impairment (Parkinson’s disease, dementia, stroke, hip fracture) were excluded from the present analyses. The study protocol was approved by the Ethics Committee of Kremlin-Bicêtre University Hospital, and all participants signed an informed consent form.
Walking Speed Assessment
WS was measured at the study center in participants ≤85y at baseline (wave 0, 1999–2000), and again after approximately four (wave 2, 2003–2004), eight (wave 4, 2007–2008), and ten years (wave 5, 2009–2010). Two tests were carried out; participants were first asked to walk at their ‘usual’ speed and then at ‘maximum’ speed, i.e., as fast as they could without running. WS was measured using two photoelectric cells connected to a chronometer placed in a corridor six meters apart. Walking speed was computed as six meters divided by time taken to complete the test in seconds. Participants were asked to start walking three metres before the start line where the photoelectric cells were placed, so that measured WS did not include the acceleration time, and had more than 5 meters after the finish line to decelerate. Participants could do one trial before testing began to ensure that they understood the instructions.
We used fast rather than usual WS in the main analysis for various reasons. One, in test-retest analysis the intraclass correlation coefficient was 0.84 (SE=0.02) for usual and 0.92 (SE=0.02) for fast WS (5). Although reliability was excellent for both measures, fast WS appears to be less prone to measurement error than usual WS. Two, change in WS over the follow-up was more pronounced for fast (2.0 cm/s/y) than usual (0.5 cm/s/y) WS, as has previously been reported by others (18, 19). Three, the variability of the slope was greater for fast (2.31, SE=0.32) than usual (0.81, SE=0.19) WS, suggesting greater heterogeneity in decline in fast WS. Analyses were repeated using usual WS to allow comparability with other studies.
Medications
Interviewers recorded medications used by participants during the preceding month using medical prescriptions and drug packages. Drugs were coded using the French translation of the WHO Anatomical Therapeutic Chemical classification. LLDs use was defined using statins (C10AAxx) and fibrates (C10ABxx). We also recorded use of aspirin, antihypertensive, psychotropic, and nonsteroidal anti-inflammatory drugs (NSAIDs).
Covariates
Data were collected during face-to-face interviews with trained psychologists using standardized questionnaires. Covariates included in the analysis were are age, sex, education, income, health behaviours, body mass index, cardiovascular disease and risk factors, cognitive status, depression, and disability; described in supplementary methods.
Statistical Analysis
Baseline participants’ characteristics are presented overall and by baseline LLDs use and tertiles of WS, and compared using age- and sex-adjusted logistic/linear regression models.
Linear mixed models to examine the association between LLD use at baseline (yes/no) and change in WS using four measures over a ten year follow-up. Mixed models allow all available data to be used in the analysis in order to estimate the intercept (cross-sectional effect) and the slope (longitudinal effect). The intercept and slope are estimated together, with the correlation between them taken into account in the model. The intercept and slope were treated as random effects, allowing them to vary between individuals. Time since baseline was included as a continuous linear term after verification that a quadratic term did not improve model fit. Model 1 included baseline LLDs and was adjusted for age and sex, the strongest determinants of WS in our study, and HDL- and LDL-cholesterol and triglycerides, which were strongly associated with LLDs. Model 2 was further adjusted for covariates associated with WS and LLDs: BMI, height, education, hypertension, diabetes mellitus, coronary artery disease, psychotropic drugs, aspirin, homocysteine. The final model (Model 3) was further adjusted for covariates associated with WS or LLDs: depressive symptoms, MMSE, physical activity, alcohol consumption, smoking, PAD, NSAIDs. All covariates were drawn from the baseline assessment and models included their main effects and interactions with time. Regression coefficients associated with LLDs use (yes/no) correspond to the mean difference in baseline WS between LLDs users and non-users; coefficients for LLDs×time correspond to the mean difference in annual WS change between the two groups; positive coefficients correspond to slower decline in WS.
To investigate whether estimates of change in WS were influenced by those not on LLDs but with an indication for treatment, we performed analyses restricted to non-LLDs users to compare those with an indication to LLDs to those without. LLDs indications were based on published guidelines based on LDL-cholesterol and other vascular risk factors (20). To examine the specificity of the association with type of LLD, we repeated the analyses using the following categories: no LLDs (reference), fibrates users, and statins users.
The effect of change in LLDs use over time was assessed in two ways. First, we defined a three-level variable based on trajectories of LLDs over the follow-up: no LLDs at any examination (never users), intermittent use (started/stopped using LLDs during follow-up), persistent use (LLDs at all examinations). This approach allows the role of duration of use to be examined. Second, LLDs were included as time-dependent variables together with their interaction with time. For both analyses, we used time-dependent covariates in the models.
In sensitivity analyses, we used propensity scores to better adjust for confounders (see supplementary methods). WS data over follow-up were missing due to death, age>85y, conditions with marked gait impairment, home examination (where WS was not measured), and non-response. To investigate the influence of missing data, we used multiple imputation (supplementary methods).
Two-tailed P-values ≤ 0.05 were considered statistically significant. Analyses were performed using SAS 9.2 (SAS Institute, Cary, North Carolina, USA).
RESULTS
At baseline, 4421 participants (65–85y) were seen at the study centre; 136 were excluded due to medical conditions that cause gait impairment, 4009 had at least one WS measure over the follow-up and LLDs data (supplementary figure). Participants not included in the analysis were older, had higher BMI, and lower physical activity and MMSE scores compared to those included in the analyses; the two groups did not differ with respect to use of LLDs or hypercholesterolemia. Among the 4009 participants included in the analysis, 959 (23.9%) had four WS measures, 753 (18.8%) three, 944 (23.6%) two, and 1353 (33.7%) one. Participants with one measure were older (75.6y vs 72.3y, P<0.001) and walked slower (143 cm/s vs 158 cm/s, P<0.001) than participants with more measures, but were not different for LLDs use (31.3% vs. 32.8%, P=0.35); 61% of the participants with one WS measure became older than 85y over the follow-up, died, or developed incident conditions causing gait impairment during the follow-up.
Table 1 presents participants’ characteristics at baseline (mean (SD) age, 73.4y (4.6); 62% women; mean (SD) fast WS: 153 (31) cm/s; 1295 (32%) LLDs users, fibrates, n=652, statins, n=643). After adjustment for age and sex, LLDs use was associated with higher BMI, lower height, lower education, hypertension, diabetes mellitus, coronary artery disease, and aspirin use. LLDs users had lower total, HDL-, LDL-cholesterol, and triglycerides, and higher homocysteine. Slower baseline WS was associated with lower socioeconomic status and with an unfavourable health profile, including LLDs use and lower HDL-cholesterol, and higher triglycerides and homocysteine. Compared to fibrates users, particpants on statins were more often men and had a history of coronary heart disease and higher triglycerides levels (supplementary table 1).
Table 1.
Baseline Characteristics of the Study Population
| Baseline characteristics | Overall (N=4009) | Baseline LLDs use*
|
Baseline fast walking speed (tertiles)†
|
|||||
|---|---|---|---|---|---|---|---|---|
| No (N=2714) | Yes (N=1295) | P-value§ | T1‡ (N=1255) | T2 (N=1258) | T3 (N=1195) | P-value¶ | ||
| Age, mean (SD) | 73.4 (4.6) | 73.4 (4.7) | 73.2 (4.4) | 0.20 | 75.3 (4.7) | 73.2 (4.5) | 71.7 (4.2) | <0.001 |
| Women, n (%) | 2472 (61.7) | 1656 (61.0) | 816 (63.0) | 0.22 | 764 (60.9) | 824 (65.5) | 701 (58.7) | <0.001 |
| Height, cm, mean (SD) | 161.8 (8.8) | 162.0 (8.9) | 161.2 (8.4) | 0.01 | 160.5 (8.8) | 161.3 (8.7) | 163.5 (8.5) | <0.001 |
| BMI, kg/m2, mean (SD) | 25.7 (4.0) | 25.5 (4.0) | 26.1 (3.9) | <0.001 | 26.7 (4.4) | 25.4 (3.8) | 24.9 (3.5) | <0.001 |
| Primary school or less, n (%) | 2551 (63.7) | 1694 (62.5) | 857 (66.2) | 0.04 | 921 (73.6) | 804 (63.9) | 641 (53.6) | <0.001 |
| High income, n (%)** | 1305 (35.0) | 897 (35.4) | 408 (34.1) | 0.58 | 307 (26.6) | 404 (34.7) | 496 (43.5) | <0.001 |
| Depressive symptoms, n (%) | 507 (12.8) | 332 (12.4) | 175 (13.6) | 0.27 | 224 (18.2) | 143 (11.4) | 113 (9.5) | <0.001 |
| MMSE, mean (SD) | 27.5 (1.9) | 27.5 (1.9) | 27.4 (1.9) | 0.12 | 27.0 (2.1) | 27.6 (1.8) | 27.8 (1.7) | <0.001 |
| Low physical activity, n (%) | 748 (19.1) | 524 (19.8) | 224 (17.6) | 0.08 | 371 (30.3) | 258 (20.7) | 230 (19.5) | <0.001 |
| Current drinker, n (%) | 3159 (79.0) | 2130 (78.7) | 1029 (79.6) | 0.31 | 973 (77.7) | 985 (78.4) | 964 (80.9) | 0.01 |
| Smoking ≥ 20 pack-years, n (%) | 658 (16.7) | 447 (16.7) | 211 (16.6) | 0.68 | 216 (17.4) | 199 (16.0) | 190 (16.2) | 0.01 |
| Hypertension, n (%) | 3167 (79.0) | 2102 (77.5) | 1065 (82.2) | <0.001 | 1073 (85.5) | 980 (77.9) | 882 (73.8) | <0.001 |
| Diabetes mellitus, n (%) | 352 (9.1) | 204 (7.7) | 148 (11.8) | <0.001 | 144 (11.8) | 100 (8.2) | 86 (7.4) | <0.001 |
| Coronary artery disease, n (%) | 406 (10.1) | 194 (7.2) | 212 (16.4) | <0.001 | 173 (13.8) | 115 (9.1) | 88 (7.4) | <0.001 |
| Peripheral artery disease, n (%) | 126 (3.2) | 83 (3.1) | 43 (3.4) | 0.48 | 59 (4.8) | 29 (2.3) | 30 (2.5) | 0.003 |
| NSAIDs, n (%) | 356 (8.9) | 237 (8.7) | 119 (9.2) | 0.69 | 149 (11.9) | 109 (8.7) | 72 (6.0) | <0.001 |
| Psychotropic drugs, n (%) | 1004 (25.0) | 652 (24.0) | 352 (27.2) | 0.03 | 419 (33.4) | 302 (24.0) | 223 (18.7) | <0.001 |
| Aspirin, n (%) | 561 (14.0) | 297 (10.9) | 264 (20.4) | <0.001 | 220 (17.5) | 154 (12.2) | 139 (11.6 | 0.01 |
| LLDs, n (%) | 1295 (32.3) | — | — | — | 407 (32.4) | 432 (34.3) | 365 (30.5) | 0.02 |
| Fibrates, n (%) | 652 (16.3) | — | — | — | 213 (17.0) | 230 (18.3) | 172 (14.4) | 0.13 |
| Statins, n (%) | 643 (16.0) | — | — | — | 194 (15.5) | 202 (16.1) | 193 (16.2) | 0.13 |
| Cholesterol, mmol/L, mean (SD) | 5.81 (0.97) | 5.96 (0.96) | 5.51 (0.90) | <0.001 | 5.83 (1.01) | 5.76 (0.95) | 5.83 (0.91) | 0.43 |
| LDL-cholesterol, mmol/L, mean (SD) | 3.62 (0.85) | 3.75 (0.84) | 3.34 (0.79) | <0.001 | 3.64 (0.88) | 3.56 (0.84) | 3.64 (0.80) | 0.52 |
| HDL-cholesterol, mmol/L, mean (SD) | 1.64 (0.40) | 1.65 (0.40) | 1.63 (0.40) | 0.031 | 1.60 (0.40) | 1.66 (0.40) | 1.66 (0.39) | <0.001 |
| Triglycerides, mmol/L, mean (SD)†† | 1.12 (0.46) | 1.14 (0.45) | 1.08 (0.47) | <0.001 | 1.18 (0.48) | 1.09 (0.44) | 1.07 (0.43) | <0.001 |
| Homocysteine, μmol/L, mean (SD) | 14.9 (5.5) | 14.1 (4.7) | 16.6 (6.6) | <0.001 | 15.8 (5.9) | 14.6 (5.1) | 14.3 (5.6) | <0.001 |
| Walking speed, cm/s, mean (SD) † | 152.9 (30.7) | 153.7 (31.5) | 151.4 (29.0) | 0.02 | 123.3 (18.6) | 152.2 (11.8) | 184.9 (21.9) | <0.001 |
4009 participants with at least one measure of fast walking speed during the follow-up.
3708 participants with a baseline fast walking speed measure.
Sex-dependent tertiles; men: T1, ≤ 150 cm/s; T2, 151–180 cm/s; T3, >180 cm/s; women: T1, ≤ 133 cm/s; T2, 134–150 cm/s; T3, >150cm/s.
Age- and sex-adjusted logistic regression models.
Age- and sex-adjusted linear regression models with continuous walking speed as the dependent variable.
Income greater than 15000 French francs per month.
Geometric mean.
Table 2 shows the association between baseline LLDs use (yes/no) and change in fast WS over the follow-up. The annual decline in WS was −2.18 cm/s (95% CI: −2.37 to −2.00; P<0.001) in those not on LLDs at baseline and −1.64 cm/s (95% CI: −1.88 to −1.41; P<0.001) in those on LLDs, a statistically significant difference of 0.54 cm/s (95% CI: 0.27 to 0.80; P<0.001), corresponding to 27% slower decline in those on LLDs. This difference was robust to adjustment for covariates (Model 3, β=0.58, 95% CI: 0.30 to 0.86; P<0.001). Baseline cholesterol and triglycerides levels or other medications (NSAIDs, psychotropic drugs, aspirin) were not associated with WS change.
Table 2.
Association between LLDs use at baseline and change in “fast” walking speed (cm/s) over the follow-up
| Change in fast walking speed | Model 1
|
Model 2
|
Model 3
|
|||
|---|---|---|---|---|---|---|
| Estimate (95% CI) | P-value | Estimate (95% CI) | P-value | Estimate (95% CI) | P-value | |
| Time (y) | −2.18 (−2.37 to −2.00) | <0.001 | −2.27 (−2.68 to −1.87) | <0.001 | −2.40 (−2.87 to −1.92) | <0.001 |
| Age x Time | −0.06 (−0.09 to −0.02) | <0.001 | −0.07 (−0.10 to −0.03) | <0.001 | −0.07 (−0.10 to −0.04) | <0.001 |
| Sex (men vs women) x Time | −0.26 (−0.53 to 0.01) | 0.06 | 0.26 (−0.11 to 0.63) | 0.16 | 0.18 (−0.20 to 0.57) | 0.35 |
| LLDs use x Time | 0.54 (0.27 to 0.80) | <0.001 | 0.54 (0.27 to 0.82) | <0.001 | 0.58 (0.30 to 0.86) | <0.001 |
| LDL-cholesterol x Time | 0.12 (−0.04 to 0.27) | 0.14 | 0.07 (−0.09 to 0.22) | 0.40 | 0.04 (−0.12 to 0.20) | 0.64 |
| HDL-cholesterol x Time | 0.26 (−0.11 to 0.63) | 0.17 | 0.10 (−0.28 to 0.47) | 0.61 | 0.14 (−0.25 to 0.52) | 0.49 |
| Triglycerides (log) x Time | −0.18 (−0.53 to 0.18) | 0.31 | −0.10 (−0.46 to 0.25) | 0.57 | −0.12 (−0.49 to 0.25) | 0.53 |
Model 1: Adjusted for age, sex, LLDs, baseline cholesterol and triglycerides, and their interactions with time.
Model 2: Model 1 + baseline height, BMI, education, hypertension, diabetes mellitus, coronary artery disease, psychotropic drugs, aspirin, homocysteine, and their interactions with time.
Model 3: Model 2 + baseline depressive symptoms, MMSE, physical activity, alcohol, smoking, peripheral artery disease, NSAIDs, and their interactions with time.
Among 2714 participants not on LLDs at baseline, 609 (22%) had an indication for treatment. The annual decline in WS in this group did not differ from that in participants without such an indication (Model 3, difference in decline=−0.15, 95% CI: −0.60 to 0.29; P=0.50).
Change in WS as a function of type of LLDs, fibrates or statins, is presented in figure 1 and supplementary table 2. Both fibrates (Model 3, β=0.48, 95% CI: 0.10 to 0.86; P=0.009) and statins (β=0.67, 95% CI: 0.31 to 1.02; P<0.001) were associated with slower WS decline, the effect was more pronounced for statins but not significantly different from the effect of fibrates (P=0.31).
Figure 1.
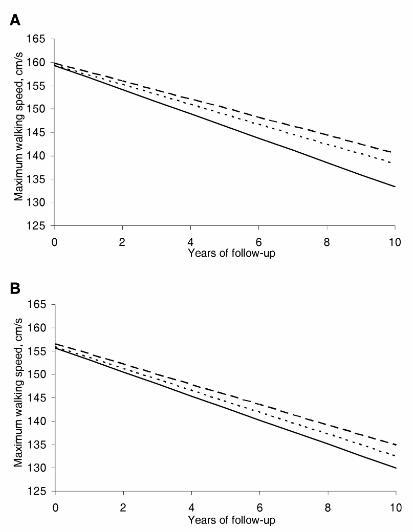
Predicted trajectories of fast walking speed according to baseline use of statins or fibrates.
Solid line: no LLDs use ; short-dashed line: fibrates; long-dashed line: statins.
Panel A: main analysis; Panel B: analysis based on multiple imputation of missing values (Supplementary Table 2, model 3).
Over the follow-up, 2354 (59%) participants reported never using LLDs, 574 (14%) were intermittent and 1081 (27%) persistent users. Table 3 shows the relationship between these categories and change in WS. Persistent users had slower decline in WS (M3, β=0.96, 95% CI: 0.25 to 1.67; P=0.007) compared to never users, while intermittent users were not significantly different from non-users (Model 3, β =0.37, 95% CI: −0.36 to 1.10; P=0.32).
Table 3.
Association between trajectories of LLDs use and change in “fast” walking speed (cm/s) over the Follow-Up
| Change in fast walking speed | Model 1 | Model 2 | Model 3 | |||
|---|---|---|---|---|---|---|
| Estimate (95% CI) | P-value | Estimate (95% CI) | P-value | Estimate (95% CI) | P-value | |
| Time (y) | −2.18 (−2.38 to −1.98) | <0.001 | −2.60 (−3.48 to −1.72) | <0.001 | −2.79 (−4.16 to −1.42) | <0.001 |
| Age x Time | −0.06 (−0.09 to −0.03) | <0.001 | −0.07 (−0.14 to −0.01) | 0.03 | −0.04 (−0.12 to 0.04) | 0.28 |
| Sex (men vs women) x Time | −0.30 (−0.57 to −0.03) | 0.03 | 0.04 (−0.78 to 0.87) | 0.92 | 0.26 (−0.63 to 1.16) | 0.56 |
| LLDs use x Time | ||||||
| None x Time | Reference | Reference | Reference | |||
| Intermittent x Time | 0.11 (−0.19 to 0.42) | 0.47 | 0.26 (−0.45 to 0.97) | 0.47 | 0.37 (−0.36 to 1.10) | 0.32 |
| Persistent x Time | 0.51 (0.21 to 0.81) | <0.001 | 1.04 (0.35 to 1.72) | <0.001 | 0.96 (0.25 to 1.67) | 0.007 |
| LDL-cholesterol x Time | 0.42 (−1.26 to 2.10) | 0.63 | −0.20 (−3.66 to 3.27) | 0.91 | −0.19 (−3.61 to 3.53) | 0.92 |
| HDL-cholesterol x Time | 0.59 (−1.14 to 2.32) | 0.51 | −0.01 (−3.62 to 3.61) | 0.99 | −0.04 (−3.85 to 3.69) | 0.97 |
| Triglycerides (log) x Time | −0.01 (−1.03 to 1.00) | 0.98 | 0.19 (−2.03 to 2.40) | 0.87 | 0.39 (−1.88 to 2.66) | 0.73 |
Model 1: Adjusted for baseline covariates (age, sex, cholesterol, triglycerides), and their interactions with time.
Model 2: Model 1 + baseline (height, education level, homocysteine) and time-dependent (BMI, hypertension, diabetes mellitus, coronary artery disease, psychotropic drugs, aspirin) covariates, and their interactions with time.
Model 3: Model 2 and time-dependent covariates (MMSE, alcohol, smoking, NSAIDs, physical activity, depressive symptoms), and their interactions with time.
Analyses including time-dependent LLDs use instead of baseline LLDs use yielded similar results (supplementary table 3); in addition, the association between LLDs and change in WS was somewhat stronger in fully adjusted models.
In sensitivity analyses (propensity scores), 1116 (86%) baseline LLDs users were matched to 1116 untreated participants (supplementary table 4); no differences were observed for matching covariates between them. LLDs at baseline remained associated with slower WS decline (supplementary table 5); the estimate (Model 3, β =0.57, 95% CI: 0.08 to 1.06; P=0.02) was similar to that in the main analysis.
Multiple imputation was used to replace missing values and subsequent analyses yielded findings consistent with our main analyses (supplementary table 6). In multivariable models, decline in WS was less pronounced in LLDs users compared to non-users: this difference (0.31 cm/s/year, 95% CI: 0.06 to 0.56; P=0.01) was less pronounced than in the main analyses but was robust to multivariable adjustment (Models 2 & 3). The effect was stronger for statins (0.40 cm/s/year, 95% CI: 0.09 to 0.71; P=0.01) than for use of fibrates (0.23 cm/s/year, 95% CI: −0.10 to 0.57; P=0.17) (Figure 1).
DISCUSSION
In this large cohort of community-dwelling elderly persons, use of LLDs was associated with 27% slower 10-year decline in WS. Although LLDs users had a higher prevalence of characteristics associated with poorer motor performance (e.g., higher BMI, hypertension, coronary artery disease), the results showing slower decline in walking speed were robust to adjustment for these factors. In addition, this association was stronger among persistent LLDs users and those on statins rather than fibrates. Although both fibrates and statins were associated with slower WS decline in the main analyses, only statins had an effect that was robust to consideration of missing values using multiple imputation.
Few studies, mostly cross-sectional in nature, have investigated the relationship between LLDs and motor function in the elderly. One study (N=641) reported that subjects with and without peripheral arterial disease (PAD) taking statins had better motor performance assessed using a 6-minute walk test (12). In another study (332 PAD patients), the annual decline in lower-extremity performance was less pronounced in patients on statins, while no effect was observed in 212 participants without PAD (13). In the Connecticut Veterans Longitudinal Cohort (N=756), statin users performed better than non-users at timed chair stands (14). Another study showed no association between use of statins and self-reported mobility limitation (21), and a recent study reported no relationship between statin use and physical performance; statin use was not associated with baseline WS or decline in WS in this large cohort of older women (15). However, the proportion of participants treated by statins was lower (9.3%) in the study than in our study (16.0%), and the study used a measure of “usual” WS which is known to decline less over time than fast WS. Our analysis using a measure of usual walking speed suggests similar associations, particularly among the statin users.
Various mechanisms may account for an association between LLDs and slower motor decline. First, fibrates (22) and statins (23) increase HDL-cholesterol, which has been linked to better performance on measures of physical function (8, 24). In our study, baseline HDL-cholesterol was not associated with baseline or WS change in aanalysis adjusted for covariates. However, we did not have data on HDL-cholesterol levels before WS was measured, and as it was not measured again over the follow-up, we were unable to assess the impact of change in HDL-cholesterol on decline in motor function. Two, higher levels of inflammatory markers have been associated with poorer physical performance (25), and our results could be explained by the fact that statins reduce levels of inflammatory markers (10). Three, statins have a favourable effect on atherosclerosis and vascular function, independently of cholesterol levels (26). Four, cerebral white matter lesions (WML), i.e., small lesions supposedly of ischemic origin, are associated with poorer physical performance in the elderly (27), and higher cholesterol levels are associated with WMLs in some studies (28); however, whether LLDs use reduces the progression of WMLs remains controversial (29). Finally, statins may have neuroprotective properties (30), mediated by the activation of neuroprotective signaling pathways (31), or systemic effects such as reduction of oxidative damage (32) and improvement of vascular function (33).
In our study, the proportion of participants using fibrates and statins at baseline was very similar. This study’s baseline assessment took place in 1999–2000, fibrates were frequently used in France at that period. One observational European study reported that 54% of LLDs users in France in 1999 were on fibrates (34). The subsequent decade was marked by a large increase in the use of statins, following the National Cholesterol Education Program Third Adult Treatment Panel (ATP-III) guidelines, published in 2001 (35).
The clinical relevance of our findings lie in the fact that LLDs are under-prescribed in the elderly (Sheppard et al. BMJ 2012) with some concern that they may have harmful effects (refs). Our analysis using a longitudinal design in a large cohort of community dwelling elderly suugests that LLDs use was associated with a 27% slower decline in WS. Accelerated deline in WS is knon to be associated with adverse heatl outco;es such as mortality (Sabia et al. in press). It is possibl tha some of these effects are undersatimated as data come from a well-functioning community-dwelling elderly paticpants where the average decline in WS was not large.
This study has several strengths, including its large size, the long follow-up with up to four assessments of WS and use of LLDs, which allowed us to examine trajectories of LLDs use, and the assessment of a wide range of covariates. Its main limitation is its observational design. Adherence to LLDs therapy may be associated with use of health services, resulting in “healthy user bias” (36). On the other hand, the association between LLDs use and change in WS was robust to adjustment for a range of covariates, and was stronger in analyses using time-dependent meaures of use of LLDs. Therefore, although some level of unmeasured confounding cannot be ruled out, it seems implausible that it could account entirely for the association between LLD and decline in WSobsereved in our study. In addition, other medications (NSAIDs, psychotropic drugs, aspirin) were not associated with WS decline and its association with LLDs use was not attenuated after adjustment for other drugs. It is unlikely that our findings are confounded by socioeconomic status (SES), because analyses were adjuste/d for education and access to medical care which in France is independent of SES as reimbursement for medication is at a high level for everyone. Furthermore, income was not associated with LLD use in our study. Propensity scores are a way to reduce bias in estimates of treatment effects in observational studies, and sensitivity analyses using this method replicated our main findings. Although observational studies have limitations, motor decline is a slow and progressive process making it unrealistic to envision that it would be possible to implement a clinical trial to examine the impact of LLD use on decline in motor function. Such a trial would face difficulties for an outcome such as WS decline, primarily due to the necessity to follow a large population of elderly people over a long period of time; this is similar to identifying protective factors for cognitive decline and dementia(37). Another limitation of our study is that WS was not measured over the follow-up in all participants; we used multiple imputation to deal with missing values using data on important surrogates (e.g., disability, falls) and found results that were similar to those of our main analysis. Finally, regarding the clinical relevance of our findings, the difference in change in WS between LLDs users and non-users corresponds to the effect of 8 years of ageing among untreated subjects in multivariable analyses, and is therefore not negligible.
In summary, LLDs were associated with slower decline in WS in a large population of community-dwelling elderly people followed up to 10 years. There is considerable evidence of under-prescription of LLDs in the elderly (38); in our study, only two-thirds of those with an adverse lipid profile were on LLDs. These findings extend previous research showing that in the elderly LLDs may have beneficial effects beyond cardiovascular disease by providing evidence that these drugs may slow motor decline.
Supplementary Material
Acknowledgments
FUNDING
The 3C study is conducted under a partnership agreement between the Institut National de la Santé et de la Recherche Médicale (INSERM), the Victor Segalen-Bordeaux II University, and the Sanofi-Synthélabo Company. The Fondation pour la Recherche Médicale funded the preparation and initiation of the study. The 3C study is also supported by the Caisse Nationale Maladie des Travailleurs Salariés, Direction Générale de la Santé, Institut National de Prévention et d’Education pour la Santé (INPES), Conseils Régionaux of Bourgogne, Fondation de France, Ministry of Research-INSERM Program, “Cohortes et collections de données biologiques,” Mutuelle Générale de l’Education Nationale, Institut de la Longévité, Conseil Général de la Côte d’or, Fondation Plan Alzheimer. The funding organisations played no role in the design and conduct of the study, in the collection, management, analysis, and interpretation of the data, or in the preparation, review, or approval of the manuscript.
References
- 1.Studenski S, Perera S, Patel K, et al. Gait speed and survival in older adults. JAMA. 2011;305:50–58. doi: 10.1001/jama.2010.1923. [DOI] [PMC free article] [PubMed] [Google Scholar]
- 2.Dumurgier J, Elbaz A, Ducimetiere P, Tavernier B, Alperovitch A, Tzourio C. Slow walking speed and cardiovascular death in well functioning older adults: prospective cohort study. BMJ. 2009;339:b4460. doi: 10.1136/bmj.b4460. [DOI] [PMC free article] [PubMed] [Google Scholar]
- 3.White DK, Neogi T, Nevitt MC, et al. Trajectories of gait speed predict mortality in well-functioning older adults: the Health, Aging and Body Composition study. J Gerontol A Biol Sci Med Sci. 2013;68:456–464. doi: 10.1093/gerona/gls197. [DOI] [PMC free article] [PubMed] [Google Scholar]
- 4.Peel NM, Kuys SS, Klein K. Gait speed as a measure in geriatric assessment in clinical settings: a systematic review. J Gerontol A Biol Sci Med Sci. 2013;68:39–46. doi: 10.1093/gerona/gls174. [DOI] [PubMed] [Google Scholar]
- 5.Dumurgier J, Elbaz A, Dufouil C, Tavernier B, Tzourio C. Hypertension and lower walking speed in the elderly: the Three-City study. J Hypertens. 2010;28:1506–1514. doi: 10.1097/HJH.0b013e328338bbec. [DOI] [PMC free article] [PubMed] [Google Scholar]
- 6.Ko SU, Stenholm S, Chia CW, Simonsick EM, Ferrucci L. Gait pattern alterations in older adults associated with type 2 diabetes in the absence of peripheral neuropathy--results from the Baltimore Longitudinal Study of Aging. Gait Posture. 2011;34:548–552. doi: 10.1016/j.gaitpost.2011.07.014. [DOI] [PMC free article] [PubMed] [Google Scholar]
- 7.Verghese J, Holtzer R, Oh-Park M, Derby CA, Lipton RB, Wang C. Inflammatory markers and gait speed decline in older adults. J Gerontol A Biol Sci Med Sci. 2011;66:1083–1089. doi: 10.1093/gerona/glr099. [DOI] [PMC free article] [PubMed] [Google Scholar]
- 8.Volpato S, Ble A, Metter EJ, et al. High-density lipoprotein cholesterol and objective measures of lower extremity performance in older nondisabled persons: the InChianti study. J Am Geriatr Soc. 2008;56:621–629. doi: 10.1111/j.1532-5415.2007.01608.x. [DOI] [PMC free article] [PubMed] [Google Scholar]
- 9.Cesari M, Marzetti E, Laudisio A, et al. Interaction of HDL cholesterol concentrations on the relationship between physical function and inflammation in community-dwelling older persons. Age Ageing. 2010;39:74–80. doi: 10.1093/ageing/afp194. [DOI] [PMC free article] [PubMed] [Google Scholar]
- 10.Quist-Paulsen P. Statins and inflammation: an update. Curr Opin Cardiol. 2010;25:399–405. doi: 10.1097/HCO.0b013e3283398e53. [DOI] [PubMed] [Google Scholar]
- 11.Corsonello A, Garasto S, Abbatecola AM, et al. Targeting inflammation to slow or delay functional decline: where are we? Biogerontology. 2010;11:603–614. doi: 10.1007/s10522-010-9289-0. [DOI] [PubMed] [Google Scholar]
- 12.McDermott MM, Guralnik JM, Greenland P, et al. Statin use and leg functioning in patients with and without lower-extremity peripheral arterial disease. Circulation. 2003;107:757–761. doi: 10.1161/01.cir.0000050380.64025.07. [DOI] [PubMed] [Google Scholar]
- 13.Giri J, McDermott MM, Greenland P, et al. Statin use and functional decline in patients with and without peripheral arterial disease. J Am Coll Cardiol. 2006;47:998–1004. doi: 10.1016/j.jacc.2005.10.052. [DOI] [PubMed] [Google Scholar]
- 14.Agostini JV, Tinetti ME, Han L, McAvay G, Foody JM, Concato J. Effects of statin use on muscle strength, cognition, and depressive symptoms in older adults. J Am Geriatr Soc. 2007;55:420–425. doi: 10.1111/j.1532-5415.2007.01071.x. [DOI] [PubMed] [Google Scholar]
- 15.Gray SL, Aragaki AK, LaMonte MJ, et al. Statins, angiotensin-converting enzyme inhibitors, and physical performance in older women. J Am Geriatr Soc. 2012;60:2206–2214. doi: 10.1111/jgs.12029. [DOI] [PMC free article] [PubMed] [Google Scholar]
- 16.LaCroix AZ, Gray SL, Aragaki A, et al. Statin use and incident frailty in women aged 65 years or older: prospective findings from the Women’s Health Initiative Observational Study. J Gerontol A Biol Sci Med Sci. 2008;63:369–375. doi: 10.1093/gerona/63.4.369. [DOI] [PubMed] [Google Scholar]
- 17.The 3C Study Group. Vascular factors and risk of dementia: design of the Three-City Study and baseline characteristics of the study population. Neuroepidemiology. 2003;22:316–325. doi: 10.1159/000072920. [DOI] [PubMed] [Google Scholar]
- 18.Bohannon RW. Comfortable and maximum walking speed of adults aged 20–79 years: reference values and determinants. Age Ageing. 1997;26:15–19. doi: 10.1093/ageing/26.1.15. [DOI] [PubMed] [Google Scholar]
- 19.Ko SU, Stenholm S, Metter EJ, Ferrucci L. Age-associated gait patterns and the role of lower extremity strength - results from the Baltimore Longitudinal Study of Aging. Arch Gerontol Geriatr. 2012;55:474–479. doi: 10.1016/j.archger.2012.04.004. [DOI] [PMC free article] [PubMed] [Google Scholar]
- 20.AFSSAPS. Prise en charge thérapeutique du patient dyslipidémique. Recommandations mars 2005. 2005 [PubMed] [Google Scholar]
- 21.Gray SL, Boudreau RM, Newman AB, et al. Angiotensin-Converting Enzyme Inhibitor and Statin Use and Incident Mobility Limitation in Community-Dwelling Older Adults: The Health, Aging and Body Composition Study. J Am Geriatr Soc. 2011;59:2226–2232. doi: 10.1111/j.1532-5415.2011.03721.x. [DOI] [PMC free article] [PubMed] [Google Scholar]
- 22.Birjmohun RS, Hutten BA, Kastelein JJ, Stroes ES. Efficacy and safety of high-density lipoprotein cholesterol-increasing compounds: a meta-analysis of randomized controlled trials. J Am Coll Cardiol. 2005;45:185–197. doi: 10.1016/j.jacc.2004.10.031. [DOI] [PubMed] [Google Scholar]
- 23.Nicholls SJ, Tuzcu EM, Sipahi I, et al. Statins, high-density lipoprotein cholesterol, and regression of coronary atherosclerosis. Jama. 2007;297:499–508. doi: 10.1001/jama.297.5.499. [DOI] [PubMed] [Google Scholar]
- 24.Landi F, Russo A, Cesari M, Pahor M, Bernabei R, Onder G. HDL-cholesterol and physical performance: results from the ageing and longevity study in the sirente geographic area (ilSIRENTE Study) Age Ageing. 2007;36:514–520. doi: 10.1093/ageing/afm105. [DOI] [PubMed] [Google Scholar]
- 25.Cesari M, Penninx BW, Pahor M, et al. Inflammatory markers and physical performance in older persons: the InCHIANTI study. J Gerontol A Biol Sci Med Sci. 2004;59:242–248. doi: 10.1093/gerona/59.3.m242. [DOI] [PubMed] [Google Scholar]
- 26.Fukumoto Y, Libby P, Rabkin E, et al. Statins alter smooth muscle cell accumulation and collagen content in established atheroma of watanabe heritable hyperlipidemic rabbits. Circulation. 2001;103:993–999. doi: 10.1161/01.cir.103.7.993. [DOI] [PubMed] [Google Scholar]
- 27.Soumare A, Elbaz A, Zhu Y, et al. White matter lesions volume and motor performances in the elderly. Ann Neurol. 2009;65:706–715. doi: 10.1002/ana.21674. [DOI] [PubMed] [Google Scholar]
- 28.Murray AD, Staff RT, Shenkin SD, Deary IJ, Starr JM, Whalley LJ. Brain white matter hyperintensities: relative importance of vascular risk factors in nondemented elderly people. Radiology. 2005;237:251–257. doi: 10.1148/radiol.2371041496. [DOI] [PubMed] [Google Scholar]
- 29.Mok VC, Lam WW, Fan YH, et al. Effects of statins on the progression of cerebral white matter lesion: Post hoc analysis of the ROCAS (Regression of Cerebral Artery Stenosis) study. J Neurol. 2009;256:750–757. doi: 10.1007/s00415-009-5008-7. [DOI] [PubMed] [Google Scholar]
- 30.van der Most PJ, Dolga AM, Nijholt IM, Luiten PG, Eisel UL. Statins: mechanisms of neuroprotection. Prog Neurobiol. 2009;88:64–75. doi: 10.1016/j.pneurobio.2009.02.002. [DOI] [PubMed] [Google Scholar]
- 31.Dolga AM, Granic I, Nijholt IM, et al. Pretreatment with lovastatin prevents N-methyl-D-aspartate-induced neurodegeneration in the magnocellular nucleus basalis and behavioral dysfunction. J Alzheimers Dis. 2009;17:327–336. doi: 10.3233/JAD-2009-1052. [DOI] [PubMed] [Google Scholar]
- 32.Tiainen K, Hurme M, Hervonen A, Luukkaala T, Jylha M. Inflammatory markers and physical performance among nonagenarians. J Gerontol A Biol Sci Med Sci. 2010;65:658–663. doi: 10.1093/gerona/glq056. [DOI] [PubMed] [Google Scholar]
- 33.Skaletz-Rorowski A, Walsh K. Statin therapy and angiogenesis. Curr Opin Lipidol. 2003;14:599–603. doi: 10.1097/00041433-200312000-00008. [DOI] [PubMed] [Google Scholar]
- 34.Walley T, Folino-Gallo P, Stephens P, Van Ganse E. Trends in prescribing and utilization of statins and other lipid lowering drugs across Europe 1997–2003. Br J Clin Pharmacol. 2005;60:543–551. doi: 10.1111/j.1365-2125.2005.02478.x. [DOI] [PMC free article] [PubMed] [Google Scholar]
- 35.Mann D, Reynolds K, Smith D, Muntner P. Trends in statin use and low-density lipoprotein cholesterol levels among US adults: impact of the 2001 National Cholesterol Education Program guidelines. Ann Pharmacother. 2008;42:1208–1215. doi: 10.1345/aph.1L181. [DOI] [PubMed] [Google Scholar]
- 36.Brookhart MA, Patrick AR, Dormuth C, et al. Adherence to lipid-lowering therapy and the use of preventive health services: an investigation of the healthy user effect. Am J Epidemiol. 2007;166:348–354. doi: 10.1093/aje/kwm070. [DOI] [PubMed] [Google Scholar]
- 37.Williams JW, Plassman BL, Burke J, Benjamin S. Preventing Alzheimer’s disease and cognitive decline. Evid Rep Technol Assess. 2010;193:297. [PMC free article] [PubMed] [Google Scholar]
- 38.Ko DT, Mamdani M, Alter DA. Lipid-lowering therapy with statins in high-risk elderly patients: the treatment-risk paradox. Jama. 2004;291:1864–1870. doi: 10.1001/jama.291.15.1864. [DOI] [PubMed] [Google Scholar]
Associated Data
This section collects any data citations, data availability statements, or supplementary materials included in this article.