

Summary
Our understanding of the molecular determinants of cancer is still inadequate because of cancer heterogeneity. Here, using epithelial ovarian cancer (EOC) as a model system, we analyzed a minute amount of patient-derived epithelial cells from either healthy or cancerous tissues by single-shot mass-spectrometry-based phosphoproteomics. Using a multi-disciplinary approach, we demonstrated that primary cells recapitulate tissue complexity and represent a valuable source of differentially expressed proteins and phosphorylation sites that discriminate cancer from healthy cells. Furthermore, we uncovered kinase signatures associated with EOC. In particular, CDK7 targets were characterized in both EOC primary cells and ovarian cancer cell lines. We showed that CDK7 controls cell proliferation and that pharmacological inhibition of CDK7 selectively represses EOC cell proliferation. Our approach defines the molecular landscape of EOC, paving the way for efficient therapeutic approaches for patients. Finally, we highlight the potential of phosphoproteomics to identify clinically relevant and druggable pathways in cancer.
Keywords: ovarian cancer, quantitative proteomics, phosphoproteomics, CDK7, POLR2A, alternative splicing, EOC, fimbriae, OSE, THZ1
Graphical Abstract
Highlights
-
•
We analyze ex-vivo-cultured primary cells using phosphoproteomics
-
•
We investigate epithelial ovarian cancer (EOC) and healthy tissue
-
•
We uncover expression of cancer-specific proteins and kinase signatures
-
•
The kinase CDK7 phosphorylates POLR2A and regulates EOC cell proliferation
Francavilla et al. use mass-spectrometry-based phosphoproteomics as a powerful tool to reveal cancer signatures. They analyze changes in the proteome and phosphoproteome of primary cells derived from epithelial ovarian cancer (EOC) compared to healthy tissues and reveal a role for the kinase CDK7 in EOC cell proliferation.
Introduction
The characterization of molecular determinants of cancer has advanced tremendously in the past decades, mainly due to advancements in high-throughput technologies. Deep sequencing approaches at the gene expression level can now be complemented by proteomics. Mass spectrometry (MS)-based proteomics has undergone enormous improvements in the past few years because of more accurate instrumentation and better methods for sample preparation and quantitation (Aebersold and Mann, 2016). Proteomics has enabled the analysis of the expressed protein complement of cells and entire tissues, but it can also analyze post-translationally modified proteins (i.e., phosphorylated proteins [phosphoproteomics]) (Beck et al., 2011, Kim et al., 2014, Lundby et al., 2013, von Stechow et al., 2015, Wilhelm et al., 2014). As proteins and especially phosphoproteins regulate the functional properties of cells (e.g., a phosphorylation site can reflect the activity state of a protein), phosphoproteomics has been employed for the identification of potential pharmaceutical targets (Dias et al., 2015). Furthermore, the implementation of proteomics in combination with genomics to study cancer is now emerging (Mertins et al., 2016, Zhang et al., 2016).
To identify tumor-associated signatures, onco-proteomics studies have investigated cell lines, mice xenografts, or entire biopsies (Geiger et al., 2012, Guo et al., 2015, Ntai et al., 2016, Pozniak et al., 2016, Zhang et al., 2016). However, cell lines recapitulate biology of neoplastic cells within an actual tumor only to a certain extent, and other cell types may contaminate mouse xenografts or entire tissues. In the latter case, discriminating what is tumor specific from the contribution of cells of the tumor microenvironment may be difficult. To overcome this issue, one possibility is to analyze a purer cancer population (i.e., primary cancer cells), as demonstrated for T cells (Mitchell et al., 2015) or endothelial cells (van den Biggelaar et al., 2014). System-wide phosphoproteomics studies of patient-derived-primary cells are, however, underrepresented.
Here, we compared the phosphoproteome of human primary epithelial cells derived from either neoplastic or healthy tissue, thus focusing specifically on pure cell populations of different origin. Besides overcoming the possible contamination of tumor cells with other cell types, our strategy based on primary cells can add new information to the recently published Clinical Proteomic Tumor Analysis Consortium (CPTAC) database, where the molecular profile of the tumors was not compared with their normal counterpart (Zhang et al., 2016).
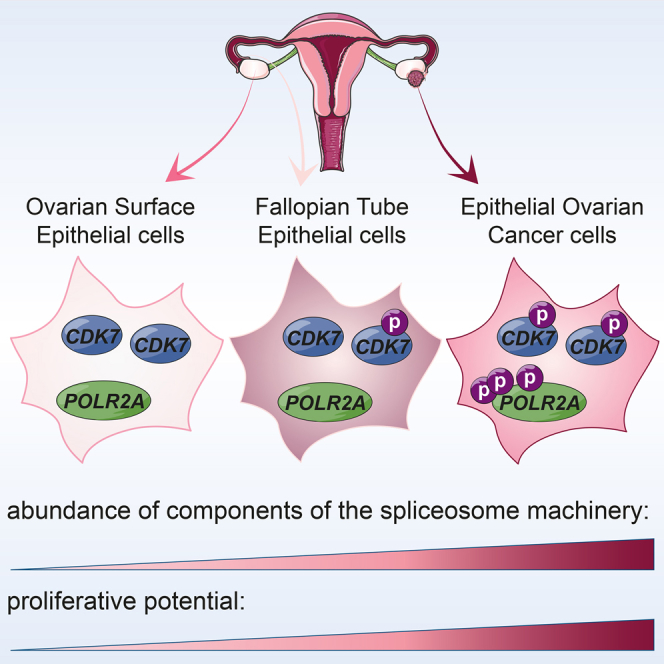
We selected epithelial ovarian cancer (EOC) because it is the most lethal gynecological tumor in developed countries. EOC is a heterogeneous disease of which high-grade serous EOC is the most common and lethal form (Gurung et al., 2013, Kurman and Shih, 2016). Besides mutations in tumor suppressor genes, few recurrent somatic mutations have been associated with EOC (Cancer Genome Atlas Research Network, 2011, Jones and Drapkin, 2013, Kurman and Shih, 2016). Furthermore, both the ovarian surface epithelium (OSE) and the distal fallopian tube epithelium (FTE) can give rise to high-grade serous EOC (Bowtell et al., 2015). Therefore, defining the molecular landscape of high-grade serous EOC and healthy ovarian tissues is challenging. Primary ex vivo cultures of human FTE have been shown to be reliable model for serous ovarian carcinogenesis (Levanon et al., 2010). Here, we performed quantitative phosphoproteomics of ex-vivo-cultured human ovarian epithelial cells and included cells derived either from OSE and FTE or from high-grade serous EOC to get a more accurate picture of ovarian cancer behavior. We developed a rapid and accurate method to analyze less than 1 mg protein in 90-min run-on last-generation mass spectrometers, the Q-Exactives (Kelstrup et al., 2012). Finally, we integrated quantitative phosphoproteomics and bioinformatics analyses with biochemical assays and immunohistochemistry (IHC) to validate our findings. Our comprehensive phosphoproteomics analysis revealed differentially expressed proteins and activated proteins between healthy and pathological samples, thus providing the ovarian cancer community with a valuable resource to better understand the biology of such a complex disease. These results complement and extend the recently published study from the CPTAC investigators, where the proteogenomic analysis of more than 100 high-grade serous carcinomas has revealed novel pathways to stratify patients (Zhang et al., 2016). The main differences between that approach and ours include the fact that the CPTAC consortium did not analyze the normal counterparts of EOC (i.e., OSE and FTE), and we have used pure cultures of primary cells as opposed to whole tumor tissues. Moreover, we have used complementary technologies (i.e., iTRAQ versus label-free methods to quantify changes in protein abundance and post translational modifications [PTMs]). In spite of these differences, we have added new information to the published CPTAC dataset, underscoring the importance of integrating multiple technologies and approaches to study cancer signatures.
Our strategy also revealed novel kinase-mediated functional signatures in EOC. This may pave the way for innovative therapeutic approaches for EOC patients, given that only two drugs having been licensed for EOC treatment in the last five years (Symeonides and Gourley, 2015). To illustrate the power of our approach for quantifying changes in human primary cells and for identifying targetable kinases in cancer, we focused on the role of cyclin-dependent kinase 7 (CDK7), and implicated this signaling pathway in EOC cell proliferation.
Results
Proteomics of Patient-Derived Cells Unveils Differentially Expressed Proteins in FTE, OSE, and EOC
Our first goal was to assess if the ex vivo culture of patient-derived epithelial cells would be a good model system for proteomics analysis of EOC cells and of their normal counterpart. To this end, we compared the molecular profile of high-grade serous EOC with those of non-neoplastic FTE and OSE. The proteome and phosphoproteome of patient-derived primary cells from FTE, OSE, and EOC were analyzed by high-resolution quantitative mass spectrometry (Figure 1A; Table S1). Morphological examination and immunofluorescence staining for specific markers confirmed the epithelial nature of primary cells as well as the absence of other contaminating cell types (Figure S1). We extracted ∼700 μg protein from each cell culture, of which 1% was used for proteome profiling and the rest for enrichment of phosphorylated peptides by TiO2-based chromatography (Figure 1A, bottom). We quantified 5,561 proteins and 7,658 distinct phosphorylation sites using single-run liquid chromatography-tandem mass spectrometry (LC-MS/MS) measurements from 13 independent patient samples (four OSE, four EOC, and five FTE) (Figure 1B; Tables S2 and S3). The distribution of phosphorylated peptides and sites was in line with previous studies (Francavilla et al., 2013) (Figures S2A–S2D), and the coverage of protein and phosphorylated peptides among technical replicates (samples 1, 2, and 4) was high and reproducible (Figures S2E–S2G; Table S1). Unsupervised clustering separated both proteome (Figure S2H) and phosphoproteome (Figure 1C) according to the origin of primary cells. Moreover, the abundance of protein and phosphorylated peptides estimated by their mass spectrometry signal intensities was reproducible with Pearson correlation coefficients above 0.9 for samples of the same origin (Figures 1D and S2I). These findings together confirmed the high reproducibility of our samples. On the contrary, we found a poor correlation (R = 0.14–0.30) between the abundance of phosphorylated peptides and that of their corresponding protein (Figure S2J), suggesting that the analysis of both proteome and phosphoproteome is necessary to derive a tissue-specific signature.
Figure 1.

Proteomics of Patient-Derived Epithelial Cells Reveals Good Coverage of Phosphorylated Sites
(A) Workflow of the proteomics analysis of epithelial cells derived from FTE, OSE, and EOC (see also Figure S1, Table S1, and Supplemental Experimental Procedures).
(B) Numbers of identified proteins (blue) and phosphorylated sites (pink) in the 13 samples analyzed in this study. Data are presented as mean ± SD.
(C) Unsupervised clustering of the phosphoproteome dataset shows separation between tumor and healthy samples.
(D) Heatmap of the Pearson’s correlation (R2) of the phosphoproteome data shows good overall reproducibility among samples deriving from the same tissue (highlighted by black boxes). Numbers and letters indicate individual samples or technical replicates, respectively, according to Table S1.
See also Figures S1 and S2 and Tables S1, S2, and S3.
We first focused on the analysis of the proteome by performing 3D principal-component analysis (3D-PCA) of all the 5,561 identified proteins (Table S2; Figure 2A). The analysis clustered individual samples according to the tissue of origin and separated the proteome of EOCs from that of the two healthy tissues (Figure 2A). The LIMMA Bioconductor package, which accounts for variability among samples and among proteins of the same sample (Wettenhall and Smyth, 2004), identified 49 differentially expressed proteins among the three cell types (Table S2). Hierarchical clustering separated these proteins in four main clusters (Figure 2B; Table S2). Proteins that were specifically enriched in EOC cells were represented in cluster 1; those present in both FTE and EOC, but not OSE, were represented in cluster 2; proteins more abundant in non-neoplastic cells were represented in cluster 3; and those specific to OSE were represented in cluster 4 (Figure 2B; Table S2). To validate our proteomics approach, we selected proteins found in different clusters. Cluster 1 contained the known EOC marker MUC16 (or CA125) (Neunteufel and Breitenecker, 1989). The D-3-phosphoglycerate dehydrogenase PHGDH involved in serine biosynthesis (Luo, 2011) and the auxiliary subunit of GABA-B receptors KCTD12 (Cathomas et al., 2015) were chosen to represent cluster 2. Finally, the transmembrane neuropilin-like protein DCBLD2 (Kobuke et al., 2001) belonged to cluster 3. With the exception of MUC16, none of these proteins have previously been associated with EOC. Western blot (WB) analysis in independent primary cell cultures confirmed the mass spectrometry results for all the proteins (Figure 2C), indicating the reliability of our approach. The levels of PHGDH and KCTD12 were also evaluated on a larger cohort of samples by IHC on tissue microarrays (TMAs). This analysis revealed higher expression of both proteins in a significant proportion of high-grade serous EOC, metastasis, and healthy FTE compared to OSE (Figure 2D). These data suggested that our approach based on quantitative proteomics of ex-vivo-cultured primary epithelial cells derived from one specific cell type is well suited to capture the characteristics of the original tissue, thus offering a reliable model for further molecular analysis of serous ovarian carcinogenesis.
Figure 2.

Proteomic Analysis Discloses Differentially Expressed Proteins
(A) 3D-PCA of all the proteins quantified in independent samples for each tissue. Missing values have not been considered.
(B) Hierarchical clustering of the proteins differentially expressed in four independent samples derived from each of the three cell types. The identified clusters 1–4 are highlighted on the right and separated by a black line. Protein intensity is presented on the logarithmic scale with intensity below and above the mean color-coded in blue and red, respectively. The proteins highlighted in the different clusters were selected for further validation.
(C) Lysates from three independent samples derived from each tissue (see Table S1) were subjected to WB analysis with the indicated antibodies. Vinculin was used as loading control. The experiment was repeated twice with analogous results.
(D) The two histograms show the intensity of the staining for PHGDH (top) and KCTD12 (bottom) in normal OSE, FTE, serous adenocarcinomas, and metastasis (number of samples: 15 OSE, 18 fimbriae, 84 serous adenocarcinomas, and 34 metastases). Data are presented as mean ± SD. ∗p < 0.001 compared to OSE (Wilcoxon test).
See also Table S2.
Phosphoproteomics of Patient-Derived Cells Identifies CDK7 and POLR2A in EOC
As less than 1% of the proteome was differentially regulated in the three cell types (49 out of 5,561 proteins), we hypothesized that specific biological differences among tissues reside within the signaling state of the proteomes, which can be probed by analyzing the phosphoproteome. We first performed 3D-PCA of all the 7,658 quantified phosphorylated sites (Table S3). The projections of the data on the plane of the first two and three principal components clustered individual samples according to the tissue of origin and clearly separated the phosphoproteome of EOCs from that of the two healthy tissues (Figure 3A), implying that different signaling pathways are activated in the three cell types. This idea was confirmed by KEGG (Kyoto Encyclopedia of Genes and Genomes) pathway and GO (Gene Ontology) analyses. In particular, we observed a strong enrichment for spliceosome components as well as the overrepresentation of proteins involved in cytoskeletal rearrangement in EOC compared to healthy tissues (Figures 3B–3D). Next, we analyzed the differentially regulated phosphorylated sites among the three cell types with the LIMMA Bioconductor package (see above and Supplemental Experimental Procedures). We found 309 sites abundant in OSE and FTE, but not in EOC (cluster A); 35 sites present in both FTE and EOC, but not OSE (cluster B); and 448 highly abundant sites in EOC (cluster C) (Figures 4A and S3A; Table S3). In total, ∼10% of the phosphoproteome (792 out of 7,658) was found to be differentially regulated in the three cell types. This proportion of regulated phosphorylation sites was consistent with previous data from large-scale phosphoproteomics of human cancer cells (Olsen and Mann, 2013). Furthermore, 495 of the phosphorylated proteins whose sites were differentially regulated among EOC, OSE, and FTE have been previously identified in ovarian tumors (Zhang et al., 2016) (Figure S3B).
Figure 3.

The Phosphoproteomes of EOC and Healthy Tissues Are Different
(A) 3D-PCA of all the phosphorylated sites of independent samples for each tissue. Missing values have not been considered.
(B and C) KEGG pathways analysis (B) and biological processes (GO terms BP) (C) enriched in EOC samples. The analysis included 1,026 sites.
(D) Network of the phosphorylated sites of EOC samples belonging to the enriched pathways shown in (B), based on STRING and visualized in Cytoscape. The Cytoscape plug-in MCODE revealed enriched networks of phosphorylated proteins of the spliceosome and actin cytoskeleton.
See also Table S3.
Figure 4.

The EOC Phosphoproteome Is Enriched in Proteins Belonging to Spliceosome
(A) Hierarchical clustering of the 792 phosphorylated sites differentially expressed in four independent samples derived from each of the three cell types. The three clusters termed A–C are highlighted on the right and separated by a black line. The intensity of phosphorylated sites is presented on the logarithmic scale with intensity below and above the mean color-coded in blue and red, respectively.
(B) Biological Processes (GO term) enriched in each of the three clusters.
(C) Sequence motif analysis of the ± six-amino-acid residues flanking the regulated phosphorylation site identified in cluster C compared to cluster A.
(D) Kinases substrate motif enriched in cluster C.
(E) Network of proteins belonging to the GO term spliceosome (cluster C; Table S4) based on STRING and visualized in Cytoscape. Proteins whose phosphorylated sites were found in the PCA analysis (Figure 3A) are represented with a pink border; transcription factors and kinases are color-coded in light blue and pink, respectively. The light blue and pink clouds surrounding two distinct groups of proteins are based on the comparison of this dataset with the analysis of splicing components shown in Papasaikas et al. (2015). The color of the text is based on the sequence motif analysis shown in (F).
(F) Sequence motif analysis of the ± six-amino-acid residues flanking the 100 phosphorylation sites belonging to the GO term spliceosome enriched in cluster C.
See also Figures S3 and S4 and Tables S4 and S5.
As shown in Figures 3B–3D, GO term analysis revealed a remarkable enrichment for spliceosome components in EOC (cluster C), confirming the results of PCA. Cell cycle and chromosome organization were GO terms enriched in both FTE and EOC (cluster B) (Figure 4B). Finally, signaling, cytoskeletal organization, and focal adhesion were enriched terms in healthy cell types, both FTE and OSE, as compared to EOC (cluster A) (Figures 4B and S3C). These findings support the differential activation of specific signaling networks in each of the three cell types.
The specificity of many protein kinases is encoded in consensus sequences surrounding the serine/threonine residues that are phosphorylated. Thus, to identify the protein kinases more active in tumors than in normal tissue, we performed a linear sequence motif analysis of the differentially regulated phosphorylation sites. This analysis revealed a strong bias toward arginine and serine in close proximity to the phosphorylated sites in cluster C compared to the sites in cluster A (Figure 4C), suggesting higher activation of basophilic kinases in tumor cells. The overrepresentation in EOC of substrate motifs for the basophilic kinases protein kinase A (PKA), protein kinase B (PKB, or AKT), and protein kinase C (PKC) confirmed this hypothesis (Figure 4D). We then focused on spliceosome components that were highly enriched in EOC (Figure 4B) and analyzed the 100 phosphorylated sites on spliceosome proteins for kinase preferences. A stronger enrichment for MAPK/CDK substrate sites and the general overrepresentation of proline-directed sites (64/100) - against the 26 out of 100 sites enriched for basophilic kinases motives - were specifically observed in this subset of Cluster C (Figures 4E and 4F; Tables S4 and S5). We therefore wondered which kinases were activated in cancer tissues that could explain the enrichment for mitogen-activated protein kinase (MAPK)/cyclin-dependent kinase (CDK), but not basophilic kinase substrates, in this subgroup of cancer-specific proteins enriched for spliceosome components. We noticed that the proline-directed CDK7 was phosphorylated on a peptide covering the kinase domain activation loop in not only EOC but also FTE (Figures S3D and S3E; Tables S3 and S4). CDK7 therefore belonged to cluster B (Figures S3D and 4B). The fact that CDK7 regulates both cell-cycle-related events and polymerase II alpha (POLR2A)-mediated transcription (Fisher, 2005) may explain why cluster B was enriched in nuclear proteins and proteins with a role in the cell cycle (Figures S3D and 4B). Finally, although our analysis could not exclude a role for other kinases, the presence of activated CDK7 in EOC was consistent with the overrepresentation of proline-directed kinase substrates and with the functional category spliceosome among all the EOC sites (Figure 4).
Of the 26 phosphorylated proteins belonging to the GO term spliceosome enriched in EOC (cluster C), 14 have previously been associated to spliceosome core machinery or splicing factors in cancer (Papasaikas et al., 2015) (Figure 4E). We also detected phosphorylated peptides covering the tandem seven-amino-acid C-terminal domain (CTD) repeats of POLR2A, whose phosphorylation is associated to the regulation of transcription and alternative splicing (Muñoz et al., 2010) (Figures 4E and S3F). Thus, we tested whether peptides in proteins with splicing variants were overrepresented in EOC proteome compared to the proteome of healthy cells. Mapping the 74,566 unique peptide sequences identified in our dataset to the UniProt protein database identified more than 50% of the peptides matching to proteins with known alternative splice variants (Figure S3G). We found a significant overrepresentation of peptides in proteins with splicing variants among EOC-regulated phosphorylated peptides (Figure S3H; Table S4), which suggests a higher degree of splicing in tumor cells compared to healthy tissues. Taken together, our results suggest crosstalk among CDK7 activation, POLR2A phosphorylation, and the spliceosome machinery in EOC (Figure S4).
CDK7 Is Activated in Ovarian Cancer
To test our hypothesis on the CDK7/POLR2A axis in EOC, we first verified the activation of CDK7 and POLR2A by checking for their phosphorylation status in primary cells and in a panel of EOC cell lines. Immunoblotting analysis showed that both CDK7 and POLR2A were phosphorylated in three independent cultures of EOC, but not (or very little) in its healthy counterparts (Figure 5A). The activation of CDK7 in EOC primary cells was also confirmed in six different ovarian cancer cell lines (Figure S5A). These findings validated our phosphoproteomics analysis, which had assigned activated CDK7 to cluster B (EOC and FTE; Figure S3D). Furthermore, IHC analysis on tissue biopsy specimens supported CDK7 phosphorylation only in EOC and FTE (Figure S5B). A similar pattern of active and total CDK7 was also observed in recurrent high-grade serous ovarian carcinoma from patients previously subjected to primary debulking surgery followed by carboplatin/paclitaxel chemotherapy (Figure S5C; Table S1). Figure S5C shows two representative samples of recurrent high-grade serous ovarian carcinoma out of the 14 samples analyzed and found positive for active CDK7. Network analysis of known CDK7-associated proteins highlighted cell-cycle regulation and RNA splicing as enriched biological functions (Figure S5D; Table S5). We also observed that 29% of the CDK7-associated proteins were related to pathological conditions, including EOC and other cancer types (Figure S5D; Table S5), which points to CDK7 as a potential drug target. Furthermore, this analysis revealed a sub-network of phosphorylated proteins centered on POLR2A, which were also identified in our phosphoproteomics dataset on primary cells (Figure S5E; Table S5). Therefore, our data confirmed the existence of a functional link between CDK7 and POLR2A (Kwiatkowski et al., 2014, Nilson et al., 2015).
Figure 5.

Phosphoproteomics Identifies CDK7-Associated Proteins
(A) Lysates from three independent samples derived from each tissue (see Table S1) were subjected to immunoblotting with the indicated antibodies. Tubulin was used as loading control. The experiment was repeated three times with analogous results.
(B) OVCAR3 cells treated with DMSO (control), the CDK7 inhibitor THZ1, or the MEK inhibitor U0126 were subjected to immunoblotting with the indicated antibodies. THZ1, but not U0126, inhibits POLR2A phosphorylation. Tubulin was used as loading control. Lanes 1–3 represent independent biological replicates.
(C) Hierarchical clustering of proteins differentially phosphorylated upon treatment with the CDK7 or MEK inhibitor. The four identified clusters are highlighted on the left and separated by a black line. Protein intensity is presented on the logarithmic scale with treated/control intensity below and above the mean colored-coded in red and blue, respectively.
(D) Sequence motif analysis of the ± six-amino-acid residues flanking the phosphorylated site identified among the CDK7-associated (top) or MEK-associated (bottom) proteins.
(E) GO term biological processes enriched in the CDK7 or MEK cluster.
(F) List of the phosphorylated sites of POLR2A identified in OVCAR3 that are CDK7 regulated and/or found in patient-derived cells. CTD, C-terminal domain of POLR2A. S2 and S5 refer to the position of the phosphorylated serine in the repetitive stretch of amino acids found in the CTD of POLR2A.
(G) Network based on STRING and visualized in Cytoscape of the CDK7-associated proteins (from C). Only the proteins also found in patient-derived cells are shown on the left. For a complete list, see Figure S6 and Table S6. CDK7-associated proteins enriched in the POLR2A cluster are shown on the right.
See also Figures S5 and S6 and Table S6.
To validate the crosstalk of CDK7 with POLR2A and the CDK7, proline-directed signature in EOC, we performed a large-scale quantitative phosphoproteomics experiment in the EOC cell line OVCAR3. We selected this cell line because it recapitulates several biological feature of high-grade serous EOC, including TP53 mutations and substantial gene copy-number alterations (Domcke et al., 2013). Untreated cells were compared to cells treated with THZ1, a specific inhibitor of CDK7 that covalently binds to a conserved cysteine in the kinase domain of CDK7 (Kwiatkowski et al., 2014). The mitogen-activated protein kinase kinase (MEK) inhibitor U0126 (Duncia et al., 1998) was used as control (Figure S6A). The specific effects of THZ1 and U0126 treatment on the phosphorylation of POLR2A and extracellular signal-regulated kinases (ERK), respectively, were confirmed by WB analysis (Figure 5B). We quantified 13,194 phosphorylation sites using label-free quantitation (Table S6) and observed high reproducibility between biological replicates with Pearson correlation coefficients above 0.75 (Figure S6B). The quality of this phosphoproteomics dataset was comparable to that observed in primary cells, as assessed by high reproducibility of the independent biological replicates (Figures S6B–S6F). By hierarchical cluster analysis of the difference in phosphorylated peptide intensity between treated and untreated controls, we identified four main groups of phosphorylation sites: 1,896 sites affected by inhibition of CDK7, 3,149 sites affected by MEK inhibition, 4,781 sites affected by inhibition of both kinases, and 3,361 sites that were unaffected by either treatment (Figure 5C). As expected, linear sequence motif analysis of the amino acid sequence surrounding the phosphorylation sites revealed a significant overrepresentation of proline-directed sites among the MEK-associated proteins (Roskoski, 2012) (Figure 5D). We observed overrepresentation of proline-directed sites among CDK7-associated proteins as well, but these sites also have significant enrichment of arginine in −3 position (Figure 5D). The dual RXXSP motif overrepresented among CDK7 targets in OVCAR3 cells was analogous to the enriched phosphorylation site sequence motif found among spliceosome components in patient-derived EOC (Figure 4F). The similarity with primary cell phosphoproteome was further confirmed by the overrepresentation of RNA splicing and spliceosome components among the CDK7-associated proteins. On the contrary, MEK-associated proteins were enriched for proteins involved in cell-cycle regulation (Figure 5E). We also quantified several CDK7-regulated phosphorylated peptides containing serine 5 (S5) in the CTD repeats of POLR2A (Figure 5F). The phosphorylation of S5 in the CTD repeats of POLR2A is crucial for POLR2A function (Kwiatkowski et al., 2014, Muñoz et al., 2010). Interestingly, many of these sites were identical to those found upregulated in EOC (Figure 5F; Tables S4, S5, S6, S7, and S8). Both a highly interconnected sub-network centered on POLR2A and several transcription factors and spliceosome components were found among the CDK7-associated proteins in OVCAR3 cells, with a significant fraction of phosphorylated proteins that overlapped with those identified in patient-derived EOC (Figures 5G and S6G; Table S6). Altogether, these findings confirmed the functional crosstalk among CDK7 activation, POLR2A phosphorylation, transcription, and spliceosome components in EOC cell lines and patient-derived cells.
As CDK7 has recently emerged as a prominent target for treating cancer (Cao and Shilatifard, 2014, Christensen et al., 2014), we tested EOC sensitivity to THZ1 using five EOC cell lines (OVCAR3, SKOV3, HEYA8, COV362, and COV318). THZ1 treatment reduced the activation of POLR2A after 4-hr treatment as well as cell proliferation after 72-hr treatment in all cell lines (Figures 6A and 6B). The inhibition of phosphatidylinositol 3-kinase (PI3K), one of the few genes known to be mutated in ovarian cancer (Cancer Genome Atlas Research Network, 2011), with LY294002 was used as a control. Finally, THZ1 treatment did not affect the proliferation of HeLa, A549, or MCF7 cancer cells (Figure 6C), which are of cervix, lung, and breast cancer origin, respectively, implying that CDK7 inhibition is specific for EOC. To verify the causal link between CDK7 activation and POLR2A phosphorylation, we transfected OVCAR3, COV318, or COV362 cells with two different small interfering RNA (siRNA) sequences against CDK7. Ablation of CDK7 reduced dramatically the phosphorylation of POLR2A in all the cell lines (Figure 6D). Moreover, CDK7 knockdown also resulted in the inhibition of cell proliferation for all three cell lines (Figure 6E), thus supporting the role of CDK7 in EOC cell proliferation.
Figure 6.

CDK7 Inhibition Affects the Proliferation of Ovarian Cancer Cells
(A) Lysates from different ovarian cancer cell lines, either untreated or treated with DMSO, the PI3K inhibitor LY294002, or the CDK7 inhibitor THZ1 for 4 hr were subjected to immunoblotting with the indicated antibodies. Vinculin was used as loading control. The experiment was repeated three times with analogous results.
(B) Cell proliferation of ovarian cancer cells treated for 72 hr with the indicated inhibitors. Data represent the mean ± SEM of three experiments. ∗p value < 0.05 compared to untreated cells or cells treated with DMSO. Black line represents untreated cells at time 0.
(C) Cell proliferation of cancer cells of different origin treated for 72 hr with THZ1 or DMSO as indicated. Data represent the mean ± SEM of three experiments. Black line represents untreated cells at time 0.
(D) Lysates from OVCAR3, COV318, or COV362 cells, either not transfected or transfected with two different siRNA sequences against CDK7 or with a control siRNA, were subjected to immunoblotting with the indicated antibodies.
(E) Cell proliferation of EOC cell lines treated as in (D) for 72 hr. Data represent the mean ± SEM of three experiments. ∗p < 0.05 compared to untreated cells or cells treated with control siRNA. Black line represents untreated cells at time 0.
Altogether, our data show the specific activation of a CDK7/POLR2A axis in EOC cells and implicate CDK7 in the regulation of EOC cell proliferation.
Discussion
Our proteomics and phosphoproteomics approach, applied to a low amount of patient-derived epithelial cells, uncovered a previously unknown molecular signature of EOC, paving the way for a better understanding of EOC biology and for unique opportunities of therapeutic intervention.
The analysis of less than 1 mg protein for each ovarian tissue reached a deep coverage of differentially expressed proteins and phosphorylation events in line with previous studies (for instance, Elschenbroich et al., 2011, Kim et al., 2008, Waldemarson et al., 2012). It is worth noting that we reached such coverage of signaling events under steady-state growing conditions. While on one hand this allows an unbiased analysis, on the other it does not address the possible effect of individual hormones or growth factors. We believe that this simple and robust protocol can easily be implemented in translational laboratories focusing on cancer signaling and phosphoproteomics. Soon, it may even be routinely used in the clinic and complement IHC analysis. As methods for sample preparation rapidly improve (Batth and Olsen, 2016, Kulak et al., 2014), mass spectrometry-based proteomics is now robust and sufficiently reproducible to allow large-scale analysis of clinical material (Guo et al., 2015). Phosphoproteomics in particular promises to become a powerful complementary technology to transcriptomics and single-cell RNA sequencing for the analysis of patient samples. This is due to the fact that the analysis of protein or mRNA abundance alone cannot always predict changes in the level of phosphorylated proteins and hence the activity state of cellular signaling networks. Deregulation of protein phosphorylation is a key driver of tumorigenesis; thus, the analysis of cancer phosphoproteomes is crucial not only for gathering information on cancer cell biology but also for drug discovery (Dias et al., 2015, von Stechow et al., 2015). Targeting signaling networks might emerge as the most effective personalized treatment for patients in the near future.
In this study, phosphoproteomics of a specific cell type (patient-derived epithelial cells) resulted in the identification of a unique cancer signature that was also validated by IHC on whole sections and by TMA. Therefore, primary cells represent a useful in vitro model to recapitulate, at least to some extent, the histopathological complexity of cancer. We envision that, together with tumor xenograft models (Ricci et al., 2014), proteomics of patient-derived cells will be used to study the biology of EOC and other cancer types at an unprecedented molecular resolution to identify tumor-specific markers. Similar analyses need to be conducted on samples from tumor of different origin, thus improving our molecular understanding of tumorigenesis.
EOC is most often diagnosed at a rarely curable late stage. Proteomic profiling of patient-derived samples may lead to the discovery of predictive markers that would guide the therapeutic decision-making process (Lee and Kohn, 2010). For example, PHGDH has been associated with cell proliferation (Du et al., 2010) and metabolic alterations in cancer (Luo, 2011). Here, we demonstrated that the high expression of PHGDH correlates within high-grade serous EOC (Figure 2). Thus, our data provide the rationale for testing the inhibition of PHGDH activity as a novel approach for EOC treatment (Pacold et al., 2016). Another relevant aspect of our analysis is the possibility to contribute to clarify the issue of EOC origin. Both the proteome and the phosphoproteome of primary cells exhibited clusters of hits in common between FTE and EOC, but no significant overlap was found between EOC and OSE (Figures 2, 3, and 4). These results, therefore, lend further support to the notion that at least a high proportion of high-grade serous EOC derives from the FTE (Bowtell et al., 2015).
Our phosphoproteomics analysis pointed to the cyclin-dependent kinase CDK7 as a potential player in EOC development. In particular, we observed that the association of CDK7 phosphorylation with the activation of its target, RNA polymerase II (POLR2A), was a specific feature of patient-derived cancer samples and cancer cell lines (Figures 4, 5, and 6). Indeed, CDK7 phosphorylation was also detected also in FTE cells, although to a lesser extent, but no POLR2A activation was found. Mechanistically, it is possible that CDK7 activity in FTE was too low to allow for POLR2A phosphorylation. Alternatively, CDK7-mediated activation of POLR2A occurs in a tumor cell context-dependent manner. Regardless of the underlying mechanisms, these data suggest that the CDK7/POLR2A axis, rather than CDK7 activation alone, is involved in EOC development, and further research is warranted to elucidate how this axis influences the pathobiology of EOC. Our results might open a novel therapeutic window for the treatment of EOC, in line with recent studies reporting that blocking CDK7 with THZ1, a covalent inhibitor of CDK7 (Kwiatkowski et al., 2014), specifically killed triple-negative breast cancer cells (Wang et al., 2015). Perhaps CDK7-dependent phosphorylation of POLR2A (Figure 6) is responsible for cancer cell proliferation, in line with recent data linking POLR2A activation with colon cancer (Liu et al., 2015). For example, the CDK7 inhibitor THZ1, which does not interfere with CDK7 phosphorylation (Kwiatkowski et al., 2014), can be combined with the blockade of transcriptional regulators (Asghar et al., 2015, Gonda and Ramsay, 2015). However, future studies should address how one can control for the dual role of CDK7 during cell cycle and activation of transcription (Fisher, 2005). The EOC-specific signature CDK7/POLR2A/spliceosome component is an attractive target for pharmacological intervention, as alternative splicing is a key element in gene expression and has been associated to diseases (Tazi et al., 2009).
In the context of cutting-edge and multidisciplinary analysis of cancer signatures, determining changes in both the transcriptome and proteome will complement classical IHC studies, providing molecular biomarkers and targets for personalized treatments. Identifying cancer biomarkers by proteomics investigations, for example by quantitative phosphoproteomics of ex-vivo-cultured patient-derived primary cells, could lead to better-informed decisions about treatment, which translates into real benefits for patients.
Experimental Procedures
Tissue Samples
All tissue samples were obtained upon informed consent from women (age 45–75 years) undergoing surgery at the Gynecology Division of the European Institute of Oncology (Milan) and collected via standardized operative procedures approved by the Institutional Ethical Board (European Institute of Oncology, Milano, Italy). Table S1 contains a list of the samples together with the patients’ diagnosis and the use of each sample in this study.
Cell Culture
To derive OSE and FTE cells, healthy ovarian cortical tissues and fimbriae were incubated with dispase and red blood cells were eliminated. EOC cells were derived either from peritoneal fluid (ascites) or from tumor biopsy specimens. All primary epithelial cells were cultured on collagen-I-coated plates for a maximum of three passages. All cell lines were purchased from ATCC and maintained in the indicated conditions.
Cell Lysis and Assays
After the indicated treatment, cell extraction and immunoblotting or cell proliferation assay were performed as described previously (Francavilla et al., 2013).
Immunofluorescence
Primary cells were fixed with 4% paraformaldehyde (PFA) and incubated with primary antibodies for 2 hr at room temperature. All secondary antibodies were incubated for 1 hr at room temperature, and nuclei were counterstained with DAPI. Coverslips were then mounted with Mowiol. Images were acquired with an OLYMPUS BX63 microscope (20× objective) and processed by the software Fiji.
IHC Staining
The IHC analysis was carried out on four healthy ovaries, four healthy FTE, four primary EOC, and 14 recurrent EOC (Table S1). Immunostaining was performed on 3-μm sections from formalin-fixed, paraffin-embedded tissue samples. Dako EnVision+ System-HRP Labeled Polymer was used for detection, in combination with Dako chromogen substrate (Liquid DAB+ Substrate Chromogen System). Sections were counterstained with hematoxylin. Pictures of stained sections were acquired with the scanner Aperio ScanScope XT (20× objective). IHC staining was assessed by a trained pathologist (G.B.).
TMA
TMA analysis was carried out as previously described (Zecchini et al., 2008). Pictures of stained TMAs were acquired with the scanner Aperio ScanScope XT (20× objective). IHC scoring was performed by a trained pathologist (G.B.).
Sample Preparation for Mass Spectrometry
The pellet of primary cells or of OVCAR3 cells was dissolved in denaturation buffer, and 700 μg protein from each sample was analyzed. Proteins were digested with endoproteinase Lys-C and sequencing grade modified trypsin. Peptides were purified using reversed-phase Sep-Pak C18 cartridges and eluted with 50% acetonitrile. A small amount of the eluted peptides (1%) was taken for proteome analysis. The remaining peptides were used for the analysis of phosphoproteome as previously described (Jersie-Christensen et al., 2016).
Mass Spectrometry Analysis
Peptide mixtures were analyzed using an EASY-nLC system (Proxeon) connected to a Q-Exactive mass spectrometer (Thermo Fisher Scientific), as described previously (Kelstrup et al., 2012).
Raw Files Analysis
Raw data were analyzed by the MaxQuant software suite (Cox and Mann, 2008), version 1.4.1.4, using the integrated Andromeda search engine (Cox et al., 2011). Only peptides with an Andromeda score >40 were included.
Data Analysis
The samples were grouped in three categories representing EOC, FTE, and OSE and we used the LIMMA package of Bioconductor in R (Wettenhall and Smyth, 2004) to detect significant changes in abundance among the three groups.
Statistics
All experiments were performed at least three times. The mass spectrometry data were normalized before further analysis. p values were calculated by Student’s two tailed t test, Wilcoxon test, or Fisher’s exact test, as indicated. A statistically significant difference was concluded when p < 0.05 or p < 0.001 as reported in the figure legends.
Author Contributions
M.L. provided part of the primary samples described in Table S1 and performed experiments shown in Figures S1C and S5A–S5C. K.T. performed the analysis of mass spectrometry data shown in Figures 2A, 2B, 3A–3C, 4A, 4B, S3B–S3H, S4, S5D, and S5E. A.V. provided part of the primary samples described in Table S1 and performed the experiments shown in Figures 2D, S1A, S1B, and S5B. K.K. performed experiments shown in Figures 6D and 6E. R.R.J.-C. helped with the preparation of samples of all the mass spectrometry experiments. G.B. is the trained pathologist who evaluated all the IHC (Figures S5B and S5C) and TMA data (Figure 2D). S.C. performed the statistical analysis of IHC results. S.B. edited the manuscript. L.J.J. conceived the experiment shown in Figures S3G and S3H, edited the manuscript, and supervised K.P.T. U.C. supervised A.V. and M.L. C.F. generated and analyzed the data shown in remaining figures and supervised K.K. and R.R.J.-C. C.F., U.C., and J.V.O. conceived the study, designed the experiments, critically evaluated the results, and wrote the manuscript.
Acknowledgments
The authors thank all lab members for fruitful discussion. We are grateful to Prof. P.P. Di Fiore (IEO, Milan) for critically reading the manuscript and for his support. We thank all the patients who gave their informed consent and the clinical staff of the IEO Gynecology Division, the IEO Pathology Department, and the Biobank staff for providing the tissue samples. We thank G. Jodice, C. Luise, and all the members of Molecular Pathology Unit at IEO for their help in preparing the TMA and for the IHC staining. Work at The Novo Nordisk Foundation Center for Protein Research (CPR) is funded in part by a generous donation from the Novo Nordisk Foundation (grant number NNF14CC0001). The proteomics technology developments applied here are part of a project that has received funding from the European Union’s Horizon 2020 research and innovation programme (grant number 686547) and from the Danish Research Council (research career program FSS Sapere Aude to J.V.O.). We would like to thank the PRO-MS Danish Mass Spectrometry Platform for Functional Proteomics and the CPR Mass Spectrometry Platform for instrument support and assistance. J.V.O. was supported by the Danish Cancer Society (R90-A5844 KBVU) and Lundbeckfonden (R191-2015-703). C.F. was supported by Marie Curie IEF (FP7-PEOPLE-2009-IEF, project number 252594), EMBO Long-Term (ALTF 746-2009) post-doctoral fellowships, and the Wellcome Trust (107636/Z/15/Z). Work at the European Institute of Oncology was supported by Associazione Italiana Ricerca sul Cancro (AIRC; grant IG- 1462) and Association for International Cancer Research (AICR; grant 10-0091) (to U.C.), AIRC (fellowship number 12378) and Fondazione Umberto Veronesi postdoctoral fellowships (to A.V.), and Fondazione Istituto Europeo di Oncologia postdoctoral fellowships (to M.L.).
Published: March 28, 2017
Footnotes
Supplemental Information includes Supplemental Experimental Procedures, six figures, and seven tables and can be found with this article online at http://dx.doi.org/10.1016/j.celrep.2017.03.015.
Contributor Information
Chiara Francavilla, Email: chiara.francavilla@manchester.ac.uk.
Ugo Cavallaro, Email: ugo.cavallaro@ieo.it.
Jesper V. Olsen, Email: jesper.olsen@cpr.ku.dk.
Accession Numbers
The accession number for the mass spectrometry proteomics data reported in this paper is ProteomeXchange: PXD003531 (Vizcaino et al., 2010) (project name: Proteomics of Primary cells derived from Ovarian Cancer; reviewer account details: reviewer24193@ebi.ac.uk; password: DdbisBPj).
Supplemental Information
N: arbitrary and sequential numbers. Samples 1, 2, and 4 have been separated in two technical replicates. Sample: samples derived from normal FTE (FTE), normal ovarian surface epithelium (OSE) or from ascites of patients with high grade serous ovarian cancer (EOC). Samples 42 and 43 are two independent samples of recurrent high-grade serous ovarian carcinoma from patients who had been previously treated with primary debulking surgery followed by carboplatin/paclitaxel chemotherapy. Diagnosis: diagnosis of the patient the sample derived from. Technique: MS analysis, WB, IHC, IF indicate whether the sample has been used for the proteomic, western blot, immunohistochemical, imaging analysis, respectively. In case of IHC we did not use patient-derived epithelial cells but part of the entire biopsy. Please, note that we have used different sample set for different analysis depending on the amount of cells or proteins available from each primary culture. Note: additional information on a particular sample.
Of the 5561 identified proteins we filtered proteins identified with less than two peptides and with poor sequence coverage (less than 5%) before further analysis (4457 proteins). MUC16/CA125 and PRSS8 are identified by an asterisk. Proteins in red were differentially expressed in the three tissues based on intensity. The log10 intensity is reported for all the samples as well as the normalized mean. We also reported the significant p value after the analysis with the LIMMA Bioconductor package in R and the cluster.
Sequence window, phosphorylated amino acid residue, the log10 intensity of all phosphorylated sites with localization probabilities higher than 0.75 (class I), the normalized mean, the GO terms, the significant p value after the analysis with the LIMMA Bioconductor package in R, the significance in the PCA analysis or after the comparison with Lawrence et al. (2014) are reported for all the samples. CDK7 is shown in red.
Sequence window, phosphorylated amino acid residue, the cluster letter, the p value after the analysis with the LIMMA Bioconductor package in R are reported for all the samples. P-values < 0.05 and p-values >=0.05 are color-coded in shades of red and of blue, respectively. The phosphorylated sites whose proteins have been also identified in the proteome dataset are marked with a YES. If the p-value remained significant also after the normalization of the intensity of the site over the intensity of its protein they were marked with a ‘+’ (175 out of 665 sites). The peptide found in proteins with splicing variants were marked with a ‘+’. CDK7 and POLR2A are shown in red. CDK7: the doubly phosphorylated peptide is reported.
Sequence window, phosphorylated amino acid residue, the biological function, the significance in the PCA analysis or after comparison with the proteome analysis, the kinase motif, the function according to(Papasaikas et al., 2015) are reported. POLR2A is shown in red.
Sequence window, phosphorylated amino acid residue, the log10 intensity of all phosphorylated sites with localization probabilities higher than 0.75 (class I), motif analysis, the GO terms, biological functions, the presence in patient-derived cells, the name of the cluster are reported. POLR2A is shown in red. References for the column “Domains for splicing?”: (a) PMID: 11121472; (b) PMID: 24795046; (c) PMID: 12105215; (d) PMID: 9671816; (e) PMID: 10827081.
References
- Aebersold R., Mann M. Mass-spectrometric exploration of proteome structure and function. Nature. 2016;537:347–355. doi: 10.1038/nature19949. [DOI] [PubMed] [Google Scholar]
- Asghar U., Witkiewicz A.K., Turner N.C., Knudsen E.S. The history and future of targeting cyclin-dependent kinases in cancer therapy. Nat. Rev. Drug Discov. 2015;14:130–146. doi: 10.1038/nrd4504. [DOI] [PMC free article] [PubMed] [Google Scholar]
- Batth T.S., Olsen J.V. Offline high pH reversed-phase peptide fractionation for deep phosphoproteome coverage. Methods Mol. Biol. 2016;1355:179–192. doi: 10.1007/978-1-4939-3049-4_12. [DOI] [PubMed] [Google Scholar]
- Beck M., Claassen M., Aebersold R. Comprehensive proteomics. Curr. Opin. Biotechnol. 2011;22:3–8. doi: 10.1016/j.copbio.2010.09.002. [DOI] [PubMed] [Google Scholar]
- Bowtell D.D., Böhm S., Ahmed A.A., Aspuria P.J., Bast R.C., Jr., Beral V., Berek J.S., Birrer M.J., Blagden S., Bookman M.A. Rethinking ovarian cancer II: reducing mortality from high-grade serous ovarian cancer. Nat. Rev. Cancer. 2015;15:668–679. doi: 10.1038/nrc4019. [DOI] [PMC free article] [PubMed] [Google Scholar]
- Cancer Genome Atlas Research Network Integrated genomic analyses of ovarian carcinoma. Nature. 2011;474:609–615. doi: 10.1038/nature10166. [DOI] [PMC free article] [PubMed] [Google Scholar]
- Cao K., Shilatifard A. Inhibit globally, act locally: CDK7 inhibitors in cancer therapy. Cancer Cell. 2014;26:158–159. doi: 10.1016/j.ccr.2014.07.020. [DOI] [PubMed] [Google Scholar]
- Cathomas F., Stegen M., Sigrist H., Schmid L., Seifritz E., Gassmann M., Bettler B., Pryce C.R. Altered emotionality and neuronal excitability in mice lacking KCTD12, an auxiliary subunit of GABAB receptors associated with mood disorders. Transl. Psychiatry. 2015;5:e510. doi: 10.1038/tp.2015.8. [DOI] [PMC free article] [PubMed] [Google Scholar]
- Christensen C.L., Kwiatkowski N., Abraham B.J., Carretero J., Al-Shahrour F., Zhang T., Chipumuro E., Herter-Sprie G.S., Akbay E.A., Altabef A. Targeting transcriptional addictions in small cell lung cancer with a covalent CDK7 inhibitor. Cancer Cell. 2014;26:909–922. doi: 10.1016/j.ccell.2014.10.019. [DOI] [PMC free article] [PubMed] [Google Scholar]
- Cox J., Mann M. MaxQuant enables high peptide identification rates, individualized p.p.b.-range mass accuracies and proteome-wide protein quantification. Nat. Biotechnol. 2008;26:1367–1372. doi: 10.1038/nbt.1511. [DOI] [PubMed] [Google Scholar]
- Cox J., Neuhauser N., Michalski A., Scheltema R.A., Olsen J.V., Mann M. Andromeda: a peptide search engine integrated into the MaxQuant environment. J. Proteome Res. 2011;10:1794–1805. doi: 10.1021/pr101065j. [DOI] [PubMed] [Google Scholar]
- Dias M.H., Kitano E.S., Zelanis A., Iwai L.K. Proteomics and drug discovery in cancer. Drug Discov. Today. 2015;21:264–277. doi: 10.1016/j.drudis.2015.10.004. [DOI] [PubMed] [Google Scholar]
- Domcke S., Sinha R., Levine D.A., Sander C., Schultz N. Evaluating cell lines as tumour models by comparison of genomic profiles. Nat. Commun. 2013;4:2126. doi: 10.1038/ncomms3126. [DOI] [PMC free article] [PubMed] [Google Scholar]
- Du H., Vitiello D., Sarno J.L., Taylor H.S. 3-Phosphoglycerate dehydrogenase expression is regulated by HOXA10 in murine endometrium and human endometrial cells. Reproduction. 2010;139:237–245. doi: 10.1530/REP-08-0376. [DOI] [PMC free article] [PubMed] [Google Scholar]
- Duncia J.V., Santella J.B., 3rd, Higley C.A., Pitts W.J., Wityak J., Frietze W.E., Rankin F.W., Sun J.H., Earl R.A., Tabaka A.C. MEK inhibitors: the chemistry and biological activity of U0126, its analogs, and cyclization products. Bioorg. Med. Chem. Lett. 1998;8:2839–2844. doi: 10.1016/s0960-894x(98)00522-8. [DOI] [PubMed] [Google Scholar]
- Elschenbroich S., Ignatchenko V., Clarke B., Kalloger S.E., Boutros P.C., Gramolini A.O., Shaw P., Jurisica I., Kislinger T. In-depth proteomics of ovarian cancer ascites: combining shotgun proteomics and selected reaction monitoring mass spectrometry. J. Proteome Res. 2011;10:2286–2299. doi: 10.1021/pr1011087. [DOI] [PubMed] [Google Scholar]
- Fisher R.P. Secrets of a double agent: CDK7 in cell-cycle control and transcription. J. Cell Sci. 2005;118:5171–5180. doi: 10.1242/jcs.02718. [DOI] [PubMed] [Google Scholar]
- Francavilla C., Rigbolt K.T., Emdal K.B., Carraro G., Vernet E., Bekker-Jensen D.B., Streicher W., Wikström M., Sundström M., Bellusci S. Functional proteomics defines the molecular switch underlying FGF receptor trafficking and cellular outputs. Mol. Cell. 2013;51:707–722. doi: 10.1016/j.molcel.2013.08.002. [DOI] [PubMed] [Google Scholar]
- Geiger T., Madden S.F., Gallagher W.M., Cox J., Mann M. Proteomic portrait of human breast cancer progression identifies novel prognostic markers. Cancer Res. 2012;72:2428–2439. doi: 10.1158/0008-5472.CAN-11-3711. [DOI] [PubMed] [Google Scholar]
- Gonda T.J., Ramsay R.G. Directly targeting transcriptional dysregulation in cancer. Nat. Rev. Cancer. 2015;15:686–694. doi: 10.1038/nrc4018. [DOI] [PubMed] [Google Scholar]
- Guo T., Kouvonen P., Koh C.C., Gillet L.C., Wolski W.E., Röst H.L., Rosenberger G., Collins B.C., Blum L.C., Gillessen S. Rapid mass spectrometric conversion of tissue biopsy samples into permanent quantitative digital proteome maps. Nat. Med. 2015;21:407–413. doi: 10.1038/nm.3807. [DOI] [PMC free article] [PubMed] [Google Scholar]
- Gurung A., Hung T., Morin J., Gilks C.B. Molecular abnormalities in ovarian carcinoma: clinical, morphological and therapeutic correlates. Histopathology. 2013;62:59–70. doi: 10.1111/his.12033. [DOI] [PubMed] [Google Scholar]
- Jersie-Christensen R.R., Sultan A., Olsen J.V. Simple and reproducible sample preparation for single-shot phosphoproteomics with high sensitivity. Methods Mol. Biol. 2016;1355:251–260. doi: 10.1007/978-1-4939-3049-4_17. [DOI] [PubMed] [Google Scholar]
- Jones P.M., Drapkin R. Modeling high-grade serous carcinoma: how converging insights into pathogenesis and genetics are driving better experimental platforms. Front. Oncol. 2013;3:217. doi: 10.3389/fonc.2013.00217. [DOI] [PMC free article] [PubMed] [Google Scholar]
- Kelstrup C.D., Young C., Lavallee R., Nielsen M.L., Olsen J.V. Optimized fast and sensitive acquisition methods for shotgun proteomics on a quadrupole orbitrap mass spectrometer. J. Proteome Res. 2012;11:3487–3497. doi: 10.1021/pr3000249. [DOI] [PubMed] [Google Scholar]
- Kim H., Wu R., Cho K.R., Thomas D.G., Gossner G., Liu J.R., Giordano T.J., Shedden K.A., Misek D.E., Lubman D.M. Comparative proteomic analysis of low stage and high stage endometrioid ovarian adenocarcinomas. Proteomics Clin. Appl. 2008;2:571–584. doi: 10.1002/prca.200780004. [DOI] [PMC free article] [PubMed] [Google Scholar]
- Kim M.S., Pinto S.M., Getnet D., Nirujogi R.S., Manda S.S., Chaerkady R., Madugundu A.K., Kelkar D.S., Isserlin R., Jain S. A draft map of the human proteome. Nature. 2014;509:575–581. doi: 10.1038/nature13302. [DOI] [PMC free article] [PubMed] [Google Scholar]
- Kobuke K., Furukawa Y., Sugai M., Tanigaki K., Ohashi N., Matsumori A., Sasayama S., Honjo T., Tashiro K. ESDN, a novel neuropilin-like membrane protein cloned from vascular cells with the longest secretory signal sequence among eukaryotes, is up-regulated after vascular injury. J. Biol. Chem. 2001;276:34105–34114. doi: 10.1074/jbc.M105293200. [DOI] [PubMed] [Google Scholar]
- Kulak N.A., Pichler G., Paron I., Nagaraj N., Mann M. Minimal, encapsulated proteomic-sample processing applied to copy-number estimation in eukaryotic cells. Nat. Methods. 2014;11:319–324. doi: 10.1038/nmeth.2834. [DOI] [PubMed] [Google Scholar]
- Kurman R.J., Shih IeM. The dualistic model of ovarian carcinogenesis: revisited, revised, and expanded. Am. J. Pathol. 2016;186:733–747. doi: 10.1016/j.ajpath.2015.11.011. [DOI] [PMC free article] [PubMed] [Google Scholar]
- Kwiatkowski N., Zhang T., Rahl P.B., Abraham B.J., Reddy J., Ficarro S.B., Dastur A., Amzallag A., Ramaswamy S., Tesar B. Targeting transcription regulation in cancer with a covalent CDK7 inhibitor. Nature. 2014;511:616–620. doi: 10.1038/nature13393. [DOI] [PMC free article] [PubMed] [Google Scholar]
- Lee J.M., Kohn E.C. Proteomics as a guiding tool for more effective personalized therapy. Ann. Oncol. 2010;21(Suppl 7):vii205–vii210. doi: 10.1093/annonc/mdq375. [DOI] [PMC free article] [PubMed] [Google Scholar]
- Levanon K., Ng V., Piao H.Y., Zhang Y., Chang M.C., Roh M.H., Kindelberger D.W., Hirsch M.S., Crum C.P., Marto J.A., Drapkin R. Primary ex vivo cultures of human fallopian tube epithelium as a model for serous ovarian carcinogenesis. Oncogene. 2010;29:1103–1113. doi: 10.1038/onc.2009.402. [DOI] [PMC free article] [PubMed] [Google Scholar]
- Liu Y., Zhang X., Han C., Wan G., Huang X., Ivan C., Jiang D., Rodriguez-Aguayo C., Lopez-Berestein G., Rao P.H. TP53 loss creates therapeutic vulnerability in colorectal cancer. Nature. 2015;520:697–701. doi: 10.1038/nature14418. [DOI] [PMC free article] [PubMed] [Google Scholar]
- Lundby A., Andersen M.N., Steffensen A.B., Horn H., Kelstrup C.D., Francavilla C., Jensen L.J., Schmitt N., Thomsen M.B., Olsen J.V. In vivo phosphoproteomics analysis reveals the cardiac targets of β-adrenergic receptor signaling. Sci. Signal. 2013;6:rs11. doi: 10.1126/scisignal.2003506. [DOI] [PubMed] [Google Scholar]
- Luo J. Cancer’s sweet tooth for serine. Breast Cancer Res. 2011;13:317. doi: 10.1186/bcr2932. [DOI] [PMC free article] [PubMed] [Google Scholar]
- Mertins P., Mani D.R., Ruggles K.V., Gillette M.A., Clauser K.R., Wang P., Wang X., Qiao J.W., Cao S., Petralia F., NCI CPTAC Proteogenomics connects somatic mutations to signalling in breast cancer. Nature. 2016;534:55–62. doi: 10.1038/nature18003. [DOI] [PMC free article] [PubMed] [Google Scholar]
- Mitchell C.J., Getnet D., Kim M.S., Manda S.S., Kumar P., Huang T.C., Pinto S.M., Nirujogi R.S., Iwasaki M., Shaw P.G. A multi-omic analysis of human naïve CD4+ T cells. BMC Syst. Biol. 2015;9:75. doi: 10.1186/s12918-015-0225-4. [DOI] [PMC free article] [PubMed] [Google Scholar]
- Muñoz M.J., de la Mata M., Kornblihtt A.R. The carboxy terminal domain of RNA polymerase II and alternative splicing. Trends Biochem. Sci. 2010;35:497–504. doi: 10.1016/j.tibs.2010.03.010. [DOI] [PubMed] [Google Scholar]
- Neunteufel W., Breitenecker G. Tissue expression of CA 125 in benign and malignant lesions of ovary and fallopian tube: a comparison with CA 19-9 and CEA. Gynecol. Oncol. 1989;32:297–302. doi: 10.1016/0090-8258(89)90628-8. [DOI] [PubMed] [Google Scholar]
- Nilson K.A., Guo J., Turek M.E., Brogie J.E., Delaney E., Luse D.S., Price D.H. THZ1 reveals roles for Cdk7 in co-transcriptional capping and pausing. Mol. Cell. 2015;59:576–587. doi: 10.1016/j.molcel.2015.06.032. [DOI] [PMC free article] [PubMed] [Google Scholar]
- Ntai I., LeDuc R.D., Fellers R.T., Erdmann-Gilmore P., Davies S.R., Rumsey J., Early B.P., Thomas P.M., Li S., Compton P.D. Integrated bottom-up and top-down proteomics of patient-derived breast tumor xenografts. Mol. Cell. Proteomics. 2016;15:45–56. doi: 10.1074/mcp.M114.047480. [DOI] [PMC free article] [PubMed] [Google Scholar]
- Olsen J.V., Mann M. Status of large-scale analysis of post-translational modifications by mass spectrometry. Mol. Cell. Proteomics. 2013;12:3444–3452. doi: 10.1074/mcp.O113.034181. [DOI] [PMC free article] [PubMed] [Google Scholar]
- Pacold M.E., Brimacombe K.R., Chan S.H., Rohde J.M., Lewis C.A., Swier L.J., Possemato R., Chen W.W., Sullivan L.B., Fiske B.P. A PHGDH inhibitor reveals coordination of serine synthesis and one-carbon unit fate. Nat. Chem. Biol. 2016;12:452–458. doi: 10.1038/nchembio.2070. [DOI] [PMC free article] [PubMed] [Google Scholar]
- Papasaikas P., Rao A., Huggins P., Valcarcel J., Lopez A. Reconstruction of composite regulator-target splicing networks from high-throughput transcriptome data. BMC Genomics. 2015;16(Suppl 10):S7. doi: 10.1186/1471-2164-16-S10-S7. [DOI] [PMC free article] [PubMed] [Google Scholar]
- Pozniak Y., Balint-Lahat N., Rudolph J.D., Lindskog C., Katzir R., Avivi C., Pontén F., Ruppin E., Barshack I., Geiger T. System-wide clinical proteomics of breast cancer reveals global remodeling of tissue homeostasis. Cell Syst. 2016;2:172–184. doi: 10.1016/j.cels.2016.02.001. [DOI] [PubMed] [Google Scholar]
- Ricci F., Bizzaro F., Cesca M., Guffanti F., Ganzinelli M., Decio A., Ghilardi C., Perego P., Fruscio R., Buda A. Patient-derived ovarian tumor xenografts recapitulate human clinicopathology and genetic alterations. Cancer Res. 2014;74:6980–6990. doi: 10.1158/0008-5472.CAN-14-0274. [DOI] [PubMed] [Google Scholar]
- Roskoski R., Jr. ERK1/2 MAP kinases: structure, function, and regulation. Pharmacol. Res. 2012;66:105–143. doi: 10.1016/j.phrs.2012.04.005. [DOI] [PubMed] [Google Scholar]
- Symeonides S., Gourley C. Ovarian cancer molecular stratification and tumor heterogeneity: a necessity and a challenge. Front. Oncol. 2015;5:229. doi: 10.3389/fonc.2015.00229. [DOI] [PMC free article] [PubMed] [Google Scholar]
- Tazi J., Bakkour N., Stamm S. Alternative splicing and disease. Biochim. Biophys. Acta. 2009;1792:14–26. doi: 10.1016/j.bbadis.2008.09.017. [DOI] [PMC free article] [PubMed] [Google Scholar]
- van den Biggelaar M., Hernández-Fernaud J.R., van den Eshof B.L., Neilson L.J., Meijer A.B., Mertens K., Zanivan S. Quantitative phosphoproteomics unveils temporal dynamics of thrombin signaling in human endothelial cells. Blood. 2014;123:e22–e36. doi: 10.1182/blood-2013-12-546036. [DOI] [PMC free article] [PubMed] [Google Scholar]
- Vizcaino J.A., Reisinger F., Cote R., Martens L. PRIDE: data submission and analysis. Curr. Protoc. Protein Sci. 2010;Chapter 25 doi: 10.1002/0471140864.ps2504s60. Unit 25.4. [DOI] [PubMed] [Google Scholar]
- von Stechow L., Francavilla C., Olsen J.V. Recent findings and technological advances in phosphoproteomics for cells and tissues. Expert Rev. Proteomics. 2015;12:469–487. doi: 10.1586/14789450.2015.1078730. [DOI] [PMC free article] [PubMed] [Google Scholar]
- Waldemarson S., Krogh M., Alaiya A., Kirik U., Schedvins K., Auer G., Hansson K.M., Ossola R., Aebersold R., Lee H. Protein expression changes in ovarian cancer during the transition from benign to malignant. J. Proteome Res. 2012;11:2876–2889. doi: 10.1021/pr201258q. [DOI] [PubMed] [Google Scholar]
- Wang Y., Zhang T., Kwiatkowski N., Abraham B.J., Lee T.I., Xie S., Yuzugullu H., Von T., Li H., Lin Z. CDK7-dependent transcriptional addiction in triple-negative breast cancer. Cell. 2015;163:174–186. doi: 10.1016/j.cell.2015.08.063. [DOI] [PMC free article] [PubMed] [Google Scholar]
- Wettenhall J.M., Smyth G.K. limmaGUI: a graphical user interface for linear modeling of microarray data. Bioinformatics. 2004;20:3705–3706. doi: 10.1093/bioinformatics/bth449. [DOI] [PubMed] [Google Scholar]
- Wilhelm M., Schlegl J., Hahne H., Gholami A.M., Lieberenz M., Savitski M.M., Ziegler E., Butzmann L., Gessulat S., Marx H. Mass-spectrometry-based draft of the human proteome. Nature. 2014;509:582–587. doi: 10.1038/nature13319. [DOI] [PubMed] [Google Scholar]
- Zecchini S., Bianchi M., Colombo N., Fasani R., Goisis G., Casadio C., Viale G., Liu J., Herlyn M., Godwin A.K. The differential role of L1 in ovarian carcinoma and normal ovarian surface epithelium. Cancer Res. 2008;68:1110–1118. doi: 10.1158/0008-5472.CAN-07-2897. [DOI] [PubMed] [Google Scholar]
- Zhang H., Liu T., Zhang Z., Payne S.H., Zhang B., McDermott J.E., Zhou J.Y., Petyuk V.A., Chen L., Ray D., CPTAC Investigators Integrated proteogenomic characterization of human high-grade serous ovarian cancer. Cell. 2016;166:755–765. doi: 10.1016/j.cell.2016.05.069. [DOI] [PMC free article] [PubMed] [Google Scholar]
Associated Data
This section collects any data citations, data availability statements, or supplementary materials included in this article.
Supplementary Materials
N: arbitrary and sequential numbers. Samples 1, 2, and 4 have been separated in two technical replicates. Sample: samples derived from normal FTE (FTE), normal ovarian surface epithelium (OSE) or from ascites of patients with high grade serous ovarian cancer (EOC). Samples 42 and 43 are two independent samples of recurrent high-grade serous ovarian carcinoma from patients who had been previously treated with primary debulking surgery followed by carboplatin/paclitaxel chemotherapy. Diagnosis: diagnosis of the patient the sample derived from. Technique: MS analysis, WB, IHC, IF indicate whether the sample has been used for the proteomic, western blot, immunohistochemical, imaging analysis, respectively. In case of IHC we did not use patient-derived epithelial cells but part of the entire biopsy. Please, note that we have used different sample set for different analysis depending on the amount of cells or proteins available from each primary culture. Note: additional information on a particular sample.
Of the 5561 identified proteins we filtered proteins identified with less than two peptides and with poor sequence coverage (less than 5%) before further analysis (4457 proteins). MUC16/CA125 and PRSS8 are identified by an asterisk. Proteins in red were differentially expressed in the three tissues based on intensity. The log10 intensity is reported for all the samples as well as the normalized mean. We also reported the significant p value after the analysis with the LIMMA Bioconductor package in R and the cluster.
Sequence window, phosphorylated amino acid residue, the log10 intensity of all phosphorylated sites with localization probabilities higher than 0.75 (class I), the normalized mean, the GO terms, the significant p value after the analysis with the LIMMA Bioconductor package in R, the significance in the PCA analysis or after the comparison with Lawrence et al. (2014) are reported for all the samples. CDK7 is shown in red.
Sequence window, phosphorylated amino acid residue, the cluster letter, the p value after the analysis with the LIMMA Bioconductor package in R are reported for all the samples. P-values < 0.05 and p-values >=0.05 are color-coded in shades of red and of blue, respectively. The phosphorylated sites whose proteins have been also identified in the proteome dataset are marked with a YES. If the p-value remained significant also after the normalization of the intensity of the site over the intensity of its protein they were marked with a ‘+’ (175 out of 665 sites). The peptide found in proteins with splicing variants were marked with a ‘+’. CDK7 and POLR2A are shown in red. CDK7: the doubly phosphorylated peptide is reported.
Sequence window, phosphorylated amino acid residue, the biological function, the significance in the PCA analysis or after comparison with the proteome analysis, the kinase motif, the function according to(Papasaikas et al., 2015) are reported. POLR2A is shown in red.
Sequence window, phosphorylated amino acid residue, the log10 intensity of all phosphorylated sites with localization probabilities higher than 0.75 (class I), motif analysis, the GO terms, biological functions, the presence in patient-derived cells, the name of the cluster are reported. POLR2A is shown in red. References for the column “Domains for splicing?”: (a) PMID: 11121472; (b) PMID: 24795046; (c) PMID: 12105215; (d) PMID: 9671816; (e) PMID: 10827081.