

Summary
Several previous studies outlined the importance of the histone H2A deubiquitinase MYSM1 in the regulation of stem cell quiescence and haematopoiesis. In this study we investigated the role of MYSM1 in T‐cell development. Using mouse models that allow conditional Mysm1 ablation at late stages of thymic development, we found that MYSM1 is intricately involved in the maintenance, activation and survival of CD8+ T cells. Mysm1 ablation resulted in a twofold reduction in CD8+ T‐cell numbers, and also led to a hyperactivated CD8+ T‐cell state accompanied by impaired proliferation and increased pro‐inflammatory cytokine production after ex vivo stimulation. These phenotypes coincided with an increased apoptosis and preferential up‐regulation of p53 tumour suppressor protein in CD8+ T cells. Lastly, we examined a model of experimental cerebral malaria, in which pathology is critically dependent on CD8+ T cells. In the mice conditionally deleted for Mysm1 in the T‐cell compartment, CD8+ T‐cell numbers remained reduced following infection, both in the periphery and in the brain, and the mice displayed improved survival after parasite challenge. Collectively, our data identify MYSM1 as a novel factor for CD8+ T cells in the immune system, increasing our understanding of the role of histone H2A deubiquitinases in cytotoxic T‐cell biology.
Keywords: cytotoxic T cells, experimental cerebral malaria, T lymphocytes
Abbreviations
- APC
allophycocyanin
- ECM
experimental cerebral malaria
- IFN‐γ
interferon‐γ
- PE
phycoerythrin
- TCR
T‐cell receptor
- TNF‐α
tumour necrosis factor‐α
Introduction
The constant production of adaptive immune cells is a prerequisite for the body's ability to fend off invading pathogens. Disruptions of these processes may have deleterious consequences for the host, resulting in immunodeficiency syndromes or leukaemia. The role of histone H2A monoubiquitination in the regulation of chromatin condensation during stem cell differentiation and haematopoiesis has recently been appreciated.1, 2, 3 In mammalian cells approximately 10% of all cellular histone H2A is monoubiquitinated at lysine residue 119,4 with the Ring1b subunit of polycomb repressive complex 1 acting as the main histone H2A ubiquitin ligase.5 This has been shown to mediate gene silencing during development, altering the balance between heterochromatin and euchromatin, and may also play a role in the DNA damage response.6
Recent work demonstrated that deficiency in the histone H2A deubiquitinase MYSM1 results in a severe defect in the development of immune cells in mice and humans, outlining evolutionarily conserved mechanisms governing haematopoiesis in both species.7, 8, 9, 10 In conjunction with these haematopoietic aberrations, several developmental phenotypes like growth retardation, developmental delay, decreased reproductive fitness and morphological alterations were ascribed to Mysm1 deficiency in the murine system.7, 11, 12 MYSM1 is a chromatin‐binding protein with deubiquitinase catalytic activity that has been shown to mediate the deubiquitination of lysine 119 of histone H2A.13 Other histone H2A deubiquitinases such as USP16, USP21 and USP22 are known to influence B‐cell and T‐cell lymphopoiesis or lymphocyte activation.14, 15, 16, 17 The work of our and several other groups indicated that MYSM1 regulates the maintenance of haematopoietic stem cells and their differentiation into B cells, natural killer cells, dendritic cells and erythrocytes.7, 12, 18, 19 In this setting, MYSM1 exerts its role by controlling essential lineage‐specific developmental regulators like Ebf1, Gfi1, Id2 and Flt3 at a transcriptional level.9, 12, 18, 19 Accompanying evidence indicates that MYSM1 also regulates the p53 stress response pathway, illustrated by p53 activation in the haematopoietic system of Mysm1‐knockout mice.7, 20 Interestingly, deficiency in the p53 gene can rescue the haematological alterations associated with the knockout of Mysm1;20, 21 however, the molecular mechanisms underlying the cross‐talk between MYSM1 and p53 remain poorly understood.
Recent data identified MYSM1 as an essential regulator of early T‐cell development in the thymus, with Mysm1‐knockout mice showing a severe reduction in the numbers of thymic seeding progenitors and a block at the double‐negative DN1–DN2 stage of T‐cell development.21, 22 However, little is known about the roles of MYSM1 in the maintenance and function of T lymphocytes beyond early thymic development. To address this question, we used a series of conditional knockout mouse models allowing ablation of Mysm1 in a T‐cell‐specific manner from either DN3 (LCK‐Cre) or double‐positive stage (CD4‐Cre) of T‐cell development. We found no alterations in the thymus, arguing for a limited role of MYSM1 in positive or negative selection of T cells. In contrast, the conditional T‐cell‐specific ablation of MYSM1 led to a reduction of peripheral CD8+ T‐lymphocyte numbers. Furthermore, we observed altered cellular activation, proliferation, cytokine production and apoptosis of CD8+ T cells in an in vitro cell culture system. These phenotypes were associated with a selective up‐regulation of p53 in CD8+, but not in CD4+ T cells. Lastly, we found increased resistance of CD4‐Cre Mysm1 fl/fl mice in a model of experimental cerebral malaria (ECM), in which pathology is critically dependent on pro‐inflammatory CD8+ T cells. Taken together our data identify MYSM1 as a bona fide regulator of peripheral CD8+ T‐cell maintenance and function in post‐thymic stages of T‐cell development, adding a new facet to the role of MYSM1 in the immune system.
Materials and methods
Mice
Transgenic (Tg) (LCK Cre) and Tg(CD4 Cre) mice were purchased from Jackson Laboratories (Bar Harbor, ME).23, 24 Rosa26Cre‐ERT2 mice were provided by the Wellcome Trust Sanger Institute (Cambridge, UK). The conditional mouse line Mysm1 fl/fl, also known as Mysm1 tm1c/tm1c, was derived as previously described.25 All mice were kept under a specific pathogen‐free environment. All experimental procedures were approved by local ethics committees (Animal use protocol number 6029).
Tamoxifen administration
Mice were injected intraperitoneally with tamoxifen (Sigma‐Aldrich, St Louis, MO) in sterile corn oil at 0·15 mg/gram per injection, with each mouse receiving eight doses over 16 days.
PCR for analysis of Mysm1 allele rearrangements
Successful deletion of Mysm1 exon 3 was validated by genotyping on genomic DNA extracted from the thymus, blood or ear‐clip mouse tissue with primers Mysm1_Fw CCACAGTGATTCCTGGCTG, Mysm1_Rv1 CTAGGCTTCAGGCATTTTGC and Mysm1_Rv2 CCACATGTTCTTGACCTTGC. Successful deletion of Mysm1 exon 3 and loss of Mysm1 expression through tamoxifen administration to Mysm1 fl/flTg.CreERT2 mice was previously extensively validated.25, 26
RNA isolation and quantitative PCR
RNA was isolated using RNeasy micro kit (Qiagen, Hilden, Germany), with DNase I treatment (Qiagen). The cDNA synthesis was performed using an M‐MLV reverse transcriptase kit (Life Technologies, Carlsbad, CA). Quantitative PCRs were performed on a StepOnePlus instrument with Power SYBR master mix (Applied Biosystems, Foster City, CA) with primers from IDT Technologies (Coralville, IA). Data analysis was performed using the comparative Ct method (also known as the 2−ΔΔCt method), with all data normalized to β‐actin.
Western blotting
For Western blot analysis, cells were lysed in a modified RIPA buffer supplemented with 1 mm dithiothreitol and protease inhibitors (Thermo Scientific, Waltham, MA). Protein concentration was assessed using the BCA assay (Thermo Scientific), and samples were prepared by boiling in Laemmli buffer. Blots were developed with anti‐β‐actin rabbit monoclonal antibody (8457S; Cell Signaling Technology, Danvers, MA), and anti‐MYSM1 rabbit polyclonal antibody previously described.26 Blots were quantified with image j software (https://imagej.nih.gov/ij/index.html).
Flow cytometry
Data were acquired on a FACS Canto II (Becton Dickinson, Franklin Lakes, NJ) and analysed with flowjo software (Tree Star, Ashland, OR). The antibodies used for cell‐surface staining included anti‐CD62L‐FITC (clone MEL14), anti‐CD69‐FITC (HI.2F3), anti‐CD25‐phycoerythrin (PE) (PC61.5), anti‐CD4‐Peridinin chlorophyll protein‐Cy5.5 (RM4‐5), anti‐CD44‐PE‐Cy7 (IM7), anti‐CD8‐allophycocyanin (APC) (53‐6.7), anti‐CD44‐APC (IM7), anti‐CD45‐APC‐Cy7 (30‐F11) and anti‐CD8‐eFlour 450 (53‐6.7) (from eBioscience, San Diego, CA; Tonbo Biosciences, San Diego, CA; or BioLegend, San Diego, CA). Leucocytes from the brains of infected animals were processed and prepared for flow cytometry analysis as described previously.27 Intracellular staining was carried out using a Cytofix/cytoperm kit (Becton Dickinson), with anti‐interferon‐γ (IFN‐γ)‐PE (XMG1.2), anti‐tumour necrosis factor‐α (TNF‐α)‐APC (MPG‐XT22), anti‐perforin‐PE (eBioOMAK‐D) or anti‐granzyme‐PE B (NGZB) antibodies (eBioscience). For intracellular staining for p53 protein the samples were pre‐stained with Fixable Viability Dye eFluor®506 (eBioscience), fixed in 2% paraformaldehyde in PBS with 2% fetal calf serum at 37° for 10 min, and permeabilized in 90% methanol for 30 min on ice. The cells were then stained with anti‐CD8‐APC (53‐6.7, BioLegend) and either AlexaFluor 488 anti‐p53 (1C12) (Cell Signaling Technology) or isotype control. Apoptosis was assessed using Annexin V‐PE‐Cy7 (eBioscience).
Cell culture
Single‐cell suspensions of splenocytes were plated at 2 × 10⁶ cells/ml following erythrocyte lysis, in RPMI‐1640 with 10% fetal calf serum, penicillin–streptomycin, l‐glutamate, non‐essential amino acids, sodium pyruvate and β‐mercaptoethanol. The cells were stimulated with anti‐CD3 (clone 145‐2C11) 5 μg/ml (BioLegend) and anti‐CD28 (clone 37.51) 2 μg/ml (BioLegend) or PMA 50 ng/ml (Calbiochem, Billerica, MA) and 500 ng/ml ionomycin (Calbiochem). For the analysis of cell proliferation the cells were pre‐loaded with CFSE using the CellTrace™ CFSE Cell Proliferation Kit (Life Technologies) according to the manufacturer's recommendations.
Cell isolation and irradiation experiments
CD8+ T cells were positively selected using anti‐Ly2 (CD8a) Microbeads and autoMACS pro‐separator according to the manufacturer's protocol (Miltenyi Biotec, Bergisch Gladbach, Germany). The cells were further purified by sorting on FACS Aria (Becton Dickinson). Isolated CD8+ T cells were plated as described above, and irradiated in RS2000 irradiator (Rad Source, Suwanee, GA).
Malaria infection
Plasmodium berghei (ANKA) parasite was passaged in C57BL/6 mice until peripheral blood parasitaemia reached 3–5%. Mice were then killed, exsanguinated and infectious stock was prepared. For ECM infection CD4‐Cre Mysm1 fl/fl mice and the respective littermate controls were infected intravenously with 1 × 10⁶ P. berghei‐infected erythrocytes, as described previously.28 Neurological symptoms were monitored twice per day starting at day 4 post‐infection, and affected animals were killed according to terminal end‐points outlined elsewhere.29
Statistical analysis
Statistical comparisons were performed with prism 4.0 (GraphPad Inc., San Diego, CA), using Student's t‐test for two data sets, analysis of variance with Bonferroni post‐hoc test for multiple comparisons, and Kaplan–Meier regression analysis and log‐rank test for survival data.
Results
MYSM1 controls peripheral CD8+ T‐cell maintenance
To determine the effect of Mysm1 ablation on T lymphocytes independently of the defects in early haematopoietic compartments seen in the knockout line Mysm1 −/−,7, 9 we deployed two conditional mouse models that allow deletion of Mysm1 from either the DN3 (LCK‐Cre) or the double‐positive (CD4‐Cre) stage of T‐cell development in the thymus. To ensure effective knockout of Mysm1, we confirmed efficient excision of Mysm1 exon 3 through PCR analysis of genomic DNA from mouse thymus (see Supplementary material, Fig. S1a–d), and further through quantitative PCR analysis of Mysm1 expression in the thymus and peripheral CD8+ T cells of the mice (see Supplementary material, Fig. S2a). Western blots of thymocytes further confirmed a severe depletion of MYSM1 protein in CD4‐Cre Mysm1 fl/fl relative to control samples (see Supplementary material, Fig. S2b).
We then set out to characterize the T‐cell compartment in these transgenic mouse lines. In contrast to what has been reported for the full Mysm1‐knockout line Mysm1 −/−,7, 12, 21 we did not detect any gross phenotypic changes in thymic cellularity, distribution of single‐positive, double‐positive or double‐negative populations, or thymic development in either LCK‐Cre or CD4‐Cre Mysm1 fl/fl mice (see Supplementary material, Fig. S2c,d and data not shown). There were also no significant alterations in the expression of T‐cell receptor‐β (TCR‐β), CD24, CD69, CD62L, CD3, CD44 or CD25 maturation markers on the single‐positive CD8 and CD4 T cells in the thymus of CD4‐Cre Mysm1 fl/fl relative to control mice (see Supplementary material, Fig. S2e, and data not shown), and the proportions and absolute numbers of TCR‐β hi CD24lo mature single‐positive thymocytes in CD4‐Cre Mysm1 fl/fl mice also remained normal (see Supplementary material, Fig. S2f,g). This indicated that despite the essential role of MYSM1 in lymphoid lineage specification and early double‐negative thymocyte development,7, 12, 21 it is largely dispensable at the later stages of thymocyte maturation.
When we investigated peripheral CD8+ T cells, we found a reduction by approximately 50% in frequency and absolute numbers in the spleen and mesenteric lymph nodes of both LCK‐Cre or CD4‐Cre Mysm1 fl/fl mice (Fig. 1a,c,e). In contrast, we observed no alterations of CD4+ T cells in secondary lymphoid organs of either LCK‐Cre or CD4‐Cre Mysm1 fl/fl mice compared with their cognate littermate controls (Fig. 1b,d). Overall, our data indicate the essential role for MYSM1 in the maintenance of peripheral CD8+ T cells.
Figure 1.
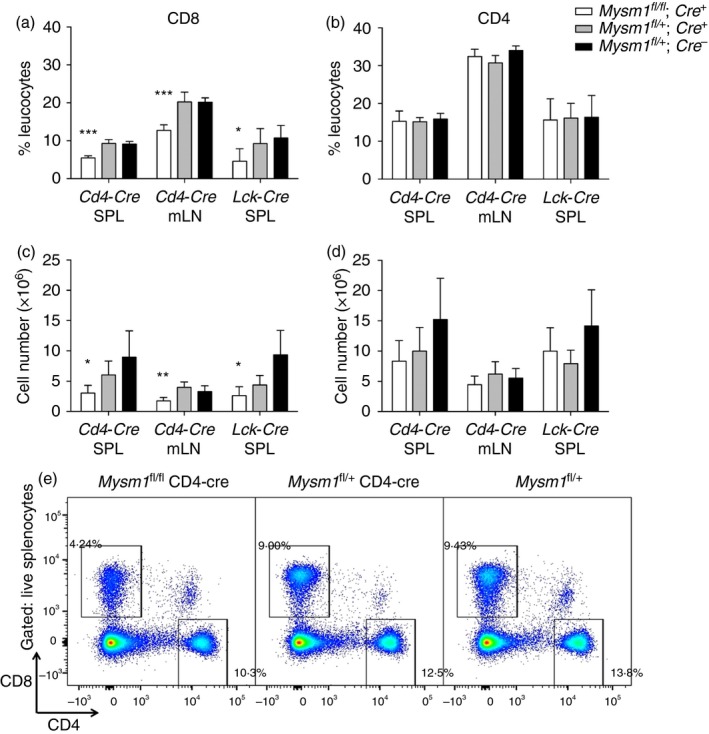
Assessment of the peripheral T‐cell compartment in Mysm1 fl/fl CD4‐Cre and Mysm1 fl/fl LCK‐Cre mice. (a, b) Frequency and (c, d) absolute counts of CD8+ and CD4+ T cells in spleen and mesenteric lymph nodes; five to seven mice of indicated genotypes were analysed per group. The figure is a representative of three identical experiments. (e) Representative flow cytometry dot‐plots of the spleen stained for CD8 and CD4 and gated on live cells; gates represent CD8+ and CD4+ T cells. The gating strategy included singlets > debris > lymphocytes > live cells > CD4/CD8 cells. All statistical analysis was performed with an unpaired Student's t‐test. All comparisons shown are between Mysm1 fl/fl Cre and Mysm1 fl/+ Cre mice. *P < 0·05, **P < 0·01, ***P < 0·001. [Colour figure can be viewed at wileyonlinelibrary.com]
To further validate this finding, we used an additional transgenic mouse model Rosa26(CreERT2) Mysm1 fl/fl, which allowed inducible systemic ablation of Mysm1 by means of tamoxifen treatment. Efficient excision of Mysm1 exon 3 in the blood of tamoxifen‐treated Rosa26(CreERT2) Mysm1 fl/fl mice was confirmed through PCR analysis of genomic DNA (see Supplementary material, Fig. S1e). The tamoxifen‐treated Rosa26(CreERT2) Mysm1 fl/fl and control mice were followed for 12 weeks assessing their blood lymphocyte populations by flow cytometry. We detected a significant reduction in the frequency and absolute numbers of CD8+, but not CD4+ T cells in circulation of these mice at 11–12 weeks after the last tamoxifen treatment (Fig. 2a–c). This indicated that a reduction in CD8+ T cells is observed earlier following systemic Mysm1 ablation compared with aberrations in CD4+ T cells, which further underscores the role of MYSM1 in the maintenance of peripheral CD8+ T‐cell numbers.
Figure 2.
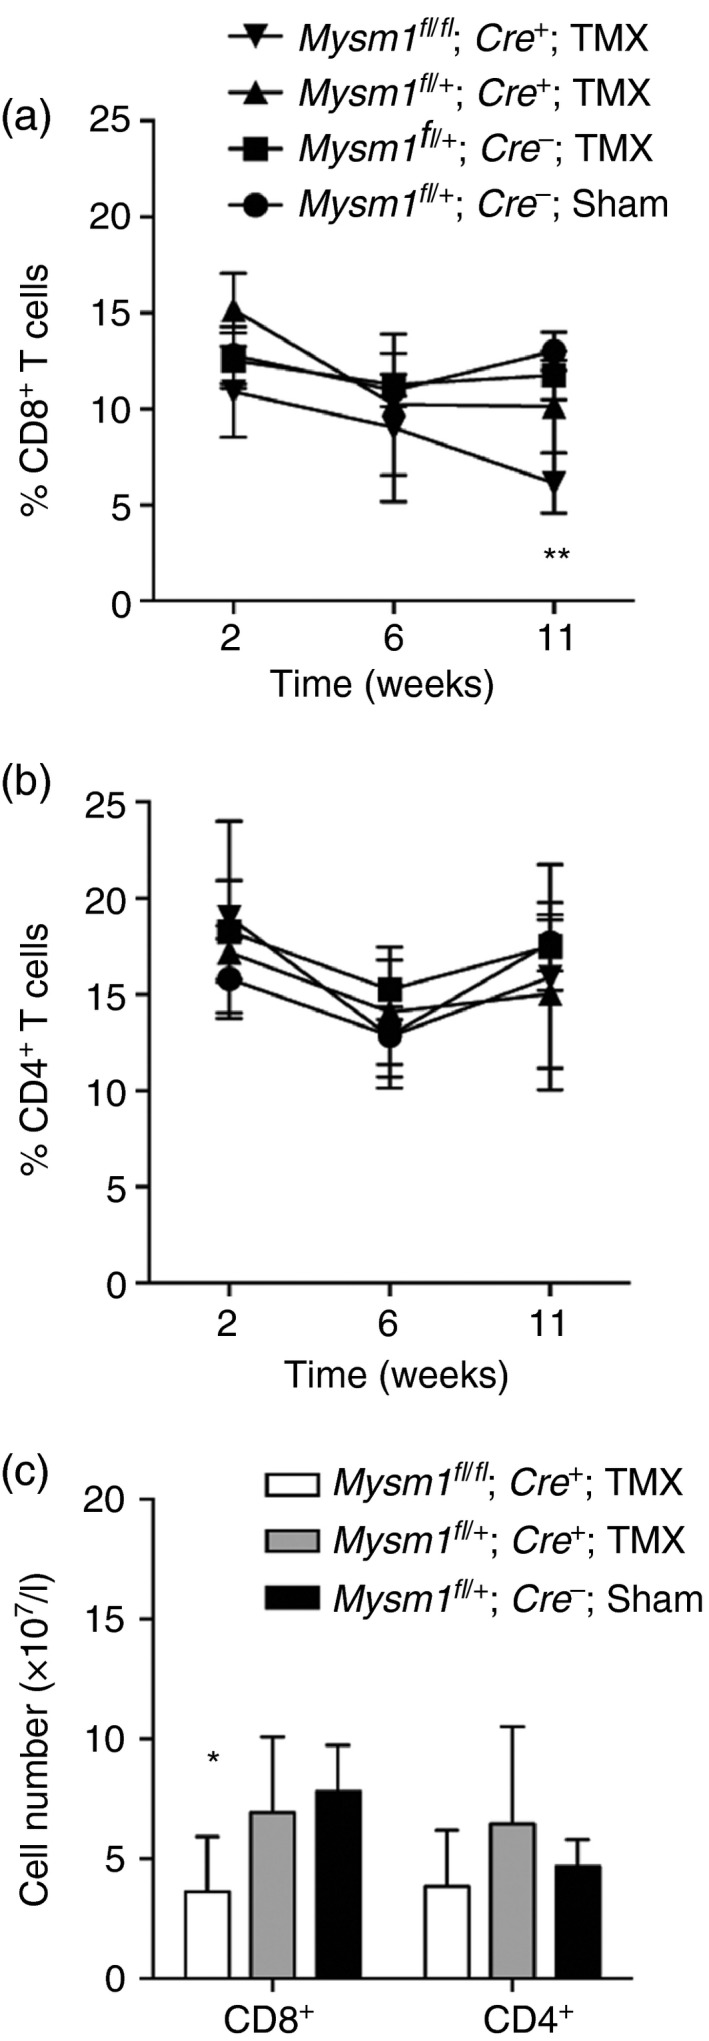
Assessment of circulating T cells in Tg.CreERT2 Mysm1 fl/fl mice following tamoxifen injection. (a, b) Kinetic study of CD8+ and CD4+ T‐cell frequency in the mouse blood at 2, 6 and 11 weeks after tamoxifen injection; three to five mice per group of the indicated genotypes were analysed. (c) Absolute numbers of CD8+ and CD4+ T cells in the blood at 12 weeks after the last tamoxifen injection. Data are representative of two experiments with similar results. The gating strategy included singlets > debris > lymphocytes > live cells > CD4/CD8 cells. All statistical analysis was performed with an unpaired Student's t‐test. All comparisons shown are between Mysm1 fl/fl Tg.CreERT2 and Mysm1 fl/+ Tg.CreERT2 mice. *P < 0·05, **P < 0·01.
MYSM1 controls cellular activation, proliferation, cytokine production and apoptosis of T cells
We characterized the effect of Mysm1 deletion on T‐cell activation under homeostatic conditions and following in vitro re‐stimulation. We observed an increase in the expression of CD44 and CD69, and a reduction in the expression of CD62L marker on Mysm1‐deficient CD8+ T cells and to a lesser extent also CD4+ T cells, demonstrating increased T‐cell activation (Fig. 3a,b). Furthemore, a higher proportion of Mysm1‐deficient CD8+ T cells in CD4‐Cre Mysm1 fl/fl spleens had a CD44hi CD62Llo memory phenotype (Fig. 3c,d). In fact the absolute numbers of CD44hi CD62Llo CD8+ memory T cells in CD4‐Cre Mysm1 fl/fl spleens were maintained at normal levels (Fig. 3c), despite the significant reduction in the overall CD8+ T‐cell numbers, further supporting MYSM1 as a negative regulator of T‐cell activation.
Figure 3.
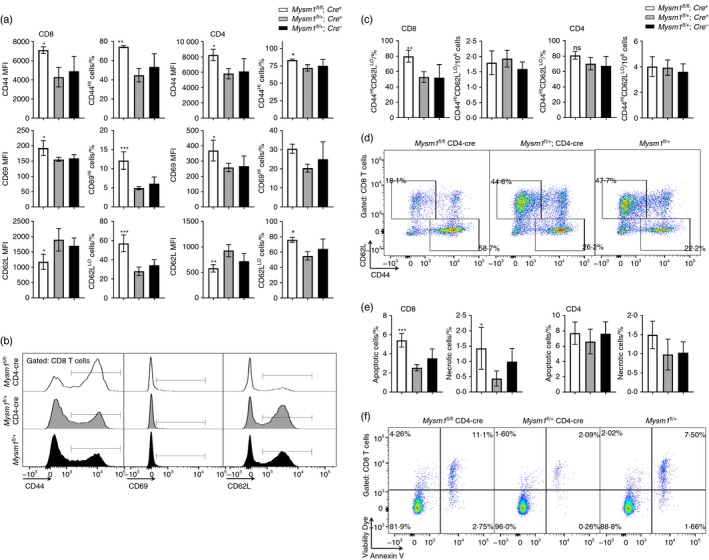
Activation and apoptosis of CD4‐Cre Mysm1 fl/fl T cells. (a) Expression of CD44, CD69 and CD62L markers on CD8+ and CD4+ T cells, presented as MFIs of the cells or as percentages of activated CD44hi, CD69hi or CD62Llo cells. (b) Representative flow cytometry histograms of CD8+ T cells showing CD44, CD69 and CD62L marker expression. (c) Frequencies and absolute numbers of CD44hi CD62Llo memory cells within CD8+ and CD4+ T‐cell populations. (d) Representative flow cytometry dot‐plots gated on CD8+ T cells and showing the expression of CD44 and CD62L markers; the gates indicate CD44lo CD62Lhi naive and CD44hi CD62Llo memory cells. (e) The percentages of apoptotic and necrotic cells within CD8+ and CD4+ T‐cell populations, measured as cells positive for Annexin V or V506 viability dye, respectively. (f) Representative flow cytometry dot‐plots gated on CD8+ T cells and showing Annexin V and V506 viability dye staining, as measures of cell apoptosis and necrosis. The gating strategy included singlets > debris > lymphocytes > live cells > CD4/CD8. White bars – CD4‐Cre Mysm1 fl/fl, grey bars – CD4‐Cre Mysm1 fl/+, and black bars – Mysm1 fl/+; MFI, mean fluorescence intensity. Figure representative of one or two experiments with three to six mice per group. All statistical analysis was performed with an unpaired Student's t‐test. All comparisons shown are between Mysm1 fl/fl CD4‐Cre and Mysm1 fl/+ CD4‐Cre mice. *P < 0·05, **P < 0·01, ***P < 0·001. [Colour figure can be viewed at wileyonlinelibrary.com]
Given the reduction in CD8+ T‐cell numbers in vivo in CD4‐Cre Mysm1 fl/fl mice (Fig. 1) and the previously reported roles of MYSM1 as a negative regulator of apoptosis in haematopoietic progenitors,7, 9, 21 we assessed the levels of apoptosis in Mysm1‐deficient and control T cells. There was a mild but statistically significant increase in the frequency of apoptotic and necrotic cells among CD8+ T cells, but not CD4+ T cells, in CD4‐Cre Mysm1 fl/fl mice (Fig. 3e,f), suggesting that increased cell death may be contributing to the depletion of Mysm1‐deficient CD8+ T cells.
We further carried out a series of in vitro cell culture experiments, using splenocytes from CD4‐Cre Mysm1 fl/fl and control mice, stimulating either with PMA and ionomycin or by direct TCR cross‐linking using anti‐CD3 and anti‐CD28 antibodies. We assessed the expression of activation markers over a 4‐day time–course and observed that Mysm1‐deficient T cells showed a significantly higher activation than their wild‐type counterparts in both CD8+ and CD4+ T‐cell compartments, as measured by expression of the late T‐cell activation marker CD44, in response to anti‐CD3 and anti‐CD28 (Fig. 4a,b), as well as PMA and ionomycin stimulation (see Supplementary material, Fig. S3a,b). However the expression of the early T‐cell activation marker CD69 was not significantly affected by the loss of Mysm1, in either CD4+ or CD8+ T cells irrespective of the stimulus used (Fig. 4c, and data not shown).
Figure 4.
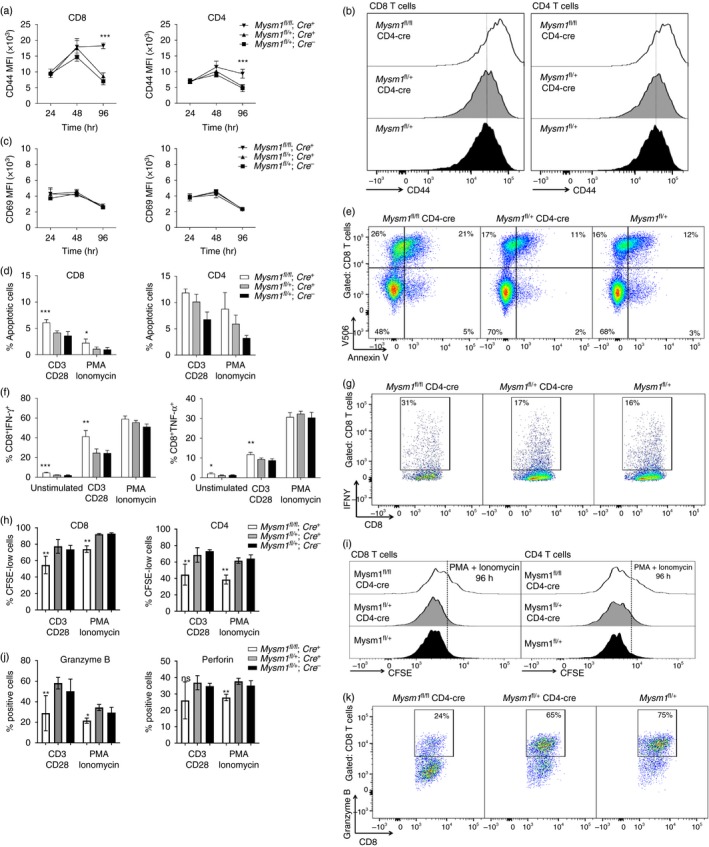
Activation, cytokine production, proliferation and apoptosis of CD4‐Cre Mysm1 fl/fl T cells following in vitro re‐stimulation. Splenocytes of five to six mice of indicated genotypes were stimulated in vitro with (a–k) agonistic anti‐CD3 and anti‐CD28 antibodies or (d, f, h–j) PMA and ionomycin. (a, b) Expression of the late T‐cell activation marker CD44 on T cells, presented as (a) MFI of the cells, or as (b) representative flow cytometry histograms of the cells at 96 hr of stimulation. (c) Expression of the early T‐cell activation marker CD69 on T cells, presented as MFI of the cells. (d, e) T‐cell death at 96 hr of in vitro stimulation, presented as (d) the percentage of apoptotic Annexin V‐positive cells within CD8+ and CD4+ T‐cell populations, or as (e) representative flow cytometry dot‐plots gated on CD8+ T cells and showing Annexin V and viability dye V506 staining, as measures of cell apoptosis and necrosis. (f, g) Cytokine production by CD8+ T cells at 24 hr of in vitro stimulation, presented as (f) the percentage of interferon‐γ (IFN‐γ) or tumour necrosis factor‐α (TNF‐α) positive CD8+ T cells, or as (g) representative flow cytometry dot‐plots gated on CD8+ T cells and showing IFN‐γ staining. (h, i) Cell proliferation, presented as (h) the percentage of CFSE‐low cells within the CD8+ and CD4+ T‐cell populations, or as (i) representative CFSE histograms of the cells at 96 hr of in vitro stimulation. (j, k) Production of perforin and granzyme B by CD8+ T cells, presented as (j) the percentage of perforin or granzyme B positive cells within the CD8+ T‐cell gate, or as (k) representative flow cytometry dot‐plots of granzyme B staining of CD8+ T cells at 24 hr of in vitro stimulation. The gating strategy included singlets > debris > lymphocytes > live cells > CD4/CD8. White bars – CD4‐Cre Mysm1 fl/fl, grey bars – CD4‐Cre Mysm1 fl/+, and black bars – Mysm1 fl/+; MFI, mean fluorescence intensity. Figure representative of two to four experiments with five to six mice per group. All statistical analysis was performed with an unpaired Student's t‐test. All comparisons shown are between Mysm1 fl/fl CD4‐Cre and Mysm1 fl/+ CD4‐Cre mice. *P < 0·05, **P < 0·01, ***P < 0·001. [Colour figure can be viewed at wileyonlinelibrary.com]
We further assessed the production of pro‐inflammatory cytokines, perforin and granzyme B, as well as T‐cell proliferation following in vitro stimulation. We demonstrated that Mysm1‐deficient CD8+ T cells have increased frequencies of IFN‐γ‐ and TNF‐α‐producing cells compared with their control counterparts after agonistic antibody treatment (Fig. 4f,g, and data not shown). We found a similar increase in the frequency of IFN‐γ‐producing cells albeit to a lower degree in Mysm1‐deficient CD4+ T cells (see Supplementary material, Fig. S4). Furthermore, we observed that Mysm1‐deficient CD8+ and CD4+ T cells had reduced proliferation in response to stimulation (Fig. 4h,I, and see Supplementary material, Fig. S5), and CD8+ T cells also showed reduced production of perforin and granzyme B (Fig. 4j,k and see Supplementary material, Fig. S6). Overall this indicates that MYSM1 is an important regulator of CD8+ T‐cell, and to a lesser extent CD4+ T‐cell, activation, proliferation and possibly also cytotoxic activity.
We further assessed apoptosis in T cells that have been stimulated for 96 hr with either agonistic antibodies or PMA and ionomycin. We found increased apoptosis assessed by Annexin V staining exclusively in Mysm1‐deficient CD8+ T cells, but not CD4+ T cells, compared with their control counterparts (Fig. 4d,e). This phenotype may indicate a connection between T‐cell activation and their propensity to undergo programmed cell death, underscoring the notion that MYSM1 is involved in CD8+ T‐cell maintenance.
MYSM1 controls radio‐resistance and p53 activation in CD8+ T cells
To identify a possible mechanism promoting CD8+ T‐cell apoptosis in Mysm1‐deficiency, we turned our attention towards the role of p53 activation. We and others have shown that deficiency in Mysm1 leads to activation of p53 in haematopoietic progenitors,7, 20 and that a deficiency in p53 completely rescues haematopoietic phenotypes of the Mysm1 −/− knockout mouse, including the defects in lymphopoiesis.20, 21 To this end we investigated the role of p53 activation in T lymphocytes under homeostatic conditions and following irradiation. A mild but statistically significant increase in p53 protein levels was observed in untreated Mysm1‐deficient CD8+ but not CD4+ T cells (Fig. 5a). The up‐regulation of p53 protein was not associated with significant changes in p53 transcript levels (see Supplementary material, Fig. S7), suggesting that it is mediated through post‐translational mechanisms, as also reported in our recent work with Mysm1 −/− haematopoietic progenitors.20, 26
Figure 5.
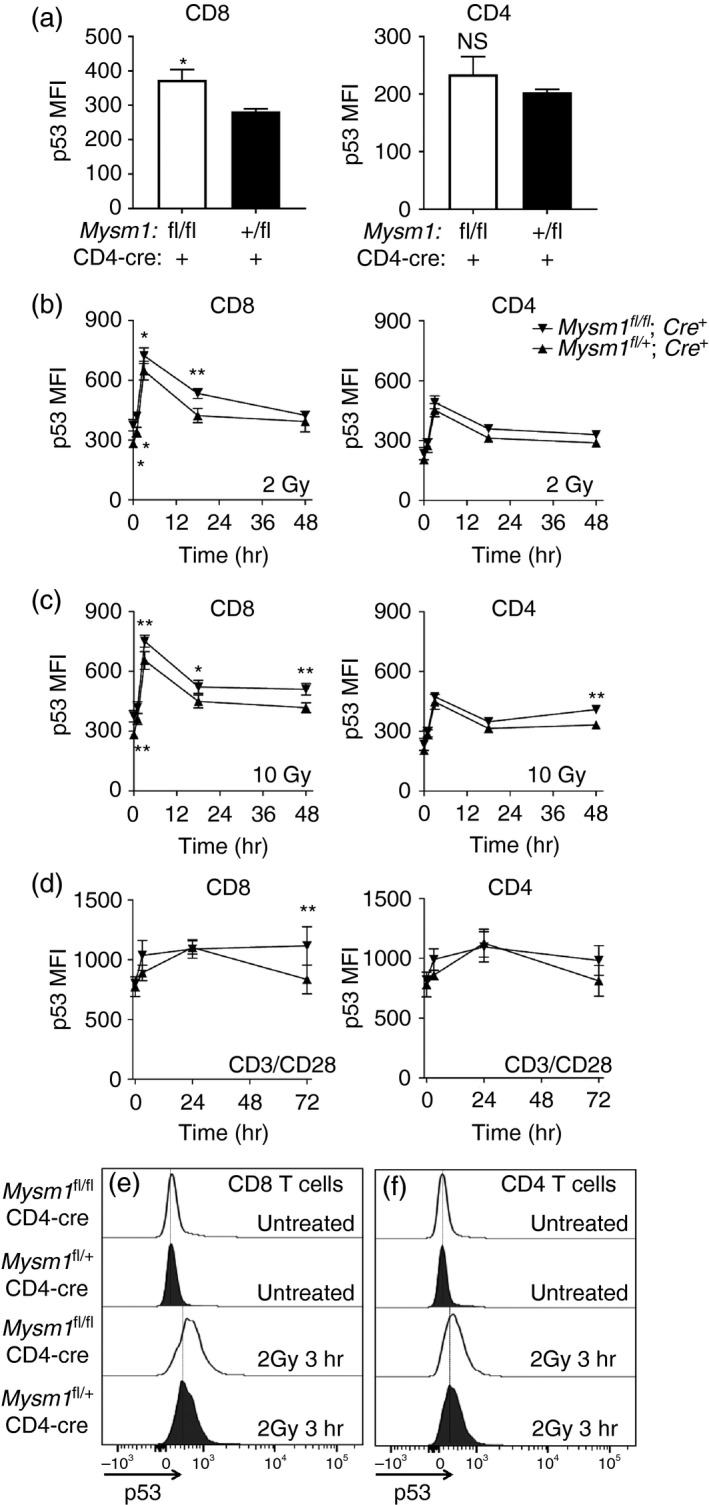
Up‐regulation of p53 protein levels in CD8+ and CD4+ T cells from CD4‐Cre Mysm1 fl/fl mice following irradiation and in vitro TCR stimulation, analysed by flow cytometry. (a) p53 protein levels in untreated CD8+ and CD4+ T cells. (b) p53 protein levels in CD8+ and CD4+ T cells at 1, 3, 16 and 48 hr after treatment with 2 Gy of ionizing radiation. (c) p53 protein levels in CD8+ and CD4+ T cells at 1, 3, 16 and 48 hr after treatment with 10 Gy of ionizing radiation. (d) p53 protein levels in CD8+ and CD4+ T cells stimulated for 1, 3, 16 and 72 hr with anti‐CD3 and anti‐CD28 antibodies. (e, f) Representative histograms of CD8+ and CD4+ T cells stained for p53, either untreated or at the 3 hr time‐point following 2‐Gy irradiation. The gating strategy included singlets > debris > lymphocytes > live cells > CD4/CD8. All statistical analysis was performed with an unpaired Student's t‐test. All comparisons shown are between Mysm1 fl/fl CD4‐Cre and Mysm1 fl/+ CD4‐Cre mice. Data are representative of three independent experiments, with three to five mice analysed per genotype per experiment; *P < 0·05, **P < 0·01.
We further found that conditional Mysm1 deletion in T cells renders CD8+ T cells more sensitive to ex vivo irradiation. Thereby, Mysm1‐deficient CD8+ T cells of CD4‐Cre Mysm1 fl/fl mice showed stronger up‐regulation of p53 protein compared with their control counterparts following either 2 Gy or 10 Gy irradiation (Fig. 5b,c,e). The same effect was observed albeit to a lesser extent in Mysm1‐deficient CD4+ T cells but only with the 10‐Gy irradiation dose (Fig. 5c,f).
Recently, there has been an increased appreciation for the role of p53 as a regulator of T‐cell activation and clonal expansion elicited by TCR, CD28 and/or interleukin‐2 stimulation.30, 31 We investigated this notion in our system by stimulating CD4‐Cre Mysm1 fl/fl splenocytes with agonistic antibodies directed against CD3 and CD28 and assessing p53 protein levels in CD8+ and CD4+ T cells. We found that after 72 hr of stimulation Mysm1‐deficient CD8+ T cells showed a significantly stronger up‐regulation of p53 protein compared with control Cre‐expressing T cells (Fig. 5d). Conversely, this phenotype was not observed in CD4+ T cells stimulated under the same conditions (Fig. 5d), arguing for a predominant role for MYSM1 in the maintenance of CD8+ T cells following TCR stimulation via p53‐dependent mechanisms.
MYSM1 controls ECM
To further test the functional role of MYSM1 in CD8+ T‐cell maintenance in the periphery, we infected CD4‐Cre Mysm1 fl/fl mice and the respective control animals with P. berghei, a pathogen that elicits a disease similar to cerebral malaria in humans. It is well known that cytotoxic CD8+ T cells play an important role in the onset of ECM, as CD8+ T‐cell ablation can protect mice from pathology.32, 33 Following the infectious challenge, we observed a significantly improved survival of CD4‐Cre Mysm1 fl/fl animals compared with control CD4‐Cre‐expressing counterparts (Fig. 6a). We further examined the levels of circulating CD4+ and CD8+ T lymphocytes in the blood and spleen of the mice 5 days after infection and before the development of any neurological symptoms. In line with our observations in naive mice, we detected a reduction of circulating CD8+ T cells by approximately 50% in Mysm1‐conditionally deleted CD4‐Cre Mysm1 fl/fl mice (Fig. 6b‐d), strengthening the notion that MYSM1 is involved in the maintenance of these cells not only under homeostatic conditions, but also during infection. We then re‐stimulated the splenocytes of infected mice with PMA and ionomycin or monoclonal antibodies directed against CD3 and CD28 and investigated the production of pro‐inflammatory cytokines IFN‐γ and TNF‐α, which are known to be pathogenic in ECM.34 Although, there was a minimal statistically significant up‐regulation of IFN‐γ and TNF‐α in un‐stimulated Mysm1‐deficient CD8+ T cells from CD4‐Cre Mysm1 fl/fl mice, we detected no changes in cytokine‐producing CD8+ T cells following re‐stimulation, suggesting that this T‐cell function remains unaltered in the context of ECM (Fig. 6e,f). Importantly we observed a significant reduction in both frequency and absolute numbers of CD8+ T cells, but not CD4+ T cells in the brain of CD4‐Cre Mysm1 fl/fl mice relative to control mice at day 6 of ECM infection (Fig. 6g,h). Collectively, our data indicate that the reduction in the numbers of circulating and brain‐infiltrating CD8+ T cells protects mice from excessive inflammation associated with ECM and improves mouse survival.
Figure 6.
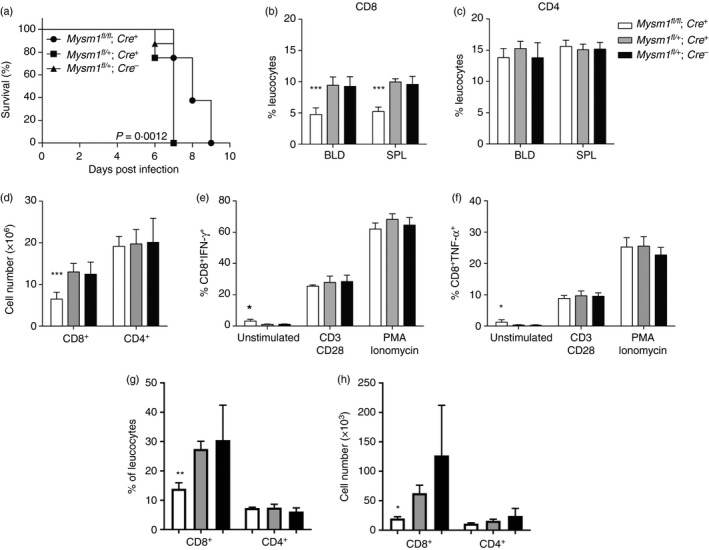
Increased resistance to experimental cerebral malaria in Mysm1 fl/fl CD4‐Cre mice. (a) Survival of CD4‐Cre Mysm1 fl/fl mice after infection with 1 × 10⁶ Plasmodium berghei‐infected erythrocytes. Six to eight mice per experimental group were infected. Survival analysis has been carried out with Kaplan–Meier regression analysis and log rank test. All comparisons shown are between Mysm1 fl/fl CD4‐Cre and Mysm1 fl/+ CD4‐Cre mice. Results are representative of three identical experiments. (b, c) Frequencies of CD8+ and CD4+ T cells in the spleen and blood, and (d) absolute numbers of CD8+ and CD4+ T cells in the spleen of experimental cerebral malaria (ECM) ‐infected mice at day 5 of infection. (e, f) Interferon‐γ (IFN‐γ) and tumour necrosis factor‐α (TNF‐α) cytokine production in CD8+ T cells after 24 hr of re‐stimulation in culture; five mice per group. (g) Frequencies of CD8+ and CD4+ T cells in the brain and (h) absolute numbers of CD8+ and CD4+ T cells in the brain of ECM‐infected mice at day 6 of infection. The gating strategy included singlets > debris > lymphocytes > live cells > CD4/CD8. White bars – CD4‐Cre Mysm1 fl/fl, grey bars – CD4‐Cre Mysm1 fl/+, and black bars – Mysm1 fl/+. All comparisons shown are between Mysm1 fl/fl CD4‐Cre and Mysm1 fl/+ CD4‐Cre mice. Statistical analysis was performed with an unpaired Student's t‐test. *P < 0·05, **P < 0·01, ***P < 0·001.
Discussion
Our understanding of the role of chromatin‐modifying factors in the maintenance and activation of T cells remains limited. With this study, we identified MYSM1 as a positive regulator of post‐thymic CD8+ T‐cell development and maintenance. Furthermore, we found that Mysm1 deficiency in T cells leads to increased CD8+ T‐cell activation in vitro, coinciding with impaired proliferation, an increase in apoptosis and up‐regulation of p53.
MYSM1 has been shown to control the development of several other haematopoietic lineages, including B cells, natural killer cells and dendritic cells.12, 18, 19 This is attributed to the role of MYSM1 in the direct transcriptional regulation of genes encoding lineage‐specific transcription factors like Ebf1 and Id2 for B cells and natural killer cells, respectively.12, 18, 19 Numerous transcriptional regulators controlling CD8+ T‐cell development have been identified,35 including FOXO1, FOXO3, RUNX3 and the ELF4/KLF2/KLF4 axis.36, 37, 38, 39, 40 We observed normal expression of Klf2, Klf4 and Foxo3 in Mysm1‐deficient CD8+ T cells from CD4‐Cre Mysm1 fl/fl mice (see Supplementary material, Fig. S7); however, we cannot exclude possible roles of MYSM1 in the regulation of expression of other genes essential for normal CD8+ T‐cell maintenance, providing an interesting hypothesis for the reduction in CD8+ T cells observed in LCK‐Cre and CD4‐Cre Mysm1 fl/fl mice.
MYSM1 was also found to be a critical negative regulator of p53 activity in haematopoiesis, as shown by p53 activation in the bone marrow and thymus of Mysm1‐knockout mice7, 21 and by the rescue of the Mysm1 −/− phenotypic defects in Mysm1 −/− p53 −/− double‐knockout mouse models, including restoration of normal B‐cell and T‐cell lymphopoiesis.20, 21, 26 We recently reported that the depletion of multipotent haematopoietic progenitors in Mysm1 −/− mice is mediated through p53‐dependent induction of Bbc3/PUMA leading to cell apoptosis;26 however, the increased apoptosis of CD8+ T cells in CD4‐Cre Mysm1 fl/fl mice was not associated with alterations in Bbc3/PUMA expression (see Supplementary material, Fig. S7). Recent studies also indicated that p53 activation in Mysm1 −/− mice is linked to the direct role of MYSM1 in transcriptional regulation of p19ARF expression,21 and at present we cannot exclude the possibility that similar mechanisms may operate in peripheral CD8+ T cells in our model. The exact molecular mechanisms leading to p53 induction in Mysm1‐deficient CD8+ T cells, and the role of p53 in mediating CD8+ T‐cell depletion remain to be further addressed in future work.
There is a growing interest in understanding p53 functions in T lymphocytes, and the possible T‐cell‐specific mechanisms in the regulation of p53 pathway activity. These mechanisms probably impact on clinical outcomes such as risks of infection, graft rejection and anti‐tumour immunity in patients undergoing total body irradiation. In particular, recent reports indicate that CD8+ T cells are more sensitive to ionizing radiation than CD4+ T cells, with naive CD44lo T cells being more sensitive than the CD44hi memory cells.41 Further studies report on the role of epigenetic factors such as histone deacetylases in the regulation of T‐cell radio‐resistance.42 We have used ionizing radiation in the context of Mysm1‐deficiency and found that Mysm1‐deleted CD8+ T cells up‐regulate p53 to a greater extent than control CD8+ T cells, and this effect could be recapitulated in Mysm1‐deficient CD4+ T cells at higher radiation doses and later time‐points. Recent studies further revealed the role of the p53 pathway in the regulation of T‐cell proliferation and survival in response to interleukin‐2, anti‐CD28 and TCR stimulation in vitro and in vivo.30, 31, 43 We observed that Mysm1‐deficient CD8 T cells stimulated with anti‐CD3 and anti‐CD28 antibodies showed a stronger induction of p53 protein compared with control CD8+ T cells. Overall our data argue for the role of MYSM1 as a regulator of p53 pathway activity in CD8+ T cells, not only following irradiation, but also under homeostatic conditions and in response to physiological stimulation. These mechanisms may underlie the increased levels of apoptosis and impaired proliferation observed in Mysm1‐deficient CD8+ T cells in vitro, and may contribute to the impaired maintenance of CD8+ T‐cell numbers in vivo in the CD4‐Cre and Lck‐Cre Mysm1 fl/fl mice reported in this study.
In addition, we defined the functional impact of conditional Mysm1 deletion in T cells in a model of ECM, in which pro‐inflammatory CD8+ T cells drive disease pathology. In line with our hypothesis we found that CD4‐Cre Mysm1 fl/fl mice show increased survival. This was accompanied by a reduction of CD8+ T‐cell numbers in infected mice as in naive mice, both in the periphery and in the brain. No major differences in the IFN‐γ or TNF‐α production by CD4+ or CD8+ T cells from the CD4‐Cre Mysm1 fl/fl ECM mice was detected, prompting us to conclude that the improved survival of CD4‐Cre Mysm1 fl/fl mice is probably dependent on the reduction of CD8+ T‐cell numbers. Additionally, a possible protective effect of impaired CD8+ T‐cell cytotoxic actvity cannot be ruled out, given the reduced production of perforin and granzyme B by Mysm1‐deficient CD8+ T cells, at least in naive mice. Of note CD8+ T cells are well established to be important mediators of ECM pathogenesis, as shown by the resistance to ECM of CD8+ T‐cell‐deficient mice, as well as by CD8+ T‐cell infliltration and activation in ECM at the sites of tissue damage.32, 33, 44 In recent studies several other genes, which control T‐cell development and function, have been identified as major determinants of disease progression in ECM.45 For example, a mutation in the Ccdc88b gene was shown to have a pleiotropic effect on T‐cell function in mouse models, controlling inflammatory T‐cell responses and conferring resistance to ECM.46
In this study, we have identified a novel role for chromatin‐interacting deubiquitinase MYSM1 in CD8+ T‐cell development and function. We showed that MYSM1 controls T‐cell activation, proliferation and production of pro‐inflammatory cytokines by CD8+ T cells. Additionally, loss of Mysm1 expression renders these cells predisposed to apoptosis and leads to increased p53 activation in response to either genotoxic stress or to TCR stimulation. Lastly, we demonstrated that conditional deletion of Mysm1 in T cells protects against cerebral malaria in mice, identifying MYSM1 as a novel therapeutic target for this debilitating disease in humans.
Author contribution
MF, RKB, JCP, NF, IA and JK performed the experiments; MF, AN and RKB analysed the data, MF and AN wrote the paper; AN and PG supervised the work.
Disclosure
The authors declare that there are no conflicts of interest.
Supporting information
Figure S1. Validation of Mysm1 fl to Mysm1 Δ allele conversion in Mysm1 fl/fl CD4‐Cre and Mysm1 fl/fl CreERT2 mouse models through genomic PCR.
Figure S2. Characterization of the CD4‐Cre Mysm1 fl/fl mouse model.
Figure S3. Activation of in vitro re‐stimulated T cells from CD4‐Cre Mysm1 fl/fl mice.
Figure S4. Cytokine production in in vitro stimulated CD4+ T cells from CD4‐Cre Mysm1 fl/fl mice.
Figure S5. Proliferation of in vitro stimulated CD8+ and CD4+ T cells from CD4‐Cre Mysm1 fl/fl mice, measured with CFSE‐dilution assay.
Figure S6. Production of perforin and granzyme B by CD8+ T cells from CD4‐Cre Mysm1 fl/fl mice.
Figure S7. Quantitative RT‐PCR analysis of gene expression in CD8+ T cells isolated from the spleen of CD4‐Cre Mysm1 fl/fl and control mice.
Acknowledgements
This work was funded by the Canadian Institutes of Health Research (CIHR, grant 123403 to AN), the Canadian Foundation for Innovation (CFI, grant 29838 to AN), and Startup Funds from the McGill University Faculty of Medicine. AN is a Canada Research Chair Tier 2 in Haematopoiesis and Lymphocyte Differentiation (grant 950‐228977). MF was a recipient of an International Postdoctoral Fellowship from the German Research Association (grant DFG FO 900/1‐1) and The Cole Foundation Postdoctoral Fellowship. The authors would like to express their sincere gratitude to Tanya Koch, Geneviève Perreault, Patricia D'Arcy and other staff of McGill Comparative Medicine and Animal Resources Centre (CMARC) for their technical assistance; Dr Anatoli Onichtchenko for genotyping and colony maintenance; Alexandria Crandall for genotyping and assistance with experiments; Dr Irena Radovanovic for help with preparation of the figures and expert comments on the manuscript.
References
- 1. Belle JI, Nijnik A. H2A‐DUBbing the mammalian epigenome: expanding frontiers for histone H2A deubiquitinating enzymes in cell biology and physiology. Int J Biochem Cell Biol 2014; 50:161–74. [DOI] [PubMed] [Google Scholar]
- 2. Wang H, Wang L, Erdjument‐Bromage H, Vidal M, Tempst P, Jones RS et al Role of histone H2A ubiquitination in Polycomb silencing. Nature 2004; 431:873–8. [DOI] [PubMed] [Google Scholar]
- 3. Boyer LA, Plath K, Zeitlinger J, Brambrink T, Medeiros LA, Lee TI et al Polycomb complexes repress developmental regulators in murine embryonic stem cells. Nature 2006; 441:349–53. [DOI] [PubMed] [Google Scholar]
- 4. Goldknopf I, Busch H. Isopeptide linkage between nonhistone and histone 2A polypeptides of chromosomal conjugate‐protein A24. Proc Natl Acad Sci USA 1977; 74:864–8. [DOI] [PMC free article] [PubMed] [Google Scholar]
- 5. de Napoles M, Mermoud JE, Wakao R, Tang YA, Endoh M, Appanah R et al Polycomb group proteins Ring1A/B link ubiquitylation of histone H2A to heritable gene silencing and X inactivation. Dev Cell 2004; 7:663–76. [DOI] [PubMed] [Google Scholar]
- 6. Vissers JH, van Lohuizen M, Citterio E. The emerging role of Polycomb repressors in the response to DNA damage. J Cell Sci 2012; 125:3939–48. [DOI] [PubMed] [Google Scholar]
- 7. Nijnik A, Clare S, Hale C, Raisen C, McIntyre RE, Yusa K et al The critical role of histone H2A‐deubiquitinase Mysm1 in hematopoiesis and lymphocyte differentiation. Blood 2012; 119:1370–9. [DOI] [PubMed] [Google Scholar]
- 8. Alsultan A, Shamseldin HE, Osman ME, Aljabri M, Alkuraya FS. MYSM1 is mutated in a family with transient transfusion‐dependent anemia, mild thrombocytopenia, and low NK‐ and B‐cell counts. Blood 2013; 122:3844–5. [DOI] [PubMed] [Google Scholar]
- 9. Wang T, Nandakumar V, Jiang XX, Jones L, Yang AG, Huang XF et al The control of hematopoietic stem cell maintenance, self‐renewal, and differentiation by Mysm1‐mediated epigenetic regulation. Blood 2013; 122:2812–22. [DOI] [PMC free article] [PubMed] [Google Scholar]
- 10. Le Guen T, Touzot F, Andre‐Schmutz I, Lagresle‐Peyrou C, France B, Kermasson L et al An in vivo genetic reversion highlights the crucial role of Myb‐Like, SWIRM, and MPN domains 1 (MYSM1) in human hematopoiesis and lymphocyte differentiation. J Allergy Clin Immunol 2015; 136:1619–26. [DOI] [PubMed] [Google Scholar]
- 11. Liakath‐Ali K, Vancollie VE, Heath E, Smedley DP, Estabel J, Sunter D et al Novel skin phenotypes revealed by a genome‐wide mouse reverse genetic screen. Nat Commun 2014; 5:3540. [DOI] [PMC free article] [PubMed] [Google Scholar]
- 12. Jiang XX, Nguyen Q, Chou Y, Wang T, Nandakumar V, Yates P et al Control of B cell development by the histone H2A deubiquitinase MYSM1. Immunity 2011; 35:883–96. [DOI] [PMC free article] [PubMed] [Google Scholar]
- 13. Zhu P, Zhou W, Wang J, Puc J, Ohgi KA, Erdjument‐Bromage H et al A histone H2A deubiquitinase complex coordinating histone acetylation and H1 dissociation in transcriptional regulation. Mol Cell 2007; 27:609–21. [DOI] [PMC free article] [PubMed] [Google Scholar]
- 14. Pannu J, Belle JI, Forster M, Duerr CU, Shen S, Kane L et al Ubiquitin specific protease 21 is dispensable for normal development, hematopoiesis and lymphocyte differentiation. PLoS One 2015; 10:e0117304. [DOI] [PMC free article] [PubMed] [Google Scholar]
- 15. Gao Y, Lin F, Xu P, Nie J, Chen Z, Su J et al USP22 is a positive regulator of NFATc2 on promoting IL2 expression. FEBS Lett 2014; 588:878–83. [DOI] [PubMed] [Google Scholar]
- 16. Frangini A, Sjoberg M, Roman‐Trufero M, Dharmalingam G, Haberle V, Bartke T et al The aurora B kinase and the polycomb protein ring1B combine to regulate active promoters in quiescent lymphocytes. Mol Cell 2013; 51:647–61. [DOI] [PubMed] [Google Scholar]
- 17. Gu Y, Jones AE, Yang W, Liu S, Dai Q, Liu Y et al The histone H2A deubiquitinase Usp16 regulates hematopoiesis and hematopoietic stem cell function. Proc Natl Acad Sci USA 2016; 113:E51–60. [DOI] [PMC free article] [PubMed] [Google Scholar]
- 18. Nandakumar V, Chou Y, Zang L, Huang XF, Chen SY. Epigenetic control of natural killer cell maturation by histone H2A deubiquitinase, MYSM1. Proc Natl Acad Sci USA 2013; 110:E3927–36. [DOI] [PMC free article] [PubMed] [Google Scholar]
- 19. Won H, Nandakumar V, Yates P, Sanchez S, Jones L, Huang XF et al Epigenetic control of dendritic cell development and fate determination of common myeloid progenitor by Mysm1. Blood 2014; 124:2647–56. [DOI] [PMC free article] [PubMed] [Google Scholar]
- 20. Belle JI, Langlais D, Petrov JC, Pardo M, Jones RG, Gros P et al p53 mediates loss of hematopoietic stem cell function and lymphopenia in Mysm1‐deficiency. Blood 2015; 125:2344–8. [DOI] [PubMed] [Google Scholar]
- 21. Gatzka M, Tasdogan A, Hainzl A, Allies G, Maity P, Wilms C et al Interplay of H2A deubiquitinase 2A‐DUB/Mysm1 and the p19/p53 axis in hematopoiesis, early T‐cell development and tissue differentiation. Cell Death Differ 2015; 22:1451–62. [DOI] [PMC free article] [PubMed] [Google Scholar]
- 22. Huang XF, Nandakumar V, Tumurkhuu G, Wang T, Jiang X, Hong B et al Mysm1 is required for interferon regulatory factor expression in maintaining HSC quiescence and thymocyte development. Cell Death Dis 2016; 7:e2260. [DOI] [PMC free article] [PubMed] [Google Scholar]
- 23. Orban PC, Chui D, Marth JD. Tissue‐ and site‐specific DNA recombination in transgenic mice. Proc Natl Acad Sci USA 1992; 89:6861–5. [DOI] [PMC free article] [PubMed] [Google Scholar]
- 24. Lee PP, Fitzpatrick DR, Beard C, Jessup HK, Lehar S, Makar KW et al A critical role for Dnmt1 and DNA methylation in T cell development, function, and survival. Immunity 2001; 15:763–74. [DOI] [PubMed] [Google Scholar]
- 25. Forster M, Belle JI, Petrov JC, Ryder EJ, Clare S, Nijnik A. Deubiquitinase MYSM1 is essential for normal fetal liver hematopoiesis and for the maintenance of hematopoietic stem cells in adult bone marrow. Stem Cells Dev 2015; 24:1865–77. [DOI] [PubMed] [Google Scholar]
- 26. Belle JI, Petrov JC, Langlais D, Robert F, Cencic R, Shen S et al Repression of p53‐target gene Bbc3/PUMA by MYSM1 is essential for the survival of hematopoietic multipotent progenitors and contributes to stem cell maintenance. Cell Death Differ 2016; 23:759–75. [DOI] [PMC free article] [PubMed] [Google Scholar]
- 27. Pino PA, Cardona AE. Isolation of brain and spinal cord mononuclear cells using Percoll gradients. J Vis Exp 2011; 48:2348. [DOI] [PMC free article] [PubMed] [Google Scholar]
- 28. Berghout J, Langlais D, Radovanovic I, Tam M, MacMicking JD, Stevenson MM et al Irf8‐regulated genomic responses drive pathological inflammation during cerebral malaria. PLoS Pathog 2013; 9:e1003491. [DOI] [PMC free article] [PubMed] [Google Scholar]
- 29. Berghout J, Min‐Oo G, Tam M, Gauthier S, Stevenson MM, Gros P et al Identification of a novel cerebral malaria susceptibility locus (Berr5) on mouse chromosome 19. Genes Immun 2010; 11:310–18. [DOI] [PubMed] [Google Scholar]
- 30. Singh N, Huang L, Qin H. Defective T‐cell receptor‐induced apoptosis of T cells and rejection of transplanted immunogenic tumors in p53−/− mice. Eur J Immunol 2010; 40:559–68. [DOI] [PubMed] [Google Scholar]
- 31. Watanabe M, Moon KD, Vacchio MS, Hathcock KS, Hodes RJ. Downmodulation of tumor suppressor p53 by T cell receptor signaling is critical for antigen‐specific CD4+ T cell responses. Immunity 2014; 40:681–91. [DOI] [PMC free article] [PubMed] [Google Scholar]
- 32. Belnoue E, Kayibanda M, Vigario AM, Deschemin JC, van Rooijen N, Viguier M et al On the pathogenic role of brain‐sequestered αβ CD8+ T cells in experimental cerebral malaria. J Immunol 2002; 169:6369–75. [DOI] [PubMed] [Google Scholar]
- 33. Nitcheu J, Bonduelle O, Combadiere C, Tefit M, Seilhean D, Mazier D et al Perforin‐dependent brain‐infiltrating cytotoxic CD8+ T lymphocytes mediate experimental cerebral malaria pathogenesis. J Immunol 2003; 170:2221–8. [DOI] [PubMed] [Google Scholar]
- 34. Amani V, Vigario AM, Belnoue E, Marussig M, Fonseca L, Mazier D. Involvement of IFN‐γ receptor‐medicated signaling in pathology and anti‐malarial immunity induced by Plasmodium berghei infection. Eur J Immunol 2000; 30:1646–55. [DOI] [PubMed] [Google Scholar]
- 35. Rothenberg EV. The chromatin landscape and transcription factors in T cell programming. Trends Immunol 2014; 35:195–204. [DOI] [PMC free article] [PubMed] [Google Scholar]
- 36. Hess Michelini R, Doedens AL, Goldrath AW, Hedrick SM. Differentiation of CD8 memory T cells depends on Fox J Exp Med, 2013; 210:1189–200. [DOI] [PMC free article] [PubMed] [Google Scholar]
- 37. Sullivan JA, Kim EH, Plisch EH, Peng SL, Suresh M. FOXO3 regulates CD8 T cell memory by T cell‐intrinsic mechanisms. PLoS Pathog 2012; 8:e1002533. [DOI] [PMC free article] [PubMed] [Google Scholar]
- 38. Yamada T, Park CS, Mamonkin M, Lacorazza HD. Transcription factor ELF4 controls the proliferation and homing of CD8+ T cells via the Kruppel‐like factors KLF4 and KLF2. Nat Immunol 2009; 10:618–26. [DOI] [PMC free article] [PubMed] [Google Scholar]
- 39. Taniuchi I, Osato M, Egawa T, Sunshine MJ, Bae SC, Komori T et al Differential requirements for Runx proteins in CD4 repression and epigenetic silencing during T lymphocyte development. Cell 2002; 111:621–33. [DOI] [PubMed] [Google Scholar]
- 40. Woolf E, Xiao C, Fainaru O, Lotem J, Rosen D, Negreanu V et al Runx3 and Runx1 are required for CD8 T cell development during thymopoiesis. Proc Natl Acad Sci USA 2003; 100:7731–6. [DOI] [PMC free article] [PubMed] [Google Scholar]
- 41. Yao Z, Jones J, Kohrt H, Strober S. Selective resistance of CD44hi T cells to p53‐dependent cell death results in persistence of immunologic memory after total body irradiation. J Immunol 2011; 187:4100–8. [DOI] [PMC free article] [PubMed] [Google Scholar]
- 42. Pugh JL, Sukhina AS, Seed TM, Manley NR, Sempowski GD, van den Brink MR et al Histone deacetylation critically determines T cell subset radiosensitivity. J Immunol 2014; 193:1451–8. [DOI] [PMC free article] [PubMed] [Google Scholar]
- 43. Grayson JM, Lanier JG, Altman JD, Ahmed R. The role of p53 in regulating antiviral T cell responses. J Immunol 2001; 167:1333–7. [DOI] [PubMed] [Google Scholar]
- 44. Belnoue E, Potter SM, Rosa DS, Mauduit M, Gruner AC, Kayibanda M et al Control of pathogenic CD8+ T cell migration to the brain by IFN‐γ during experimental cerebral malaria. Parasite Immunol 2008; 30:544–53. [DOI] [PubMed] [Google Scholar]
- 45. Longley R, Smith C, Fortin A, Berghout J, McMorran B, Burgio G et al Host resistance to malaria: using mouse models to explore the host response. Mamm Genome 2011; 22:32–42. [DOI] [PubMed] [Google Scholar]
- 46. Kennedy JM, Fodil N, Torre S, Bongfen SE, Olivier JF, Leung V et al CCDC88B is a novel regulator of maturation and effector functions of T cells during pathological inflammation. J Exp Med 2014; 211:2519–35. [DOI] [PMC free article] [PubMed] [Google Scholar]
Associated Data
This section collects any data citations, data availability statements, or supplementary materials included in this article.
Supplementary Materials
Figure S1. Validation of Mysm1 fl to Mysm1 Δ allele conversion in Mysm1 fl/fl CD4‐Cre and Mysm1 fl/fl CreERT2 mouse models through genomic PCR.
Figure S2. Characterization of the CD4‐Cre Mysm1 fl/fl mouse model.
Figure S3. Activation of in vitro re‐stimulated T cells from CD4‐Cre Mysm1 fl/fl mice.
Figure S4. Cytokine production in in vitro stimulated CD4+ T cells from CD4‐Cre Mysm1 fl/fl mice.
Figure S5. Proliferation of in vitro stimulated CD8+ and CD4+ T cells from CD4‐Cre Mysm1 fl/fl mice, measured with CFSE‐dilution assay.
Figure S6. Production of perforin and granzyme B by CD8+ T cells from CD4‐Cre Mysm1 fl/fl mice.
Figure S7. Quantitative RT‐PCR analysis of gene expression in CD8+ T cells isolated from the spleen of CD4‐Cre Mysm1 fl/fl and control mice.